The National Service Framework (NSF) for Mental Health has identified that the reduction of suicide by one-fifth by 2010 is both a national priority and a high-level performance indicator (Department of Health, 1999). However, relying on suicide rate as a parameter, and in isolation, could be criticised for being inappropriate as a performance indicator of mental health, and for being difficult to monitor and interpret at local level because of the small number of such events.
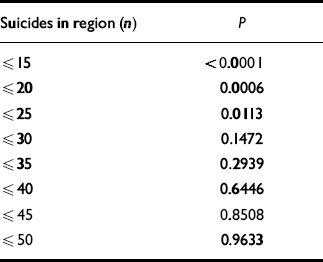
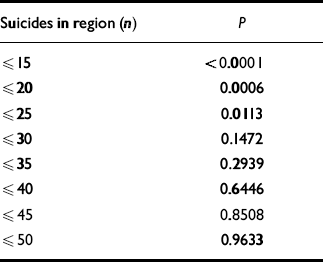
Counting the number of occurrences of an event that happens relatively infrequently, such as suicide, given the number of times that it could happen, follows a Poisson distribution. A Poisson distribution is specified by just one parameter — the mean. So, for example, if we know that in North Cheshire (population 350 000) the suicide rate is 11 per 100 000 with an annual average of 39 reported incidents, we can calculate the probability that there will be no suicides or a certain number of suicides within a year (Reference Ryan, Joiner and RyanRyan et al, 1985) (Table 1).
Table 1 Cumulative distribution function for suicides in North Cheshire1

| Suicides in region (n) | P |
|---|---|
| ≤ 15 | < 0.0001 |
| ≤ 20 | 0.0006 |
| ≤ 25 | 0.0113 |
| ≤ 30 | 0.1472 |
| ≤ 35 | 0.2939 |
| ≤ 40 | 0.6446 |
| ≤ 45 | 0.8508 |
| ≤ 50 | 0.9633 |
According to Table 1, the probability of there being ≤35 suicides in a year within North Cheshire is P=0.29, meaning that there is a 29% chance that the number of suicides could be reduced from 39 to 35 (10% reduction) by chance alone. On the other hand, the probability of having 45 suicides or more in North Cheshire in a given year is P=(1-0.85)=0.15, which means that there is a 15% chance that there could be an increase in the number of suicides from 39 to 45 (15%) per year by chance alone. Neither the increase nor the reduction in the probability of suicide depends on any specific changes in the locally available mental health services.
The NSF target of 20% reduction in suicide rate means that in North Cheshire the rate will come down from 11 per 100 000 (i.e. a reduction of 8 suicides per year from 39 to 31) by 2010. Again, looking at the Poisson probability function, one can expect a 15% chance (P=0.147) of 31 suicides or fewer occurring by chance alone. This means that we have a 15% chance of achieving the NSF target in reduction of suicide by good luck alone and without any effective psychosocial intervention or change in practice.
One may conclude that some change in suicide rate is expected to occur, and indeed does occur, within the same locality and independently of the mental health services, and is of no real significance. This could plausibly imply that a reduced suicide rate may be, at least partly, a statistical illusion due to reasons totally unrelated to the effectiveness or quality of psychiatric care. What is needed is a valid quality control model (similar to ‘control charts’ used so effectively in industry), and not just a single parameter, in order to reflect the complexity of suicide. Variables such as staffing levels, consultant vacancies, resources, community psychiatric nurses, beds, unemployment, housing, education, crime, alcohol and drugs, inflation index, morbidity levels, deprivation, etc. should be included and adjusted for within the model, so that we may interpret some genuine changes in suicide rates in a realistic and meaningful way, locally and nationally.
Unfortunately, we will never be sure of the number of suicides that we actually prevent every day, but we will always remember, or be reminded of, those that we fail to prevent.


eLetters
No eLetters have been published for this article.