


The type and quantity of services received by patients are not determined by severity of illness and need alone. A number of patient and supplier characteristics will influence resource use, and thus the total cost of care. Explicit knowledge of the characteristics that predict high and low cost can provide valuable information to aid budgetary planning and allows the appropriateness of current expenditure patterns to be assessed. The aim of this study was to evaluate the relationship between baseline characteristics of patients in the UK700 case management trial and the total direct cost of care provided over the following 2 years. It was hypothesised that the total cost of care would be associated with:
-
(a) the intervention received (intensive or standard case management);
-
(b) demographic characteristics;
-
(c) socio-economic characteristics;
-
(d) diagnosis;
-
(e) severity of illness;
-
(f) need.
METHODS
Patients
The rationale, methods and results of the UK700 case management trial have been described elsewhere (UK700 Group, 1999a , b ). In brief, patients from four inner-city areas were included in the study if they were aged between 18 and 65 years, had suffered from a psychotic illness of at least 2 years' duration and had been admitted to a psychiatric hospital at least twice, once within the previous 2 years. Patients were excluded if they had organic brain damage or a primary diagnosis of substance misuse. A total of 708 patients were randomly allocated to standard case management (case-loads of 30 to 35) or intensive case management (case-loads of 10 to 15). For 41 of these patients, insufficient information was available for costing purposes, thus 667 patients were included in the current analysis. Clinical and resource use data were assessed over 2 years from the date of trial entry, using an intention-to-treat design.
Baseline measures
Baseline measures taken at the point of entry into the UK700 trial included:
-
▪ (a) demographic and socio-economic characteristics.
-
▪ (b) life circumstances over the previous 24 months (covering areas of residence, work, symptoms and treatment) recorded in a modified WHO Life Chart (World Health Organization, 1992).
-
▪ (c) diagnosis determined by a structured examination of case notes, using the OPCRIT (Reference McGuffin, Farmer and HarveyMcGuffin et al, 1991).
-
▪ (d) clinical status assessed using the Comprehensive Psychiatric Rating Scale (CPRS) and including a sub-scale for current depression (MADRS) (Reference Åsberg, Montgomery and PerrisÅsberg et al, 1978).
-
▪ (e) quality of life assessed using the Lancashire Quality of Life Profile (LQOL) (Reference Oliver, Huxley and PriebeOliver et al, 1997).
-
▪ (f) social disability measured by the WHO Disability Assessment Schedule (DAS) (Reference Jablensky, Schwartz and TomovJablensky et al, 1980).
-
▪ (g) negative symptoms determined using the Scale for the Assessment of Negative Symptoms (SANS) (Reference AndreasenAndreasen, 1989).
-
▪ (h) the Abnormal Involuntary Movements Scale (AIMS) measuring tardive dyskinesia (Reference GuyGuy, 1976).
-
▪ (j) patient needs recorded using the Camberwell Assessment of Need (CAN) (Reference Phelan, Slade and ThornicroftPhelan et al, 1995).
From the baseline variables available, a limited set of possible predictors of cost were selected (listed in Table 1) on the basis of current literature (Knapp et al, Reference Knapp, Beecham and Anderson1990, Reference Knapp, Beecham and Fenyo1995; Reference Chisholm, Knapp and AstinChisholm et al, 1997; Reference McCrone, Thornicroft and ParkmanMcCrone et al, 1998) and discussions with clinical experts in the four centres. Only total 2-year costs, the dependent variable, and intervention received over the period of the trial were post-baseline. The intervention group was considered in order to adjust for the impact that type of case management may have on total cost post-baseline.
Table 1 Univariate predictors of total 2-year cost (£)

| Variable (n =667) | n 1 | Mean 2-year cost (s.d.) | P |
|---|---|---|---|
| Intervention received | |||
| Randomisation status | |||
| Intensive case management | 335 | 24 553 (23 408) | |
| Standard case management | 332 | 22 704 (22 000) | 0.29 |
| Demographic variables | |||
| Centre | |||
| St George's | 185 | 21 811 (23 976) | |
| Manchester | 149 | 25 327 (24 072) | |
| St Mary's | 189 | 23 133 (19 779) | |
| King's | 144 | 24 877 (23 263) | 0.47 |
| Gender | |||
| Female | 291 | 21 407 (22 071) | |
| Male | 376 | 25 355 (23 091) | 0.03 |
| Ethnicity | |||
| Black Caribbean | 191 | 24 107 (22 040) | |
| Other | 135 | 23 170 (21 592) | |
| White | 341 | 23 551 (23 573) | 0.93 |
| Age at randomisation2 | |||
| <36 years | 324 | 27 276 (25 246) | |
| ≥ 36 years | 343 | 20 192 (19 464) | <0.001 |
| Socio-economic variables | |||
| Social class | |||
| Manual/unemployed | 354 | 22 477 (22 435) | |
| Non-manual | 186 | 23 958 (22 880) | 0.47 |
| Employment in previous 2 years | |||
| Employed | 115 | 16 518 (18 167) | |
| 1-12 months unemployed | 79 | 31 699 (27 396) | |
| 13-24 months unemployed | 472 | 23 993 (22 407) | <0.0001 |
| Marital status | |||
| Single | 438 | 26 309 (24 027) | |
| Living as married | 77 | 13 512 (16 904) | |
| Divorced/separated/widowed | 152 | 21 048 (19 555) | <0.0001 |
| Independent living in previous 2 years | |||
| No indepenent living | 78 | 38 526 (18 701) | |
| 1-12 months | 65 | 40 373 (29 883) | |
| 13-24 months | 534 | 19 340 (20 253) | <0.0001 |
| Living alone | |||
| Yes | 278 | 23 387 (23 279) | |
| No | 311 | 20 117 (21 670) | 0.08 |
| Days in prison over previous 2 years | |||
| No time in jail | 603 | 22 869 (22 336) | |
| Been in jail | 63 | 31 098 (25 238) | 0.006 |
| Years of education2 | |||
| <12 years | 396 | 24 135 (23 160) | |
| ≥ 12 years | 257 | 23 490 (22 317) | 0.30 |
| Diagnosis | |||
| OPCRIT RDC diagnosis | |||
| Affective | 47 | 19 756 (17 688) | |
| Schizoaffective | 327 | 23 713 (22 792) | |
| Schizophrenia | 253 | 24 331 (23 882) | |
| Unspecified | 40 | 23 117 (19 921) | 0.65 |
| Severity of illness | |||
| Suicide attempts in previous 2 years | |||
| Yes | 116 | 28 049 (26 926) | |
| No | 549 | 22 566 (21 737) | 0.02 |
| AIMS | |||
| No abnormal movements | 414 | 21 806 (21 443) | |
| Some abnormal movements | 237 | 26 462 (24 639) | 0.01 |
| Duration2 | |||
| < 120 months | 317 | 25 300 (24 916) | |
| ≥ 120 months | 348 | 22 123 (20 470) | 0.83 |
| CPRS score2 | |||
| < 17 | 313 | 21 788 (22 554) | |
| ≥ 17 | 321 | 25 481 (22 763) | 0.002 |
| MADRS score2 | |||
| < 8 | 269 | 23 321 (22 348) | |
| ≥ 8 | 397 | 23 821 (23 018) | 0.25 |
| SANS score2 | |||
| < 18 | 313 | 21 695 (23 110) | |
| ≥ 18 | 342 | 25 177 (22 349) | 0.02 |
| Perceived QOL2 | |||
| < 4.27 | 324 | 25 908 (23 641) | |
| ≥ 4.27 | 325 | 20 832 (21 269) | 0.04 |
| DAS total score2 | |||
| < 1 | 302 | 21 249 (22 120) | |
| ≥ 1 | 356 | 25 637 (23 119) | 0.005 |
| Days in hospital for psychiatric reasons over previous 2 years2 | |||
| < 71 days | 333 | 16 445 (17 260) | |
| ≥ 71 days | 334 | 30 799 (25 144) | < 0.0001 |
| Unmet needs | |||
| CAN number of unmet needs2 | |||
| < 3 | 367 | 22 320 (22 018) | |
| ≥ 3 | 292 | 24 962 (23 094) | 0.03 |
Total 2-year costs
Data on the use of all hospital and community services were collected prospectively for each patient from entry to the trial for a period of 2 years, providing a total 2-year direct cost per patient (UK700 Group, 2000). Resources used included hospital and primary care services (in-patient, day patient, out-patient, emergency and out-of-hours clinics, accident and emergency, community mental health team, general practitioner, practice nurse and medication), social and non-statutory services (social work, staff accommodation, day and drop-in centres, sheltered work-shops, meals, home care and transport) and prison and police custody. All unit costs were calculated for the financial year 1997/98 and future costs were discounted at an annual rate of 6%.
Statistical methods
A statistical analysis plan detailing the approach to be taken for investigating the relationship between baseline measures and subsequent 2-year cost was drawn up prior to inspecting the data. Univariate associations between each of the specified predictors and subsequent total costs were investigated. For categorical variables analysis of variance was used, and for continuous variables simple linear regressions were fitted. Results for continuous variables are presented in two groups split at the median value, but analyses were actually carried out on the continuous data.
Multiple regression was used to reduce the variable set to those independently associated with costs. For these analyses, categorical variables were included in the usual way, with sets of indicators describing the groups as defined in Table 1. Variables were selected using an approach recommended by Collett (Reference Collett1994) for survival data. This involved, in the first instance, fitting a multiple regression model which included all variables that had important univariate associations with costs and discarding from this model all variables that ceased to be important. Second, each variable that did not have a univariate association with costs was added, one at a time, to the multiple regression model and retained if it added significantly to the model or otherwise discarded. The model finally arrived at was then checked to ensure that none of the terms currently excluded would add significantly to it. In carrying out this procedure a significance level of around 10% was used, but this was not rigidly applied (Reference Knapp, Beecham and AndersonKnapp et al, 1990; Reference CollettCollett, 1994). Non-linearity of continuous covariates in the final model was examined by including higher-order terms. Pre-specified inter-actions were also considered.
Standard ordinary least-squares regression methods on untransformed costs were used for all analyses despite the skewed distribution of cost data. The advantage of this approach, as opposed to logarithmic transformation or conventional non-parametric tests, is the ability to make inferences about the arithmetic mean (Reference Barber and ThompsonBarber & Thompson, 1998). Results from the main analyses were, however, subject to two checks. First, they were compared with the results from non-parametric bootstrap regression to assess the robustness of confidence intervals and P values to non-normality in the cost distribution (Reference Efron and TibshiraniEfron & Tibshirani, 1993). Second, they were compared with the results obtained from a generalised linear model where a non-normal distribution (gamma distribution) was assumed for costs (Reference Blough, Madden and HornbrookBlough et al, 1999).
RESULTS
Total cost
The average total cost per patient over the 2 years following trial entry was calculated to be £23633 (s.d.=£22720). The large standard deviation is a result of the highly skewed nature of the costs, demonstrated in Fig. 1.

Fig. 1 Histogram of total 2-year costs (£) for the 667 patients in the UK700 trial.
Univariate results
Table 1 details all univariate analyses. In terms of demographic and socio-economic characteristics, higher costs were significantly associated with being male, young, unemployed, single, living alone, having little or no independent living and having spent time in jail. In terms of diagnostic and other clinical variables, higher costs were significantly associated with suicide attempts over the previous 2 years, abnormal movements (AIMS), higher CPRS scores, a great number of negative symptoms (SANS), a lower level of perceived quality of life (LQOL), greater social disability (DAS), a greater number of days in hospital for psychiatric reasons over the previous 2 years and a greater number of unmet needs (CAN).
No significant univariate associations were found between costs and type of case management received, centre, ethnicity, social class, years of education, diagnosis, duration of illness and level of depression (MADRS).
Multiple regression
The final multiple regression model obtained before considering interactions and non-linear effects is shown in Table 2. The variables most strongly associated with costs were age, months in independent living over the previous 2 years, duration of illness and days spent in hospital for psychiatric reasons over previous 2 years. On average, costs were lower for older subjects, those spending more time living independently, those having shorter periods of illness and those spending fewer days in hospital. Although duration of illness was not found to be univariately associated with costs, it became a significant factor in regression models that included age as a covariate. This is because duration of illness in some way also describes age, since those having longer durations of illness are generally older. This is clear from the high correlation between age and duration of illness (correlation coefficient=0.7). Controlling for the age effect, by including age as a covariate, allows the effect of duration of illness alone to be demonstrated. This effect is in the opposite direction to that of age, with longer periods of illness being associated with increased costs.
Table 2 Multivariate predictors of total 2-year cost (£)

| Variable (n=651) | Coefficient (95% CI)1 | P |
|---|---|---|
| Demographic variables | ||
| Age (years) | -383 (-590 to ‒175) | <0.001 |
| Socio-economic variables | ||
| Marital status (compared with being single) | ||
| Living as married | -5657 (-10 754 to ‒560) | |
| Divorced/separated/widowed | -397 (-4565 to 3770) | 0.08 |
| Months independent living (compared with no independent living) | ||
| 1-12 months | -1673 (-8352 to 5006) | |
| 12-24 months | -11 552 (-16 585 to ‒6520) | <0.001 |
| Severity of illness | ||
| Duration of illness (months) | 28 (9 to 47) | 0.004 |
| Days in hospital for psychiatric reasons over previous | 61 (45 to 76) | <0.001 |
| 2 years | ||
| DAS (total score) | 1563 (-357 to 3482) | 0.11 |
| Unmeet needs | ||
| CAN number of unmet needs | 560 (-132 to 1252) | 0.11 |
Marital status, level of social disability and number of unmet needs were also associated with total cost in the multiple regression model, but less strongly. The directions of these relationships were such that lower costs were associated with living as married, having lower social disability and fewer unmet needs, as would be expected.
Results from bootstrap regression analyses and those based on generalised linear models with gamma-distributed errors were not substantially different from the ordinary least-squares regression results reported in the tables.
Interactions and non-linear terms
Investigations of pre-specified interaction terms and non-linear relationships among variables in the final model indicated a non-linear relationship for age and two significant interaction terms between independent living and social disability (DAS score) (P=0.02) and independent living and hospitalisation for psychiatric reasons (P<0.001). The multiple regression model extended to include these terms is shown in Table 3.
Table 3 Multivariate predictors of total 2-year cost (£) including non-linear and interaction terms

| Variable (n=651) | Coefficient (95% CI)1 | P |
|---|---|---|
| Demographic variables | ||
| Age in quartiles (compared with <29) | ||
| 30-36 years | -7804 (-12 150 to ‒3458) | |
| 37-46 years | -9064 (-14 162 to ‒3966) | |
| 47-70 years | -10 379 (-16 606 to ‒4152) | 0.001 |
| Socio-economic variables | ||
| Marital status (compared with being single) | ||
| Living as married | -5184 (-10 214 to ‒154) | |
| Divorced/separated/widowed | -181 (-4254 to 3893) | 0.11 |
| Months independent living (compared with no independent living) | ||
| 1-12 months | 7222 (-6414 to 20 857) | |
| 12-24 months | -13 975 (-23 117 to ‒4834) | <0.001 |
| Severity of illness | ||
| Duration of illness (months) | 23 (5 to 41) | 0.013 |
| Unmet needs | ||
| CAN number of unmet needs | 498 (-181 to 1177) | 0.15 |
| Interactions by independent living | ||
| Days in hospital for psychiatric reasons | ||
| For no independent living | 24 (-0.3 to 49) | 0.05 |
| For 1-12 months independent living | 51 (20 to 81) | 0.001 |
| For 13-24 months independent living | 99 (75 to 123) | <0.001 |
| DAS (total score) | ||
| For no independent living | 6615 (2008 to 11 221) | 0.005 |
| For 1-12 months independent living | -4207 (-10 821 to 2408) | 0.21 |
| For 13-24 months independent living | 934 (-1179 to 3046) | 0.39 |
The non-linear relationship with age indicated that at low ages, costs initially decreased then levelled off as age increased. To allow for this effect, age was included in the model as a categorical variable grouped by quartiles. The significant interactions demonstrated that the relationships between cost and both DAS score and hospitalisation differed by independent living group. A greater number of days in hospital for psychiatric reasons over the previous 2 years was associated with increased total cost for all independent living groups, however, the effect was increasingly strong for those who had spent longer in independent living. A strong positive association between increasing social disability and cost was evident for those who had had no independent living. For those who had spent some months in independent living, however, no significant relationship between cost and social disability was evident.
Model adequacy
The adequacy of the multiple regression model for predicting cost can be assessed using the multiple correlation coefficient R 2. For the final model including inter-action terms (Table 3), 28% of the variance of total costs is accounted for by the explanatory variables in the model. An alternative representation to illustrate model adequacy for cost data is given in Fig. 2. This shows a plot of the percentage of the most expensive patients predicted by the model against the percentage of the total cost incurred by those patients. A bad predictive model is illustrated by a line close to the line of identity (y=x) and a more appropriate model is given by curves which become increasingly more convex and closer to the upper line shown in the figure.
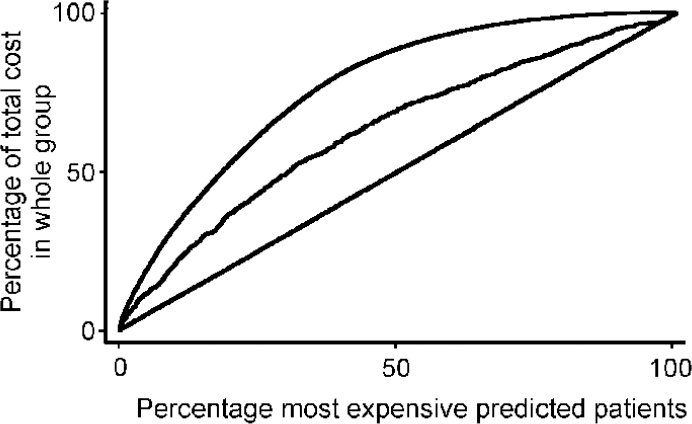
Fig. 2 Curve illustrating predictive ability of the final model. Top line: case where predicted values are the observed data; middle line: based on predictions from the final model; bottom line: line of identity (y=x).
DISCUSSION
Treatment
The type of intervention received, intensive or standard case management, was found to have no significant impact on the total 2-year costs of care. Psychiatric in-patient services and staffed accommodation together accounted for over 70% of the total direct costs of care in this service user group and intensive management was unsuccessful at reducing the use of these key resources (UK700 Group, 2000).
Demographic and socio-economic characteristics
Of the demographic characteristics included in the analysis, only age was found to be significantly related to total costs in multiple regression. The increased cost in younger age groups, also found in previous studies (Knapp et al, Reference Knapp, Beecham and Anderson1990, Reference Knapp, Beecham and Fenyo1995; Reference Chisholm, Knapp and AstinChisholm et al, 1997; Reference McCrone, Thornicroft and ParkmanMcCrone et al, 1998), is likely to be due to a number of factors. On the supply side, there is some evidence to suggest that health professionals, both primary and secondary, may concentrate efforts on the young and acute (Reference Hillerbrand and ShawHillerbrand & Shaw, 1989; Reference VerhaakVerhaak, 1993; Reference Harrison, Kisely and JonesHarrison et al, 1997), perhaps believing there to be greater scope for change or reflecting a perception of greater severity. In addition, geographical mobility, a variable found to be significantly and positively related to longer periods in hospital (Reference Lamont, Ukoumunne and TyrerLamont et al, 2000), is likely to be more prevalent in the younger age groups. On the demand side, young people may have parents who advocate for them and a greater faith in the ability of health professionals to ‘cure’ them, because of more limited experience of the health care system. With little research carried out in the UK into the demand for mental health care or the preferences of patients and their families, however, this hypothesis is tentative.
Of the socio-economic characteristics included, marital status and months in independent living over the previous 2 years were found to be independent predictors of total 2-year costs of care. The former relationship, although weak, is supported by Harrison et al (Reference Harrison, Kisely and Jones1997), who found an association between being married and slower access to psychiatric care, and McCrone et al (Reference McCrone, Thornicroft and Parkman1998), who found living alone to be predictive of higher costs. This finding reflects the fact that patients who live alone have increased dependency on statutory service providers as compared with patients living as married whose partners are likely to play a significant supportive and caring role (Reference Knapp, Beecham and FenyoKnapp et al, 1995). The higher costs associated with those who spent longer in dependent living accommodation prior to trial entry suggests that such service users remained a more dependent group after trial entry. Thus, past levels of dependency on supported accommodation appear to be predictive of future costs.
Diagnosis, severity of illness and need
Diagnosis was not found to be an independent predictor of total 2-year costs, in common with similar research findings (Reference Knapp, Beecham and FenyoKnapp et al, 1995). Although the majority of measures of severity of illness were found to have a statistically significant association with costs in univariate analyses, only duration of illness, days in hospital for psychiatric reasons and level of social disability were found to be independent predictors in multiple regression models. The impact of illness severity on cost is, therefore, weaker than would have been predicted and is perhaps being masked in multiple regression by variables that are having a stronger effect.
Duration of illness was positively associated with total 2-year costs of care. At the onset of an illness, it seems reasonable to assume that suppliers of health care will be inclined to begin treatment with less invasive and cheaper alternatives. As the illness progresses, however, and these treatments are found to be ineffective or to become less effective over time, more expensive alternatives may be substituted or added. In addition, new services may be added at a greater rate than they are discontinued. On the demand side, social support, found to be negatively related to service utilisation (Reference Faccincani, Mignolli and PlattFaccincani et al, 1990), may deteriorate as the duration of illness increases, resulting in a greater need for statutory input. In particular, informal carers, such as parents or partners, may initially be prepared to provide a great deal of care and support, but as time progresses they may be unable or unwilling to continue, as a result of emotional, physical and financial pressures, documented by McGilloway et al (Reference McGilloway, Donnelly and Mays1997). The relationships between total costs and age and duration of illness appear to go in counter-intuitive directions. In fact, these findings may reflect poorer prognoses for young people with early onset of illness. This group is more likely to be diagnosed as suffering from more chronic illnesses, such as schizophrenia (Lelliot et al, 1994; Reference Hafner and an der HeidenHafner & an der Heiden, 1997), and so their duration of illness will be relatively long and costs relatively high.
As with dependent living, the positive relationship found between total 2-year costs of care and days spent in hospital for psychiatric reasons in the 2 years prior to trial entry suggests that past levels of dependency on psychiatric services are predictive of future levels of dependency and therefore future costs, a finding supported by previous research (Reference Keane and FahyKeane & Fahy, 1982; Reference McCrone, Thornicroft and ParkmanMcCrone et al, 1998). Tests of interaction found this relationship to be stronger for patients who had spent longer in independent living in the 2 years prior to trial entry, reflecting the fact that additional hospital costs will be offset by reductions in the cost of supported accommodation for those who are more dependent in their living situation.
Analysis of the interaction between social disability and independent living revealed a significant association between costs and level of social disability for patients with no independent living in the 2 years prior to trial entry. The total costs of care were found to increase as social disability increased, in line with similar findings (Reference McCrone, Thornicroft and ParkmanMcCrone et al, 1998), reflecting the more dependent nature of this group of patients.
Although of less statistical significance, an association was found between total costs of care and level of unmet need at the point of entry into the trial. It is reasonable to assume that patients with a greater number of unmet needs will require a relatively greater intensity of support to meet these needs and will cost more than their counterparts. The results of this analysis support this assumption.
Explained variation
The multiple regression model explained just under 30% of the variation in total costs. Although low, this figure is similar to that found in previous research (Knapp et al, Reference Knapp, Beecham and Anderson1990, Reference Knapp, Beecham and Fenyo1995; Reference Chisholm, Knapp and AstinChisholm et al, 1997; Reference McCrone, Thornicroft and ParkmanMcCrone et al, 1998) and in part reflects the baseline nature of the study, since costs will obviously be influenced by post-baseline events as well (Reference Knapp, Beecham and AndersonKnapp et al, 1990; Reference McCrone, Thornicroft and ParkmanMcCrone et al, 1998). The advantage of including baseline characteristics alone, however, is the ability to determine causation in the relationships found. It is also possible that such consistently high proportions of unexplained variation are the result of a failure to measure certain variables that have a significant impact on the variation in costs. Variables that are often excluded from trials of this kind, which may be of some significance, include the availability of local services, the travelling times involved and budgetary constraints on service providers. Perhaps of more importance in this population is the patient's perception of the quality and usefulness of the available services and their perception of their own level of need. The examination of such relationships would require the inclusion of a broader range of quantitative variables and possibly a qualitative element in future analysis.
Clinical implications
In this population with severe psychotic illness, total costs of care were found to be more strongly influenced by levels of dependence and need than by measures of severity of illness. Over a quarter of the total costs of care were borne by the social services sector in the form of staffed accommodation, which naturally will be determined by dependence and need, rather than clinical diagnosis or severity of illness. By far the greatest burden, however, fell on the National Health Service, which contributed approximately 65% of the total costs of care. Service planners in the health service should be aware of the considerable cost implications of patients with a high degree of dependency on statutory services and the implications this may have for future resource allocation and the targeting of mental health services.
Clinical Implications and Limitations
CLINICAL IMPLICATIONS
-
▪ Characteristics that predict high costs in patients with severe psychotic illness include: being young, single, having a longer duration of illness and having been more dependent on supported accommodation and psychiatric in-patient care in the past.
-
▪ A number of clinical measures of severity of illness were significantly associated with cost in univariate analyses. In multiple regression, however, few were important as they were dominated by the stronger relationships described above.
-
▪ Service planners should be aware of the considerable cost implications of patients with a high degree of dependency on statutory services and the implications this may have for resource allocation.
LIMITATIONS
-
▪ In common with other studies, the multiple regression model explained only a small proportion of the variation in total costs, primarily reflecting the baseline nature of the analysis.
-
▪ It is possible that the study failed to identify and measure variables that have a significant impact on the variation in costs.
-
▪ These results apply to a broadly defined population with severe psychotic illness. Predictors of cost may vary between more specific patient subgroups.
ACKNOWLEDGEMENTS
The UK700 Group is a collaborative study team involving four clinical centres. Manchester Royal Infirmary: Tom Butler, Francis Creed, Janelle Fraser, Peter Huxley, Nick Tarrier and Theresa Tattan; King's Hospital/Maudsley Hospital, London: Tom Fahy, Catherine Gilvarry, Kwame McKenzie, Robin Murray, Jim van Os and Elizabeth Walsh; St Mary's Hospital/ St Charles Hospital, London: John Green, Anna Higgitt, Elizabeth van Horn, Catherine Manley, Patricia Thornton and Peter Tyrer; St George's Hospital, London: Robert Bale, Tom Burns, Matthew Finder, Kate Harvey, Andy Kent and Chiara Samele; Centre for Health Economics, York: Sarah Byford and David Torgerson; London (Statistics): Simon Thompson (Royal Postgraduate Medical School), Ian White (London School of Hygiene and Tropical Medicine), Julie Barber (MRC Clinical Trials Unit).


eLetters
No eLetters have been published for this article.