


Incidence studies providing age— and gender-specific incidence rates are still scarce. Furthermore, they yield a wide variation of incidence figures that might be attributed to methodological differences. It has been suggested that long follow-up intervals with high attrition owing to death and a lack of information on deceased individuals causes underestimation of incidence rates (Reference Bickel and CooperBickel & Cooper, 1994; Reference Aevarsson and SkoogAevarsson & Skoog, 1996; Reference Schröppel, Baumann and FichterSchröppel et al, 1996). The impact of different case definitions on incidence remains unclear (Reference Jorm and JolleyJorm & Jolley, 1998). This paper reports and compares incidence rates of dementia according to DSM-III-R (American Psychiatric Association, 1987) and ICD-10 (World Health Organization, 1992). To our knowledge, this is the first paper comparing incidence rates using different case definitions in one sample. Special reference is given to the oldest of the elderly because it remains unclear whether the exponential increase of incidence rates with age will continue.
METHOD
Sample
The prevalence wave of the Leipzig Longitudinal Study of the Aged (LEILA75+), a population-based study of individuals aged 75 years and older (n=1692, 1500 community-dwelling individuals and 192 institutional individuals), was conducted between January 1997 and June 1998. For details regarding sampling procedure we refer to Part 1 (Reference Riedel-Heller, Busse and AurichRiedel-Heller et al, 2001, this issue). Out of 1692 subjects of the original sample, 1265 individuals were interviewed face to face (74.8%) and 113 study participants were interviewed by proxy. Therefore, information on 1378 (81.4%) subjects was gathered during the baseline wave. These individuals were requested to take part in the follow-up study, which was conducted between July 1998 and December 1999, on average 1.6 years after baseline assessment. Figures 1 and 2 show sample size and attrition at the follow-up according to DSM-III-R and ICD-10, respectively.
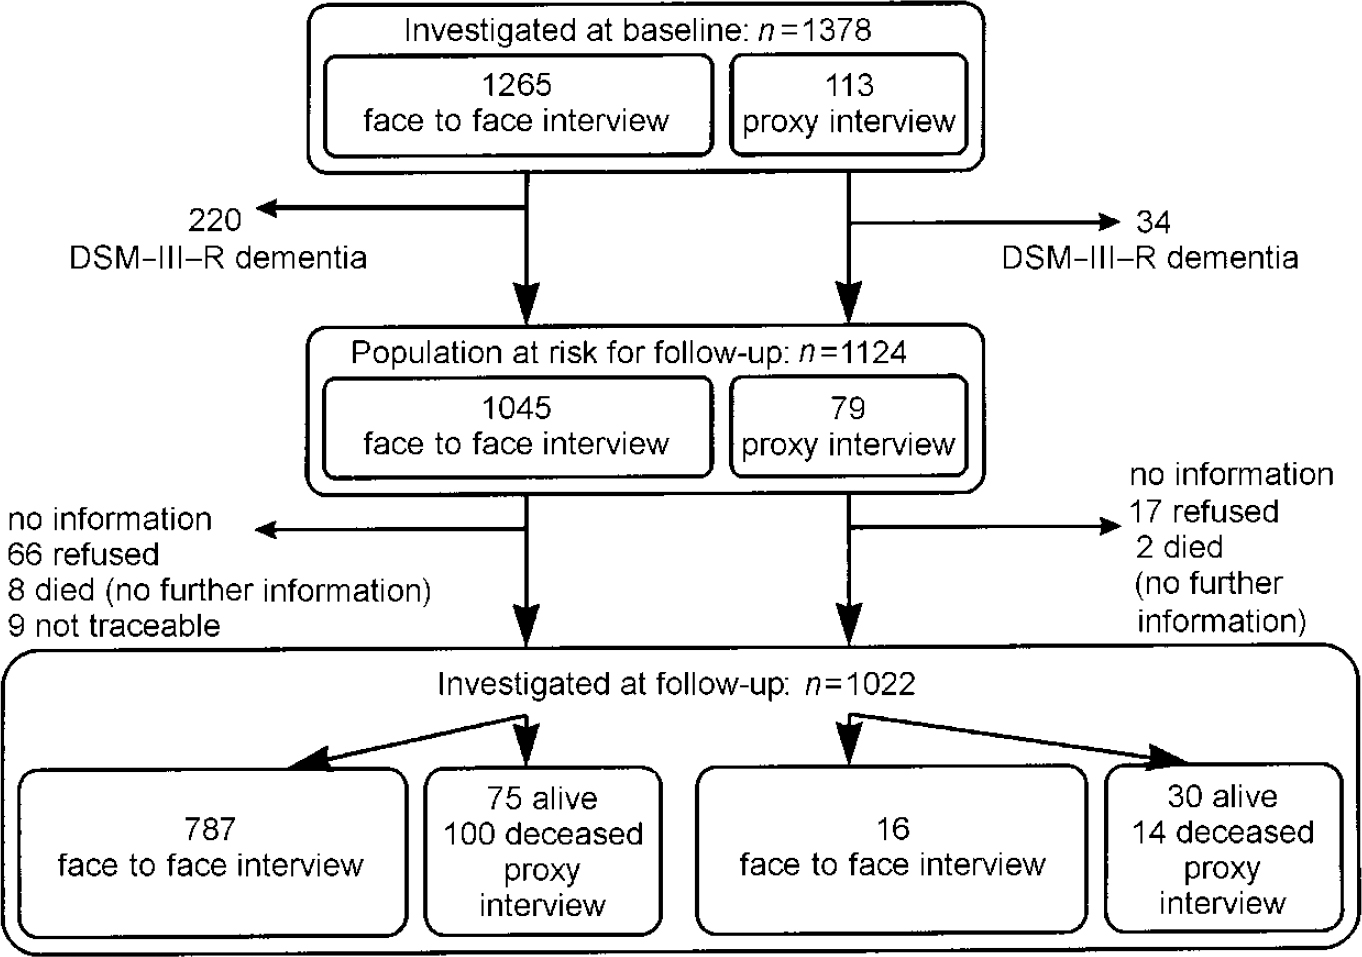
Fig. 1 Sample size and attrition according to DSM-III-R.
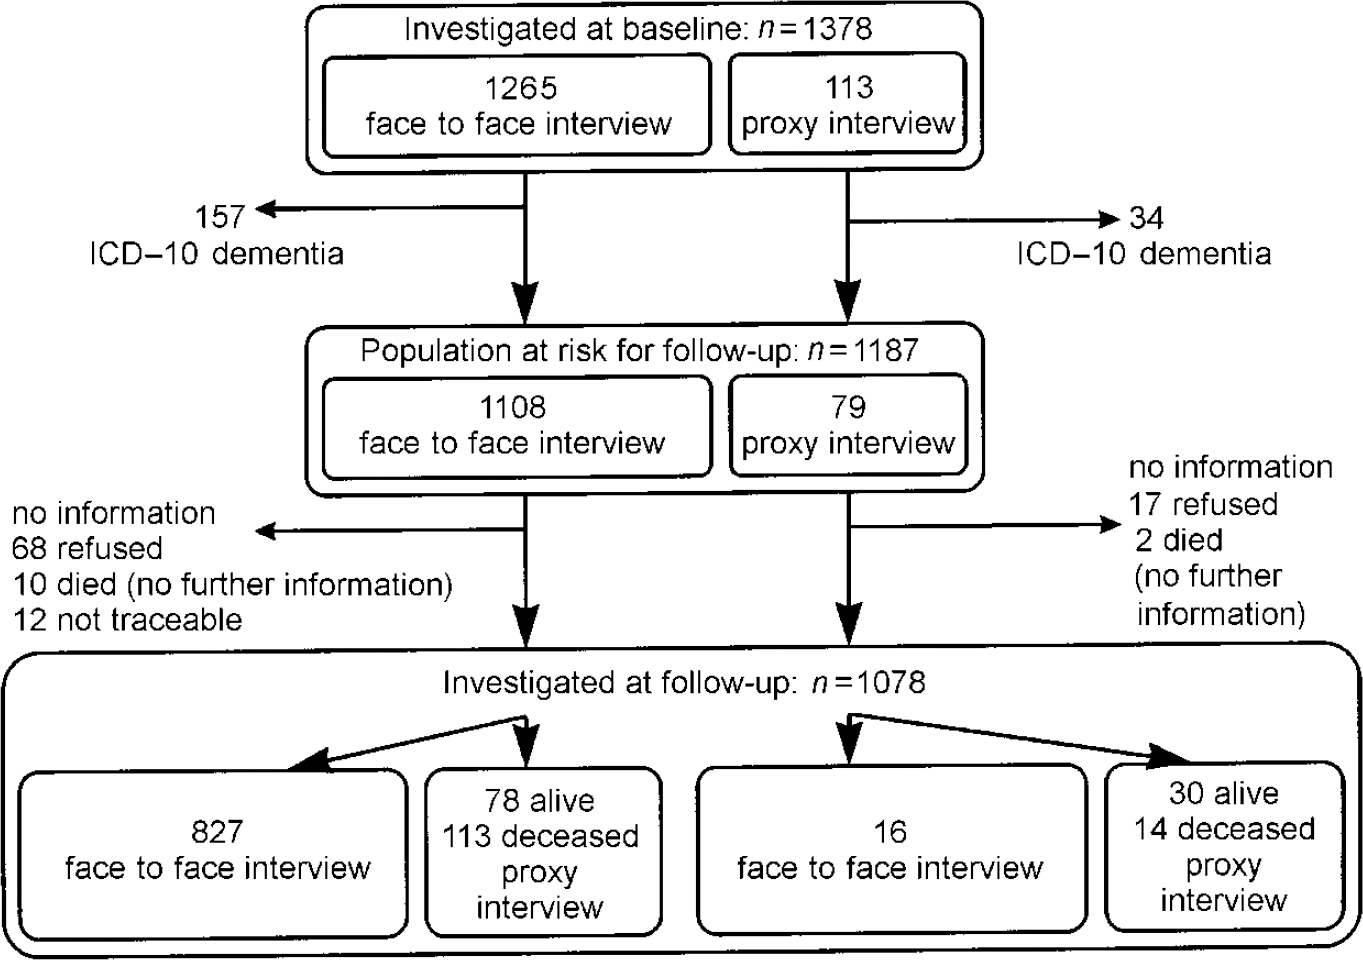
Fig. 2 Sample size and attrition according to ICD-10.
Instruments
The same assessment procedure as in the baseline assessment was used in the follow-up (see Part 1: Reference Riedel-Heller, Busse and AurichRiedel-Heller et al, 2001, this issue). A fully structured face to face interview was administered to the study subjects by trained female physicians and psychologists. The core component assessing the cognitive function was the Structured Interview for Diagnosis of Dementia of Alzheimer Type, Multiinfarct Dementia and Dementia of other Aetiology according to ICD-10 and DSM-III-R (SIDAM; Zaudig et al, Reference Zaudig, Mittelhammer and Hiller1991a ,Reference Zaudig, Mittelhammer and Hiller b ). The SIDAM comprises a test performance part (55 questions, including all items of the Mini-Mental State Examination, MMSE; Reference Folstein, Folstein and McHughFolstein et al, 1975), a section for clinical judgement and third-party information used to determine if psychosocial impairment is present. If an individual scored below 24 on the MMSE or reported impairment of the activities of daily living that was not caused by physical or sensory deficits, a comprehensive informant interview was conducted. The SIDAM diagnostic algorithms were available to derive ICD-10 and DSM-III-R diagnoses of dementia. Consensus conferences were held on each potential case to discuss the psychosocial impairment.
If relatives of study subjects definitely refused participation on behalf of the elderly person cared for, or the study participant died between baseline assessment and follow-up, we offered the option of a fully structured proxy interview. Instead of cognitive testing, the Clinical Dementia Rating Scale (CDR) was used for assessment of cognitive function (Reference Hughes, Berg and DanzigerHughes et al, 1982). Concerning terminal decline of cognitive function, assessment focus in deceased individuals was based on the individuals' cognitive status 3 months prior to death.
The results presented are based primarily on those individuals interviewed face to face. This decision was made because determination of mild dementia solely by proxy interview harbours problems and may differ according to closeness of relationship, education and stereotypes held by caregivers. Despite this limitation, combined incidence rates of those interviewed face to face and by proxy will be given and discussed.
Analysis
For analysis, the ‘person-years at risk’ method was used. Incidence rates were estimated as the number of new cases of dementia divided by the person-years at risk. The at-risk population were those without any diagnosis of dementia at baseline. Age bands were based on the age at prevalence wave. Person-years for those without dementia were calculated as the time between prevalence and follow-up examination or, in the case of death, the date of death. For individuals with dementia, the time of occurrence of the disease was assumed to be the midpoint between baseline and follow-up interview or date of death. Person-years then were calculated accordingly. Study subjects who refused the incidence wave or could not be traced were excluded. In order to analyse possible non-response bias, the t-test was applied.
RESULTS
Incidence of dementia according to DSM-III-R
Because 254 participants were identified as dementia cases according to DSM-III-R at baseline (regardless of whether interviewed face to face or by proxy), 1124 participants constitute the population at risk for followup.
A total of 787 (70%) subjects of the population at risk were examined face to face at baseline and follow-up; 59 of the 787 individuals (1244.32 person-years) developed dementia according to DSM-III-R. Thus the annual incidence rate for dementia for those individuals aged 75+ years is 47.4 (95% CI=36.1-61.2) per 1000 person-years. Age-specific incidence rates per 1000 person-years increase steeply with age: 15.8, 51.7, 105.3 and 165.7 for those aged 75-79, 80-84, 85-89 and 90+ years, respectively. Incidence rates do not differ significantly between men and women. Age— and gender-specific incidence rates are summarised in Table 1.
Table 1 Age— and gender-specific annual incidence rates according to DSM-III-R
| Age (years) | Women (n=585) | Men (n=202) | Total (n=787) | ||||||
|---|---|---|---|---|---|---|---|---|---|
| Dementia cases/person-years | Incidence per 1000 person-years | 95% Cl | Dementia cases/person-years at risk | Incidence per 1000 person-years | 95% Cl | Dementia cases/person-years at risk | Incidence per 1000 person-years | 95% Cl | |
| 75-79 | 6/456.59 | 13.1 | 4.8-28.6 | 4/176.66 | 22.6 | 6.2-58.0 | 10/633.25 | 15.8 | 7.6-29.0 |
| 80-84 | 14/259.19 | 54.0 | 29.5-90.6 | 4/88.69 | 45.1 | 12.3-115.5 | 18/347.88 | 51.7 | 30.7-81.8 |
| 85-90 | 17/168.64 | 100.8 | 58.7-161.4 | 5/40.25 | 124.2 | 40.3-289.9 | 22/208.90 | 105.3 | 66.0-159.5 |
| 90+ | 7/37.4 | 187.2 | 75.3-385.7 | 2/16.89 | 118.4 | 14.4-427.5 | 9/54.3 | 165.8 | 75.8-314.7 |
| 75+ | 44/921.82 | 47.7 | 34.7-64.1 | 15/322.49 | 46.5 | 26.0-76.7 | 59/1244.32 | 47.4 | 36.1-61.2 |
Using this combined strategy (subjects who died and information on cognitive status+individuals alive who were classified solely based on information by proxy+individuals interviewed face to face), 1022 individuals were examined (1519.78 person-years). These comprise 90.9% of the population at risk and 86 cases of dementia were identified. This approach yields an annual incidence rate of 56.6 per 1000 person-years (95% CI=45.3-69.9), which is higher than the rate covering solely individuals interviewed face to face at baseline and follow-up. Age-specific incidence per 1000 person-years revealed 16.3 (95% CI=8.4-28.5), 70.8 (95% CI=47.8-101.1), 110.3 (95% CI=74.9-156.6) and 163.4 (95% CI=87.0-279.3) in the age groups 75-79, 80-84 and 90+ years, respectively.
Incidence of dementia according to ICD-10
Of the 1378 subjects available for follow-up, 191 participants were identified as dementia cases according to ICD-10 at baseline. As a result, 1187 participants constitute the population at risk for follow-up.
A total of 827 (69.7%) participants of the population at risk were examined face to face at baseline and follow-up; 60 of the 827 individuals interviewed face to face (1309.75 person-years) developed dementia according to ICD-10. Thus, the incidence rate for individuals aged 75+ years per 1000 person-years is 45.8 (95% CI=35.0-59.0). Age-specific incidence rates are 15.6, 48.3, 90.8 and 174.6 per 1000 person-years for those aged 75-79, 80-84, 85-89 and 90+ years, respectively. Age— and gender-specific incidence rates are summarised in Table 2.
Table 2 Age— and gender-specific annual incidence rates according to ICD-10
| Age (years) | Women (n=618) | Men (n=209) | Total (n=827) | ||||||
|---|---|---|---|---|---|---|---|---|---|
| Dementia cases/person-years at risk | Incidence per 1000 person-years | 95% Cl | Dementia cases/person-years at risk | Incidence per 1000 person-years | Dementia cases/person-years at risk | Incidence per 1000 person-years | 95% Cl | ||
| 75-79 | 6/462.98 | 13.0 | 4.8-28.2 | 4/179.88 | 22.2 | 6.1-56.9 | 10/642.86 | 15.6 | 7.5-28.6 |
| 80-84 | 15/276.20 | 54.3 | 30.4-89.6 | 3/96.31 | 31.1 | 6.4-91.0 | 18/372.51 | 48.3 | 28.6-76.4 |
| 85-89 | 18/188.14 | 95.7 | 56.7-151.2 | 3/43.23 | 69.4 | 14.3-202.8 | 21/231.37 | 90.8 | 56.2-138.7 |
| 90+ | 9/46.12 | 195.2 | 89.2-370.5 | 2/16.89 | 118.4 | 14.4-427.5 | 11/63.01 | 174.6 | 87.2-312.4 |
| 75+ | 48/973.43 | 49.3 | 36.4-65.4 | 12/336.31 | 35.7 | 18.4-62.3 | 60/1309.75 | 45.8 | 35.0-59.0 |
Using the combined strategy, 102 dementia cases were found in 1078 individuals (=1593.42 person-years) examined. Information on 90.8% of the population at risk was gathered. This yields an annual incidence rate of 64.0 per 1000 person-years (95% CI=52.2-77.7), which is higher than the rate covering solely individuals interviewed face to face at baseline and follow-up. Age-specific incidence per 1000 person-years revealed 18.8 (95% CI=10.3-31.5), 73.3 (95% CI=50.5-102.9), 117.5 (95% CI=82.3-162.6) and 210.2 (95% CI=126.6-328.3) in the age groups 75-79, 80-84, 85-89 and 90+ years, respectively.
Figure 3 compares age-specific incidence rates of dementia according to DSM-III-R and ICD-10. Results indicate that dementia incidence increases steeply with age. No levelling off in the oldest of the elderly, at least up to age 90 years, is seen. Incidence rates according to DSM-III-R and ICD-10 appear to be quite similar and they do not differ significantly.
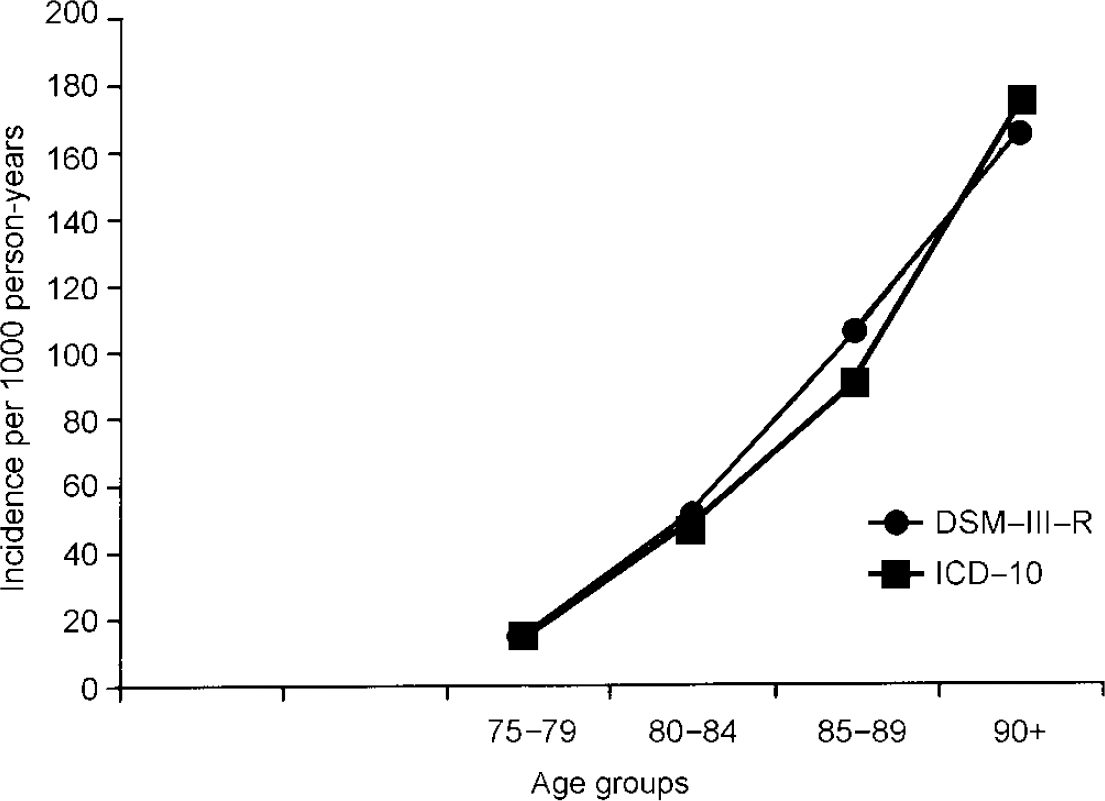
Fig. 3 Age-specific incidence rates of dementia according to DSM-III-R and ICD-10.
The MMSE and age at baseline were used to study possible non-response bias. Calculations were performed based on the population at risk according to DSM-III-R. First, individuals interviewed face to face are compared with the rest of the incidence sample or population at risk (individuals alive interviewed by proxy, deceased individuals, study subjects who refused or could not be traced). Individuals interviewed face to face at follow-up differ significantly from the rest of the incidence sample: they were younger (mean age=81.2 (s.d.=4.6) v. 82.9 (s.d.=5.3) years, t=5.4, P=0.000) and had a higher MMSE (mean MMSE=27.1 (s.d.=2.1) v. 26.1 (s.d.=3.2), t=5.7, P=0.000) at baseline. Second, responders (regardless of how they were interviewed) are compared with non-responders (subjects who refused participation, could not be traced or died without further information). The compared groups do not differ significantly regarding age (mean age=81.8 (s.d.=4.9) v. 81.7 (s.d.=4.9) years, t=0.2, P=0.822) or MMSE (mean MMSE=26.4 (s.d.=2.2) v. 26.9 (s.d.=2.5), t=1.7, P=0.084).
DISCUSSION
Comparison of ICD-10 and DSM-III-R incidence rates
To our knowledge this is the first paper directly comparing ICD-10 and DSM-III-R case definitions and their impact on the incidence rates of dementia. Both case definitions are used broadly in clinical settings. It has been shown that the impact of different case definitions on prevalence rates is substantial (Reference Erkinjuntti, Ostbye and SteenhuisErkinjuntti et al, 1997). However, very few prevalence studies applied ICD-10 and DSM-III-R criteria simultaneously (Reference Henderson, Jorm and MackinnonHenderson et al, 1994; Reference Fichter, Meller and SchröppelFichter et al, 1995; Reference Riedel-Heller, Busse and AurichRiedel-Heller et al, 2001, this issue). All reporting studies indicated lower prevalence rates according to ICD-10 compared with DSM-III-R. Interestingly, concerning incidence rates, our study revealed quite similar results according to ICD-10 and DSM-III-R. This deserves further explanation, which will be detailed considering incidence rates based on face to face interviews only (see also Fig. 4). Despite revealing rates of the same magnitude, persons identified as suffering dementia according to DSM-III-R and ICD-10 are not identical.
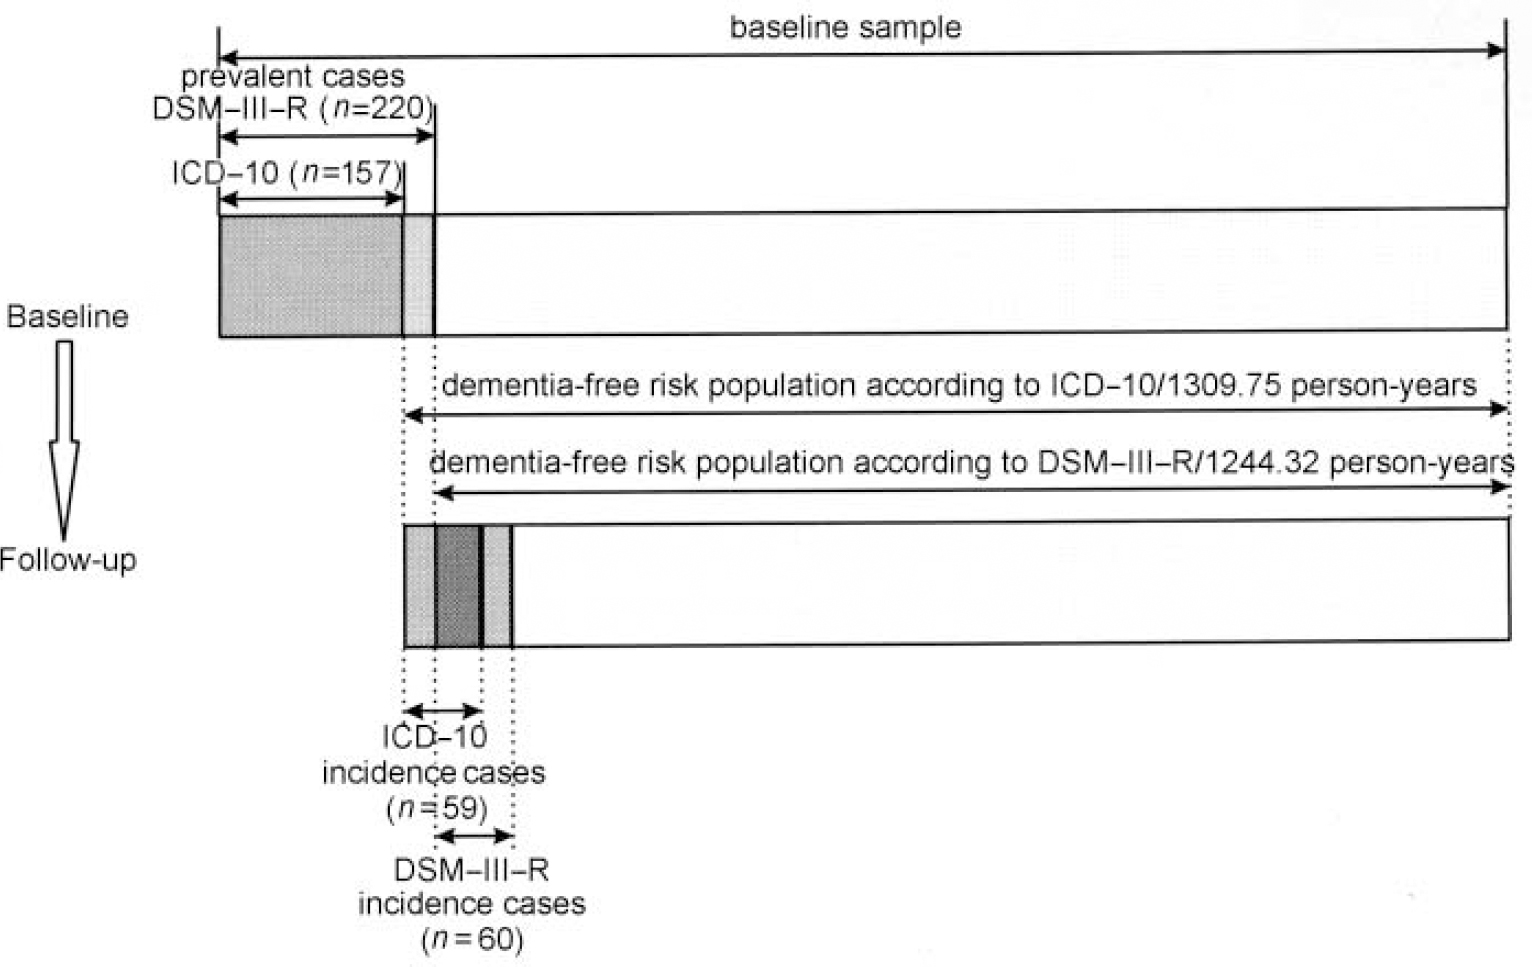
Fig. 4 Incidence cases according to DSM-III-R and ICD-10.
The 59 ICD-10 incidence cases comprise individuals who were diagnosed as having dementia according to both ICD-10 and DSM-III-R (n=38) and individuals having ICD-10 diagnosis only (n=21). The prevalence wave of LEILA75+ revealed that some individuals were judged to have mild dementia by DSM-III-R who were not considered using ICD-10 criteria. Although showing a considerable level of disturbance (enough to fulfil DSM-III-R criteria), these individuals entered the ICD-10 dementia-free risk population to be followed up. The latter finally were included in the follow-up, comprising 21 persons with solely ICD-10 diagnosis. The 60 DSM-III-R incidence cases comprise 38 individuals with both ICD-10 and DSM-III-R diagnosis and 22 individuals who were diagnosed solely by DSM-III-R. They were not caught by ICD-10 because these criteria set a higher threshold, especially requiring decline in emotional control or motivation or a change in social behaviour. Because the number of individuals solely diagnosed by ICD-10 and DSM-III-R are almost identical and the number of person-years for the ICD-10 and DSM-III-R risk population (1309.77 v. 1244.32) do not differ very much, similar incidence rates were found. The impact of different case definitions on incidence rates appears limited if case definition and case-finding procedures at baseline and follow-up are applied consistently.
Age-specific incidence rates
Regardless of which diagnostic classification system was used, age-specific incidence rates increase steeply with age. No levelling off in the oldest of the elderly was found. However, estimates, especially of those aged 90+ years, are available on relatively small numbers of cases, resulting in large confidence intervals. This notion is supported by the latest meta-analysis on incidence data (Reference Jorm and JolleyJorm & Jolley, 1998). Comparison with other studies reporting on the incidence of dementia according to DSM-III-R, including mild, moderate and severe forms, reveals the following results: for individuals aged 75-79 years our rates fall within the range of values suggested in all other recent studies investigating this age group (Reference Paykel, Brayne and HuppertPaykel et al, 1994; Reference Clarke, Morgan and LilleyClarke et al, 1996; Reference Fratiglioni, Viitanen and von StraussFratiglioni et al, 1997; Reference Ott, Breteler and van HarskampOtt et al, 1998; Reference Andersen, Nielsen and LolkAndersen et al, 1999). For the older age groups our rates exceed the rates of some of the recent field studies (Reference Paykel, Brayne and HuppertPaykel et al, 1994; Reference Clarke, Morgan and LilleyClarke et al, 1996; Reference Fratiglioni, Viitanen and von StraussFratiglioni et al, 1997; Reference Ott, Breteler and van HarskampOtt et al, 1998). However, they compare with the results reported by Andersen et al (Reference Andersen, Nielsen and Lolk1999), Aevarsson & Skoog (Reference Aevarsson and Skoog1996), Johansson & Zarit (Reference Johansson and Zarit1995), Fichter et al (Reference Fichter, Schröppel and Meller1996) and Copeland et al (Reference Copeland, McCracken and Dewey1999). Incidence rates mirror those predicted by a recent meta-analysis conducted by Jorm & Jolley (Reference Jorm and Jolley1998), which is shown in Fig. 5.
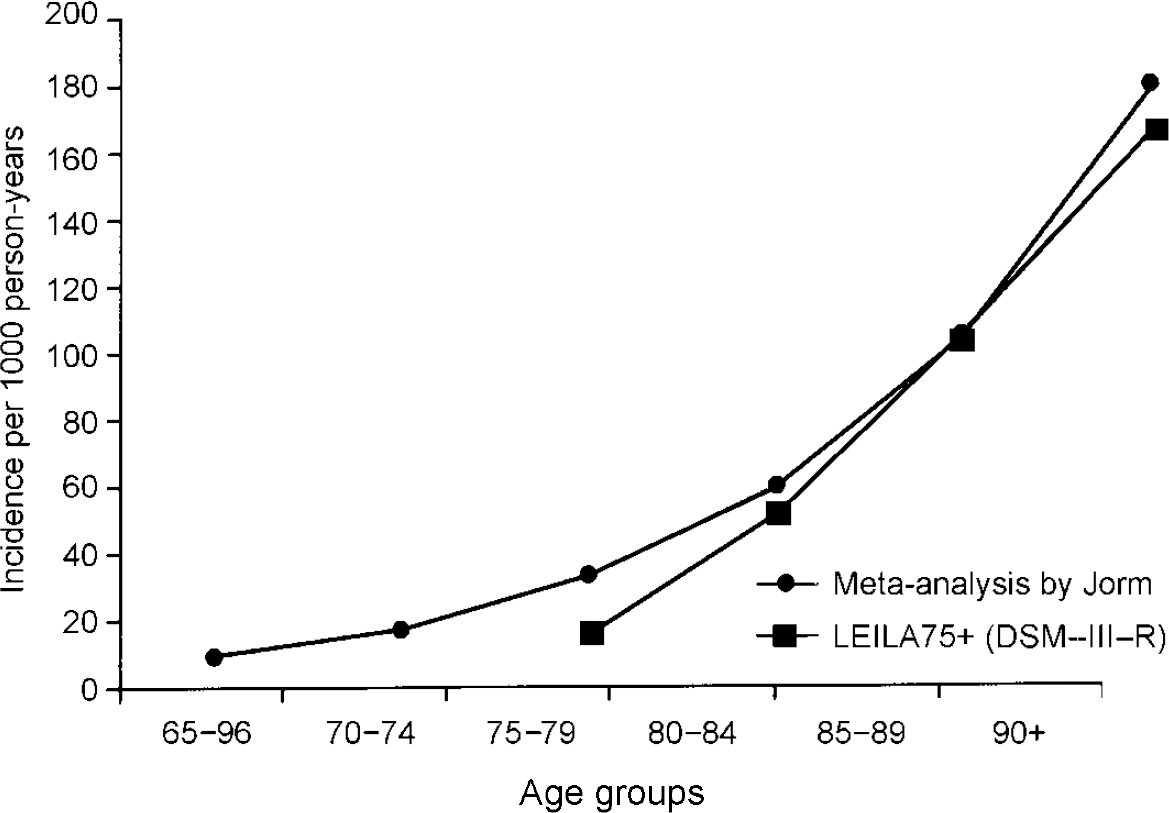
Fig. 5 Incidence of dementia: results of the Leipzig Longitudinal Study of the Aged (LEILA75+) and the metaanalysis conducted by Jorm & Jolley (Reference Jorm and Jolley1998).
Gender-related pattern
Schröppel et al (Reference Schröppel, Baumann and Fichter1996) reviewed gender-related patterns in incidence studies. They suggested an increased incidence of dementia for men up to the age of 70-80 years. In older age groups either the same incidence for women and men or an increased incidence for women was reported. In our study the short follow-up interval and high response rate may have avoided the selective death of males with incidence of dementia in the follow-up interim, which may have accounted for the apparently higher rates in women in other studies. Although incidence rates showed no statistically significant difference between men and women, our results mainly follow the pattern described by Schröppel et al (Reference Schröppel, Baumann and Fichter1996).
Potential bias owing to selective refusal or death
One of the major concerns of population-based longitudinal studies is the potential bias owing to selective refusal or death. This holds especially true in studies on dementia, because dementia is associated with an increased mortality (Reference Burns, Lewis, Jacoby and LevyBurns et al, 1991). According to the age span investigated and the length of the follow-up intervals, death rates in recent studies on dementia vary considerably, reaching up to half of the population at risk (Reference Gussekloo, Heeren and IzaksGussekloo et al, 1995). Response rates of the survivors do vary from 69% to 86% (Reference Boothby, Blizard and LivingstonBoothby et al, 1994; Reference Aevarsson and SkoogAevarsson & Skoog, 1996). Only a few studies assessed and included information on study subjects who died or refused to participate (Reference Bickel and CooperBickel & Cooper, 1994; Reference Aevarsson and SkoogAevarsson & Skoog, 1996; Reference Clarke, Morgan and LilleyClarke et al, 1996; Reference Fratiglioni, Viitanen and von StraussFratiglioni et al, 1997; Reference Ott, Breteler and van HarskampOtt et al, 1998). Hospital documents, general practitioner records or death certificates were used, despite their known unreliability regarding dementia diagnosis (Reference Teresi and HolmesTeresi & Holmes, 1997; Reference Losonczy, White and BrockLosonczy et al, 1998). In our study, for those individuals not available for face to face interviews, all effort was made to collect information through close relatives. Using this combined strategy, information from almost all deceased study subjects and a substantial number of the refusers (often fragile individuals shielded by their caring relatives in order to avoid stress related to the examination) was collected. This covered over 90% of the study subjects. Incidence rates for those individuals interviewed face to face and for the so-called combined strategy, including information on those who were deceased or refusers, were reported separately. As expected, incidence rates based solely on face to face interviews are lower than those calculated using the combined strategy. Incidence rates based on face to face interviews only are conservative estimates because it has been shown that drop-out was selective in favour of younger and cognitively less-impaired study participants. Given the short follow-up interval, selection occurred mainly owing to selective refusal (in only 6/114 deceased individuals dementia was diagnosed). Using the combined strategy, response bias is unlikely because there was no difference found regarding age and MMSE between responder and non-responder.
Clinical Implications and Limitations
CLINICAL IMPLICATIONS
-
• Because the eldest age groups are the fastest growing population segment, the results point to dementia as a growing public health problem.
-
• Gerontopsychiatric competence, especially at the primary care level, has to be developed to recognise the condition and to offer adequate medical and social support.
-
• Both ICD-10 and DSM-III-R produce similar incidence rates. However, not the same individuals were diagnosed. Discrepancies need to be resolved in future classification systems.
LIMITATIONS
-
• Although a substantial number of individuals were followed, estimates, especially of those aged 90+ years, are available on relatively few cases.
-
• Dementia diagnosis was determined under field study conditions.
-
• Determination of mild dementia by proxy interview harbours problems. It may differ according to the closeness of the relationship, education and stereotypes held by caregivers.


eLetters
No eLetters have been published for this article.