


Depression has an impact on the community greater than that of many chronic physical diseases. Any attempt to address the public health challenge posed by depressive disorders in Europe should be based on reliable epidemiological data which will enable us to better understand depression and assist us in allocating resources for intervention. The prevalence of depression appears to vary considerably across countries, and between urban and rural areas (see Table 1). This variety of reported outcomes could be attributable to differences in the measures used, and in the selection and sampling of rural and urban areas. In 1996, the European Commission funded the Outcome of Depression International Network (ODIN) study with two aims: (a) to provide comparable data on the prevalence and risk factors of depressive disorders in rural and urban settings within Europe, based on an epidemiological sampling frame and using similar methodology; and (b) to assess the impact of two psychological interventions on the outcome of depression. We provide comparative data on the prevalence of depressive disorders in rural and urban settings in five European countries, using a standardised two-phase epidemiological survey.
Table 1 Prevalence of depression in European epidemiological studies

| Country | Reference | Site | Instrument | Period | Age range | Gender prevalence (%) | |
|---|---|---|---|---|---|---|---|
| Male | Female | ||||||
| Greece | Reference Mavreas, Beis and MouyiasMavreas et al, 1986 | Athens 1984 | PSE | 1 month | All ages | 4.3 | 10.2 |
| Norway | Reference Sandanger, Nygard and IngebrigtsenSandanger et al, 1999 | Norway 1989-1991 | CIDI | 2 weeks | 20-39 | 0.7 | 3.1 |
| 40-59 | 0.5 | 4.4 | |||||
| 60-79 | 1.2 | 7.9 | |||||
| All ages | 0.7 | 4.3 | |||||
| Netherlands | Reference Bijl, Ravelli and van ZessenBijl et al, 1998 | Netherlands 1996 | CIDI | 1 month | 18-64 | 1.9 | 3.4 |
| Spain | Reference Vázquez-Barquero, Diez-Manrique and GaiteVázquez-Barquero et al, 1987 | Santander 1984 | PSE | 1 month | > 17 | 4.3 | 5.5 |
| UK | Reference Jenkins, Lewis and BebbingtonJenkins et al, 1997 | UK household survey | CIS-R | 1 week | 16-54 | 1.7 | 2.7 |
| 54-64 | 2.0 | 1.1 | |||||
METHOD
Selection of centres
Details of the study's methodology and organisation have been published elsewhere (Reference Dowrick, Casey and DalgardDowrick et al, 1998). The following criteria were used to identify suitable centres: expertise in mental health epidemiological research and/or research into strategies for the prevention of depression; access to urban and rural populations; and a geographical and cultural spread across Europe. On this basis, the project brought together five independent partners in as many countries, in Liverpool (UK), Dublin (Ireland), Oslo (Norway), Turku (Finland) and Santander (Spain). Each centre identified one rural and one urban setting in which to conduct its research. Owing to funding restrictions which arose after the study had been designed, it was not possible to carry out the epidemiological study in the Santander site's rural area. The urban areas divide into three large coastal cities (Dublin, Liverpool and Oslo) and two medium-sized ones (Santander and Turku). The rural areas were defined as having no centre of population greater than 15 000 people, with at least 20% of economically active citizens engaged in occupations directly related to agriculture, fishing or forestry. The British rural research site was in the Welsh Vale of Clwyd, and in Ireland it was the county of Laois. In Norway it was the district of Rakkestad, and in Finland the rural area encompassed the three municipalities of Marttila, Koskitl and Tarvasjoki.
Sampling
Target populations and sampling frames
Adults aged 18-64 years were the primary survey population. Community study samples were identified through census registers or lists of patients registered with primary care physicians. These sampling frames may be considered equally valid in terms of the reliability of the data sets (Reference Shanks, Kheraj and FishShanks et al, 1995). Census registers may be highly reliable at the time of collection, but suffer from attrition over time, and the quality of electoral registers in Britain has been vitiated by their use for local taxation purposes. Primary care registers, accessed conjointly across a locality, offer a slightly different but equally accurate representation of the population. In the present study, the different research teams involved made the choice to use one sampling procedure or the other — that is, either census records or lists of patients registered with primary care physicians — based on their previous experience in community surveys. Three centres (Oslo, Turku and Santander) had previously achieved high response rates through population register surveys, and therefore used this method for Phase 1 screening in the ODIN study. Patients in Britain and Ireland were identified through primary health care registers, a selection process similar to the one used in the EURODEP study that assessed the prevalence of depression among those aged ≥ 65 years at the Dublin and Liverpool centres (Reference Copeland, Beekman and DeweyCopeland et al, 1999). The Irish research team had to reduce the scope of its intended sampling and interviewing procedures owing to operational problems which arose during the study. At the rural site in Ireland, the registers of five general practitioners were involved, out of a total of 27; in Dublin, the registers of two general practitioners were involved, from a total of 390. At the British rural site, seven of the nine practices that covered the population area took part in the study; in Liverpool, 32 practices of the 106 that covered the population area participated.
In Oslo, Turku and Santander, the sample was randomly drawn from the population registers of the five sites (two in Norway and Finland, one in Spain) involved in the study. In Liverpool, a random set of patient names was obtained from health authorities, and interviewers contacted the practices with which the patients were listed. In northern Wales and Ireland, the procedure was to identify relevant practices, and obtain random sets of names from their patient lists. The entire sample was stratified by gender and age in all the centres.
Assessment methods
First phase
The first-phase assessment identified possible cases of depression using the Beck Depression Inventory (BDI) (Reference Beck, Ward and MendelsonBeck et al, 1961), with a threshold score above 12 (Nielsen & Williams, 1980; Reference Lasa, Ayuso-Mateos and Vázquez-BarqueroLasa et al, 2000). The BDI was combined with a questionnaire on social support (details available from the author upon request), the List of Threatening Experiences (Reference Brugha, Bebbington and TennantBrugha et al, 1985) and socio-demographic details. In Santander, the first phase was conducted by home-based personal interview. In all other centres, it was conducted using an initial postal survey, with postal, then telephone, then home-visit follow-ups. All refusals were accepted, and non-responders were contacted up to three times.
Second phase
All of those scoring at or above the BDI threshold and a random 5% of responders were offered detailed interviews with research workers trained in mental health, conducted in the participant's language. To date, most of the epidemiological studies on depression in the general population have used strict definitions of depression, according to DSM-III/IV (American Psychiatric Association, 1980, 1994) and ICD-10 (World Health Organization, 1992) criteria, focusing on the prevalence of depressive episodes or major depression. This may lead to a tendency to consider severe/major depression as the only affective disorder worthy of intervention. In order to overcome such a prejudice, in our study we extended the definition of depressive disorders to include dysthymia and adjustment disorders with depressive mood. The Schedule for Clinical Assessment in Neuropsychiatry (SCAN) Version 2.0 (World Health Organization, 1994) was used to generate diagnoses of depressive disorders on the basis of ICD-10 and DSM-IV categories. For ICD-10, these include single and recurrent depressive episodes (F32, F33), bipolar and persistent affective disorders (F31, F34) and adjustment disorders with a depressive component (F43.2). For DSM-IV, these include depressive, bipolar and adjustment disorders with a depressive component (codes 293.83, 296.xx, 300.4, 309.xx, 311, V62.82). Other instruments administered at this phase have been described elsewhere (Reference Dowrick, Casey and DalgardDowrick et al, 1998).
Training and quality control
The diagnostic interviewers were psychiatrists, general practitioners or psychologists. All interviewers received an initial weeklong training course at an approved SCAN training centre, and subsequently practised the full diagnostic interview schedule on at least 10 volunteers. Interrater reliability over time was monitored by means of assessment and feedback using a standardised videotaped consultation. A videotape including a full SCAN interview was used for this exercise, supplied by the WHO-approved SCAN training centre that trained ODIN's first-phase diagnostic interviewers. Each diagnostic interviewer was asked to rate and score the interview, then send their score sheets to a central analysis centre (Liverpool). Scores were compared with the ‘official’ set of ratings which accompanied the video. The videotaped interview contained 113 questions that could be rated, and all 13 of the interviewers were included in this exercise. A 100% agreement was reached for overall diagnosis (moderate depressive episode) and for diagnostic category (F32.1). There was 70% interrater agreement on scores for individual questions.
Statistical analysis
Routine data management and description of the results were carried out using SPSS 7.5 for Windows (SPSS Corporation, 1997). Prevalence estimates were carried out using STATA Release 6.0 (Stata Corporation, 1999) after allowing for both the two-phase sampling procedure and different response rates across sites through the use of weights (Reference Pickles, Dunn and Vázquez-BarqueroPickles et al, 1995; Reference Dunn, Pickles and TansellaDunn et al, 1999). Information arising from the Phase 1 screening results and the Phase 2 sampling mechanism was processed by assigning a ‘sampling weight’ to each individual participant, given by the inverse of the Phase 2 sampling fraction. The sampling weight is an indicator of how many participants in Phase 1 are ‘represented by’ each of the Phase 2 records. We used adjustment weights in order to standardise the overall prevalence estimates at each centre for the age and gender distribution of the population of Santander, which served as our reference. Prevalence estimates were obtained via a logistic model, producing a symmetrical confidence interval for the regression coefficient, and then reversing the logistic transformation to produce the corresponding interval for the prevalence itself. Prevalence estimates were calculated separately for each of the study sites. We also carried out a meta-analysis of the pooled data from the nine centres to obtain an overall weighted prevalence.
RESULTS
Sample compositions
Table 2 shows the demographic characteristics across centres. The different study samples' age—gender compositions were compared with those of the census populations at each of the nine study sites. There were no significant differences between the samples and the populations in terms of gender at any site nor, in rural Ireland, Norway, Finland and Santander, in terms of age profiles. At the two British sites and in Dublin, the samples had significantly lower proportions of younger participants than the census populations.
Table 2 Demographic characteristics of the study sample in participating centres

| UK | UK | Ireland | Ireland | Norway | Norway | Finland | Finland | Spain | Global | |
|---|---|---|---|---|---|---|---|---|---|---|
| urban | rural | urban | rural | urban | rural | urban | rural | urban | sample | |
| Target population | 307 900 | 24 814 | 299 554 | 28 157 | 308 071 | 4062 | 108 919 | 7738 | 124 261 | 1 211 596 |
| Initial sample | 1834 | 2000 | 461 | 500 | 2444 | 2464 | 1500 | 1499 | 1685 | 14 387 |
| Exclusions1 | 169 | 44 | 79 | 33 | 159 | 25 | 49 | 35 | 290 | 883 |
| First phase responders (n) | 901 | 1239 | 222 | 250 | 1456 | 1594 | 969 | 981 | 1250 | 8862 |
| First phase response rate (%) | 54 | 63 | 58.1 | 54 | 64 | 65 | 66 | 68 | 90 | 65 |
| Female (%) | 54.5 | 53.6 | 50.4 | 55.2 | 53.9 | 51.8 | 57.5 | 51.6 | 50 | 53.13 |
| Age (%) | ||||||||||
| 18-25 years | 10.6 | 9.2 | 11.2 | 17.6 | 11.1 | 16.4 | 18.2 | 11.1 | 20.4 | 14.0 |
| 26-45 years | 48.3 | 43.7 | 56.3 | 52.0 | 56.6 | 46.3 | 43.1 | 43.0 | 42.9 | 47.10 |
| 46-65 years | 40.9 | 47.0 | 32.4 | 30.4 | 32.2 | 37.2 | 38.6 | 45.8 | 36.6 | 38.86 |
| Second phase response rate (%) | 67 | 60 | 55 | 68 | 70 | 80 | 86 | 92 | 83 | 73 |
Response rates
Table 2 describes the response rate and exclusions owing to errors in census registers or lists of patients registered with primary care physicians. The overall response rate for the first phase of the survey was 65%, which included variations by study site, ranging from 54% (rural Ireland) to 90% (urban Spain). The overall response rate for the Phase 2 survey was 73%, with a variation from 55% (rural Ireland) to 92% (rural Finland). Non-responders were more likely to be male, young and socio-economically disadvantaged. For the screening phase of the survey, gender differences in non-response rate were significant at P < 0.05 in rural Britain, Ireland and Norway. Response rates increased with age.
Prevalence estimates
Figure 1 gives the weighted prevalence of depressive disorders (ICD-10 and/or DSM-IV criteria) for survey responders on each site, together with the 95% CIs. An analysis of the combined sample (n=8.764) gave an overall prevalence of 8.56% (95% CI 7.05-10.37). The figures were 10.05% (95% CI 7.80-12.85) for women and 6.61% (95% CI 4.92-8.83) for men. Rates in Liverpool were more than six times higher, and in Oslo over three times higher, than those in Santander. There was relatively little variation among the four rural areas, with weighted prevalence ranging from 6.1% in Wales to 9.3% in rural Norway. In Britain and Ireland urban rates were two to three times higher than in their rural communities, but in Norway and Finland there was little difference between the urban and rural figures. Figures 2 and 3 show that, at seven study sites, women present higher proportions of depressive disorders than men, although 95% CIs overlap at all the centres. A higher prevalence of depressive disorders in the female population was found in the five urban settings. Gender differences in prevalence were not so evident in the rural settings.
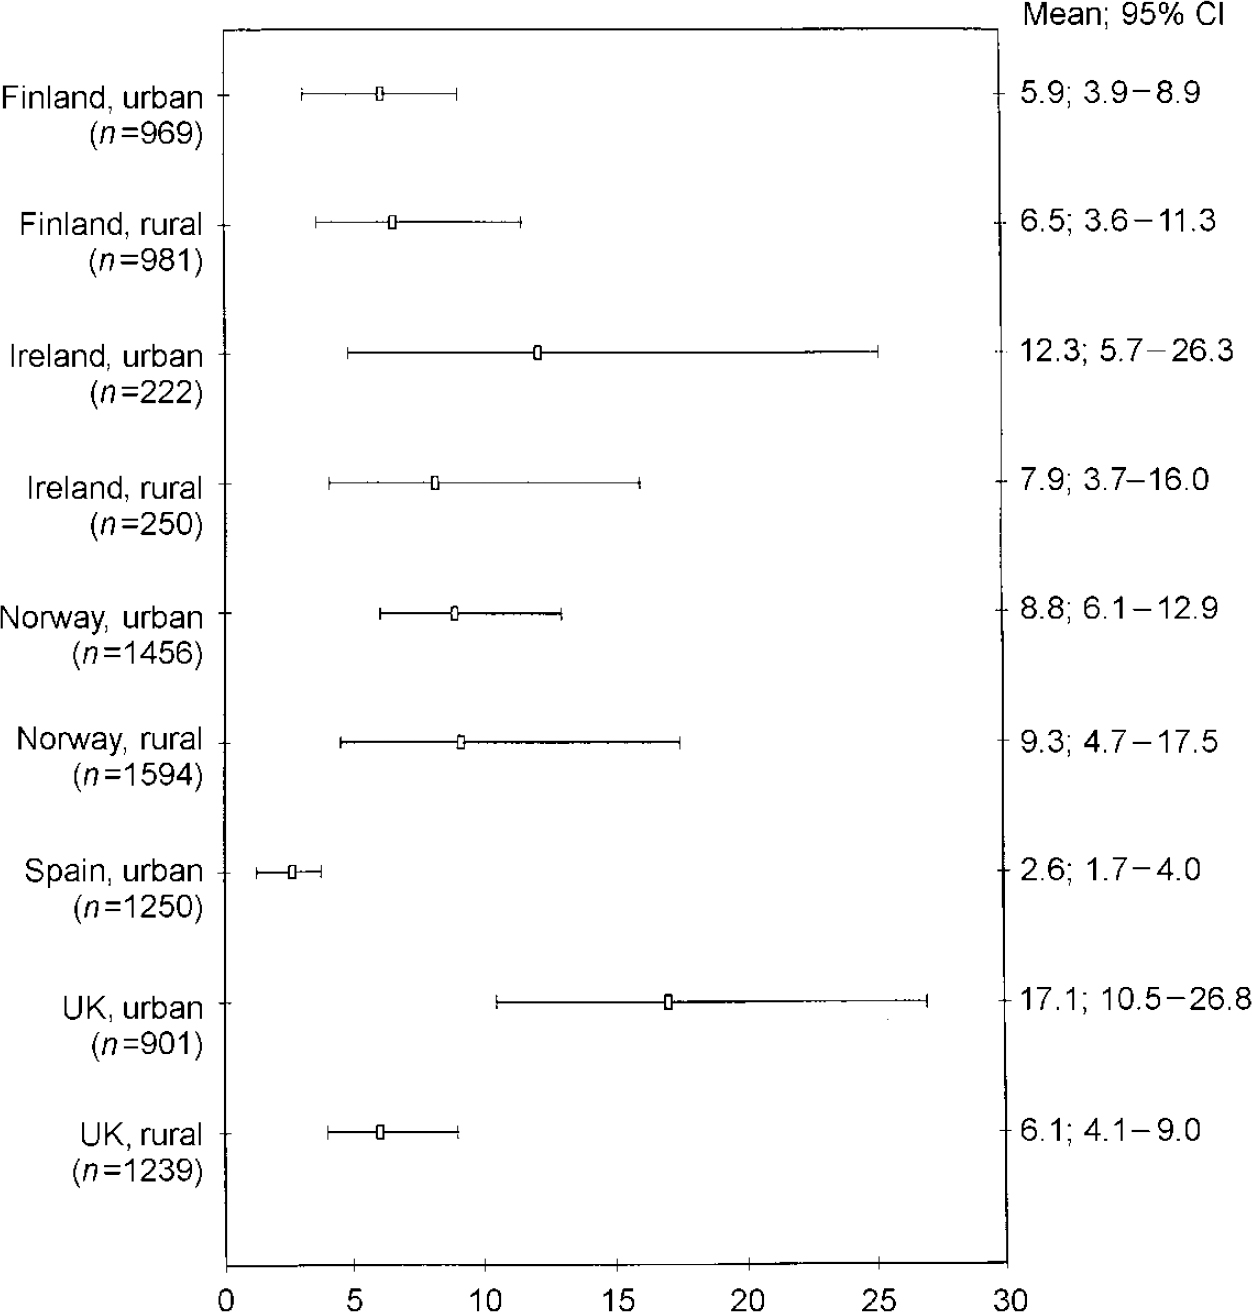
Fig. 1 ODIN prevalence of depressive disorders in participating centres: diagnostic cases for men and women (95% CIs)
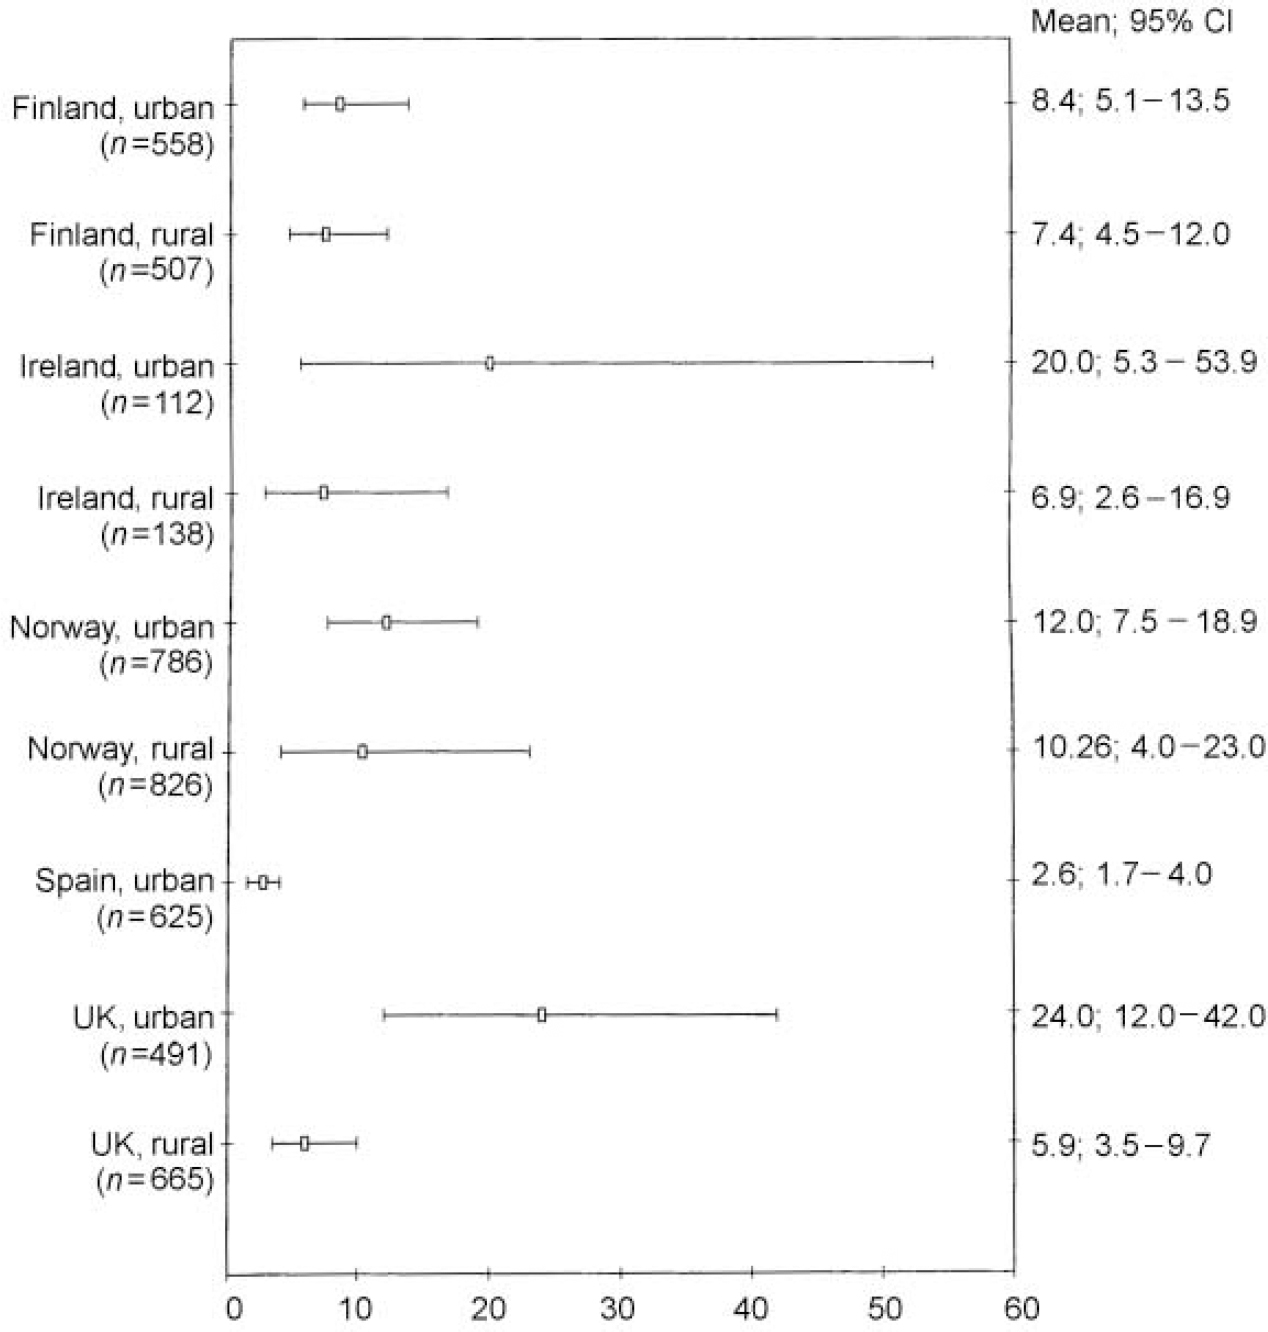
Fig. 2 ODIN prevalence of depressive disorders in participating centres: diagnostic cases for women (95% CIs).
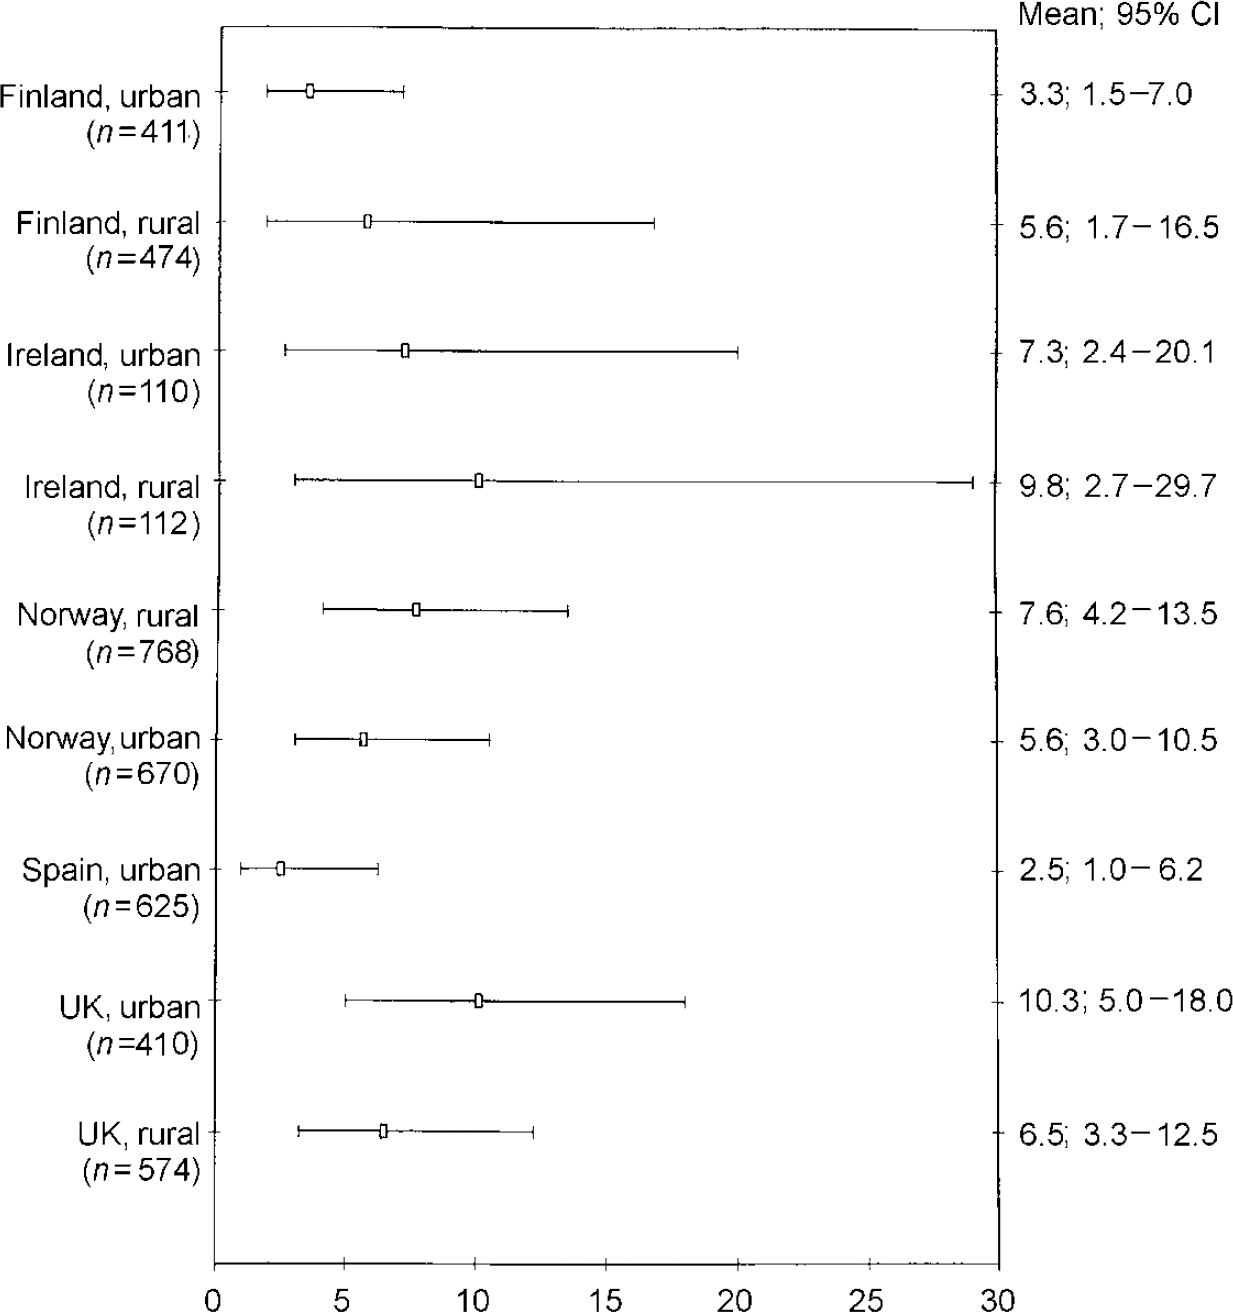
Fig. 3 ODIN prevalence of depressive disorders in participating centres: diagnostic cases for men (95% Cls).
Subtypes of depressive disorders
Table 3 shows the weighted prevalence of the different diagnostic categories according to the ICD-10 classification included under the depressive disorder umbrella diagnosis used in the ODIN study. In the global sample, the weighted prevalence of depressive episodes (F31-F33.3) was more than six times higher than the weighted prevalence of dysthymia and adjustment disorder. This pattern was also found at each of the nine study sites, and in both genders. Table 4 shows the weighted prevalence of the different categories according to the DSM-IV classification. When DSM-IV and ICD-10 criteria were compared, there were notable similarities in the overall prevalence figures for all diagnostic categories. However, in Liverpool and Dublin and at the rural UK site, to a lesser extent, there is a discordance between ICD-10 and DSM-IV diagnoses.
Table 3 Weighted prevalence of depressive disorders' diagnostic groups in participating centres (ICD-10 criteria)1

| Depressive episode | Dysthymia | Adjustment disorder | ||||
|---|---|---|---|---|---|---|
| Mean | (95% CI) | Mean | (95% CI) | Mean | (95% CI) | |
| Finland, urban | ||||||
| Total | 4.7 | (3.0-7.3) | 0.3 | (0.1-1.1) | 0.8 | (0.3-1.8) |
| Female | 6.6 | (3.9-11.0) | 0.4 | (0.1-1.6) | 1.3 | (0.5-3.3) |
| Male | 2.7 | (1.2-6.1) | 0.3 | (0.04-2.3) | 0.2 | (0.03-1.9) |
| Finland, rural | ||||||
| Total | 4.1 | (1.7-9.1) | 1.3 | (0.7-2.4) | 1.0 | (0.5-2.1) |
| Female | 3.8 | (2.1-6.8) | 1.5 | (0.7-3.4) | 1.9 | (0.8-4.3) |
| Male | 4.3 | (1.0-16.9) | 1.1 | (0.4-2.8) | 0.1 | (0.02-1.2) |
| Ireland, urban | ||||||
| Total | 8.9 | (3.8-19.4) | 2.9 | (0.9-8.6) | 0.4 | (0.05-3.5) |
| Female | 15.2 | (3.9-43.9) | 3.9 | (0.7-17.7) | ||
| Male | 4.3 | (1.2-13.9) | 2.1 | (0.3-10.9) | 0.7 | (0.08-6.5) |
| Ireland, rural | ||||||
| Total | 6.2 | (2.8-13.2) | 0.5 | (0.07-4.4) | - | - |
| Female | 5.9 | (2.6-16.8) | - | - | - | - |
| Male | 8.1 | (2.1-26.1) | 1.7 | (0.1-14.2) | - | - |
| Norway, urban | ||||||
| Total | 7.0 | (4.6-10.4) | 1.5 | (0.8-2.9) | 0.2 | (0.03-1.9) |
| Female | 9.4 | (5.6-15.2) | 2.6 | (1.3-5.3) | - | - |
| Male | 4.6 | (2.3-8.8) | 0.4 | (0.1-2.1) | 0.5 | (0.07-3.9) |
| Norway, rural | ||||||
| Total | 8.4 | (4.0-16.8) | 0.9 | (0.4-1.9) | - | - |
| Female | 10.0 | (3.8-23.8) | 0.4 | (0.1-1.5) | - | - |
| Male | 5.8 | (3.0-10.6) | 1.8 | (0.7-4.6) | - | - |
| Spain, urban | ||||||
| Total | 1.8 | (1.1-3.0) | 0.5 | (0.2-1.2) | 0.2 | (0.09-0.9) |
| Female | 1.8 | (1.0-3.1) | 0.7 | (0.3-1.7) | 0.2 | (0.05-0.9) |
| Male | 2.0 | (0.7-5.3) | - | - | 0.4 | (0-3.5) |
| UK, urban | ||||||
| Total | 15.01 | (8.81-24.42) | 0.2 | (0.06-1.1) | - | - |
| Female | 21.15 | (10.10-39.02) | 0.5 | (0.1-2.4) | - | - |
| Male | 9.41 | (4.98-17.07) | - | - | - | - |
| UK, rural | ||||||
| Total | 4.8 | (3.1-7.3) | 0.3 | (0.1-1.1) | - | - |
| Female | 4.7 | (0.2-7.9) | 0.5 | (0.1-1.7) | - | - |
| Male | 5.0 | (2.4-10.0) | - | - | - | - |
| Global sample | ||||||
| Total | 6.6 | (5.4-8.4) | 1.0 | (0.6-1.4) | 0.3 | (0.1-0.5) |
| Female | 7.9 | (5.9-10.5) | 1.0 | (0.7-1.6) | 0.3 | (0.2-0.6) |
| Male | 5.2 | (3.7-7.1) | 0.8 | (0.4-1.7) | 0.2 | (0.09-0.7) |
Table 4 Weighted prevalence of depressive disorders' diagnostic groups in participating centres (DSM-IV criteria)1

| Major depressive episode | Dysthymia | Adjustment disorder | ||||
|---|---|---|---|---|---|---|
| Mean | (95% Cl) | Mean | (95% Cl) | Mean | (95% Cl) | |
| Finland, urban | ||||||
| Total | 4.7 | (3.1-7.3) | 0.3 | (0.1-1.1) | 0.8 | (0.3-1.8) |
| Female | 6.6 | (4.0-10.9) | 0.4 | (0.09-1.6) | 1.3 | (0.5-3.3) |
| Male | 2.7 | (1.2-6.0) | 0.3 | (0.04-2.3) | 0.2 | (0.03-1.9) |
| Finland, rural | ||||||
| Total | 4.1 | (1.8-9.1) | 1.3 | (0.7-2.4) | 1.0 | (0.5-2.1) |
| Female | 3.8 | (2.1-6.8) | 1.5 | (0.7-3.4) | 1.9 | (0.8-4.3) |
| Male | 4.3 | (1.0-16.9) | 1.1 | (0.4-2.8) | 0.1 | (0.02-1.2) |
| Ireland, urban | ||||||
| Total | 15.1 | (9.1-24.5) | 0.6 | (0.1-2.3) | 0.3 | (0.07-1.3) |
| Female | 21.3 | (10.3-39.2) | 1.3 | (0.3-4.9) | 0.3 | (0.05-2.8) |
| Male | 9.5 | (5.1-17.1) | - | - | 0.2 | (0.03-1.9) |
| Ireland, rural | ||||||
| Total | 5.5 | (3.7-8.4) | 0.3 | (0.1-1.1) | - | - |
| Female | 5.1 | (3.1-8.4) | 0.5 | (0.1-1.7) | - | - |
| Male | 6.5 | (3.3-12.5) | - | - | - | - |
| Norway, urban | ||||||
| Total | 7.0 | (4.7-10.2) | 1.5 | (0.8-2.9) | 0.2 | (0.03-1.9) |
| Female | 9.4 | (5.6-15.3) | 2.6 | (1.3-5.2) | - | - |
| Male | 4.6 | (2.4-8.9) | 0.4 | (0.1-2.1) | 0.5 | (0.07-3.9) |
| Norway, rural | ||||||
| Total | 8.48 | (4.17-16.7) | 0.9 | (0.4-1.9) | - | - |
| Female | 10.0 | (3.8-23.6) | 0.4 | (0.1-1.5) | - | - |
| Male | 5.81 | (3.1-10.5) | 1.8 | (0.7-4.6) | - | - |
| Spain, urban | ||||||
| Total | 1.8 | (1.1-3.0) | 0.5 | (0.2-1.2) | 0.2 | (0.1-0.5) |
| Female | 1.8 | (1.9-3.1) | 0.7 | (0.3-1.6) | 2.3 | (0.05-0.9) |
| Male | 2.0 | (0.8-5.3) | - | - | 0.4 | (0.06-3.5) |
| UK, urban | ||||||
| Total | 7.8 | (3.3-17.5) | 2.3 | (0.7-7.5) | 1.1 | (0.2-5.15) |
| Female | 14.9 | (3.9-43.5) | 2.6 | (0.4-14.4) | 1.5 | (0.1-13.8) |
| Male | 2.7 | (0.6-10.6) | 2.16 | (0.4-10.9) | 0.7 | (0.08-6.5) |
| UK, rural | ||||||
| Total | 6.1 | (2.8-13.0) | 1.1 | (0.2-5.0) | 0.6 | (0.08-4.9) |
| Female | 5.9 | (2.2-14.9) | - | - | 1.0 | (0.1-7.7) |
| Male | 6.5 | (1.6-22.6) | 3.3 | (0.6-16.3) | - | - |
| Global sample | ||||||
| Total | 6.7 | (5.4-8.2) | 1.0 | (0.7-1.4) | 0.5 | (0.3-0.8) |
| Female | 8.0 | (6.1-10.5) | 1.0 | (0.7-1.6) | 0.6 | (0.3-1.2) |
| Male | 4.9 | (3.6-6.8) | 1.0 | (0.5-1.9) | 0.3 | (0.1-0.8) |
DISCUSSION
Limitations of the study
The apparent wide variation in prevalence of depressive disorders among the nine centres needs careful assessment. First of all, the low response rate obtained at some of the centres, that is, the UK and Ireland, may have resulted in prevalence figures of questionable reliability which are not representative of the target population at these sites. The reliability of the data derived from community-based epidemiological studies depends on at least two methodological elements: (a) application of a reliable strategy of psychopathological assessment; and (b) the selection and assessment of a population sample representative of the general population. In our study, we believe that the first condition has been met, with the use of two psychopathological assessment instruments (that is, the BDI and the SCAN) that have proven high rates of validity and reliability (Reference Lasa, Ayuso-Mateos and Vázquez-BarqueroLasa et al, 2000), and which, as discussed above, resulted in high rates of interrater reliability, owing to the use of appropriate training and quality-control strategies for the psychopathological examinations conducted. Regarding the other conditioning element, its reliability rests, first, on the elaboration of an initial sample that is representative of the community to be studied, for which the adequate representation of all significant population groups must be guaranteed in the sample initially chosen; and second, whether non-responders who appear in the different phases of the project (whether owing to refusal to participate or to technical difficulties) do not introduce significant biases that are impossible to correct.
Critical analysis of the data from our study, in which very significant morbidity differences can be seen between some centres, as well as excessively wide confidence intervals, suggests that in some of the participating centres, bias could have been introduced in some of these elements of the sample designing process. Thus, with regard to the element of guaranteeing the design of an initially representative sample, the differing age profiles of the surveyed samples and census populations in Britain and Dublin may reflect a discrepancy between samples drawn from census and primary care sources. Younger people may be less likely to be registered with a general practitioner, may be less motivated to take part in a study and may be more mobile and have a less structured lifestyle — both obstacles to participation in a community study like the one presented here. There is evidence of systematic differences between survey responders and the populations from which they were drawn. Responders were more likely to be female, and older, than non-responders. Both of these factors may have introduced a bias towards higher prevalence rates among responders than among the survey populations. This trend may have been compounded at the British sites and in Dublin, where the primary care groups were older than their corresponding census populations. In addition, one of the nine study sites (Dublin) used a sample covering only part of the city, so it is possible that subgroups of the urban population characterised by the presence of negative psychosocial characteristics were over-represented. Some of the differences between centres may relate more to the socio-economic indices of the area sampled than to the city as a whole.
Regarding possible bias derived from non-responders, in our study there were highly significant differences in the response rates. The response rates for Phase 1 of the community survey were more than 20% higher in Santander than elsewhere. It is probable that this difference reflected the decision of the Spanish team to use an initial home interview, rather than the initial postal approach employed at the other centres. This hypothesis is supported by the fact that there was no such discrepancy in response rates between Santander and the other centres for the later phases of the survey, when similar methods were used across all centres. During the later phases, the Finnish sites tended to have the highest response rates. This may have been due to the efficiency and persistence of the research team, or to the relatively higher acceptability of such studies in general within the survey sample. This problem is more evident in urban areas than in rural ones, and within the former, precisely in large cities with areas suffering from social disintegration (Dublin and Liverpool) in which the sample selection process is more complicated and difficult than in middle-sized cities.
Multinational, multi-centric epidemiological studies often run into problems due to differing sampling frames and refusal rate levels (Reference Copeland, Beekman and DeweyCopeland et al, 1999). In such studies, each centre must, necessarily, adapt the common research methodology in order to meet local administrative and ethical norms. Among other factors involved in such adaptation are different social attitudes towards collaborating in epidemiological studies, the quality of population registers, budgetary constraints, and the experience and ability of the local research team. The impact of these problems can partially be minimised in the morbidity analysis by applying appropriate statistical strategies. We have weighted our results to take different response rates into account; in addition, we used adjustment weights in order to standardise the overall prevalence estimates at each centre for the age and gender distribution of Santander's population, which served as our standard of reference. Nevertheless, these features of the survey impose some limitation on the generalisability of the findings at some of the study sites.
Other methodological considerations should also be considered in trying to explain the differences that we encountered, and the wide confidence intervals at some centres. The methodological decision to offer diagnostic interviews to only a 5% sample of participants below BDI cut-off led to considerably higher standard errors (and hence wider confidence intervals) than would have been the case if a larger proportion of ‘BDI-negative’ participants had been included in the second phase of the community survey.
Prevalence estimates
The methodology used in this project, two-phase sampling, is a type of stratified design that has been proposed in psychiatric research as an efficient way of estimating prevalence of psychopathology in large epidemiological surveys. The diagnostic instrument used in the second phase of the study is the latest version of the SCAN, which has been presented by some authors (Reference Brugha, Bebbington and JenkinsBrugha et al, 1999) as closely approximating a ‘clinical gold standard’.
The major finding of the present study is the wide difference in the prevalence of depressive disorders found across the study sites and between urban and rural centres. Taking the genders together, the centres fall into three categories: high prevalence (urban Ireland and urban UK: 12.8-17.1% respectively), low prevalence (urban Spain: 2.6%) and medium prevalence (the rest of the sites: 6-9.3%). The study found high proportions of depression among survey responders in some centres, particularly among the female population in urban areas. At seven of the nine study sites, the prevalence of depressive disorders was higher among women than among men, confirming the results of several previous studies (Reference Bebbington, Sturt and TenantBebbington et al, 1984; Reference Weissman, Bland and CaninoWeissman et al, 1996). Over the past few decades, there has been growing evidence of significant intergender differences in the rates of specific mental disorders (Reference Lehtinen, Londholm and VeijolaLehtinen et al, 1990). A variety of social and medical factors have been considered in an attempt to explain the higher rate of depressive disorders in women (Reference Bebbington, Sturt and TenantBebbington et al, 1984; Reference Vázquez-Barquero, Diez-Manrique and GaiteVázquez-Barquero, 1987). Further analysis of the data collected in the epidemiological arm of the ODIN study will enable us to test whether some of the gender differences in the depressive disorders prevalence estimates across sites could be explained by different levels of exposure to life events and other social factors.
When DSM-IV and ICD-10 criteria were compared, there were notable similarities in the global prevalence figures for all diagnostic categories; however, at some centres a discordance was found between ICD-10 and DSM-IV diagnoses. Previous studies have also documented discordance between these two major psychiatric classification systems, for the diagnosis of cases in community surveys (Reference Andrews, Slade and PetersAndrews et al, 1999). This could be due to the ICD-10's lower threshold in the number of symptoms required for the diagnosis of a depressive episode.
Urban-rural differences
Most research on the epidemiology of depression in Europe has been conducted in urban settings. The few available studies assessing differences in prevalence of depression between urban and rural areas vary widely in their findings (Reference Brown and PrudoBrown & Prudo, 1981; Reference Vázquez-Barquero, Diez-Manrique and GaiteVázquez-Barquero et al, 1987; Reference Sievewright, Tyrer and CaseySievewright et al, 1991). This variety of outcomes could be attributable to differences in the measures used, and in the selection and sampling of rural and urban areas. In the ODIN study we tried to overcome these problems by using the same methodology in the urban and rural sites at each centre. We found that the weighted prevalence of depressive disorders among responders in the four rural communities was relatively uniform, ranging between 6.5% and 9.3%. However, the weighted prevalence in the five urban communities varied markedly, from 2.6% in Santander to 17.1% in Liverpool and 12.8% in Dublin. These differences in the prevalence figures suggest that there are cultural differences or different risk-factor profiles across countries and sites which may affect the expression of the disorder. The role of psychosocial factors (mainly life events and social support) in explaining these wide differences in the prevalence of depressive disorder across study sites will also be examined in later publications. Our finding of lower prevalence of depressive disorders in rural areas than in urban ones, in three of the four countries where urban and rural samples were studied, agrees with the results of other epidemiological studies (Reference Crowell, George and BlazerCrowell et al, 1986). In Britain, the National Psychiatric Morbidity Survey reported higher rates of depression in urban areas than in rural ones, but relied on the interviewers' opinion of whether subjects lived in an urban, semi-rural or rural areas (Reference Jenkins, Lewis and BebbingtonJenkins et al, 1997). The Netherlands Mental Health Survey and Incidence Study also found that people living in rural regions showed lower prevalences of mood disorders (Reference Bijl, Ravelli and van ZessenBijl et al, 1998).
In the ODIN study, not only did the rural communities show a lower prevalence of depressive disorders than the urban ones, but the prevalence figures in rural areas remained strikingly similar across the different sites, whereas the urban figures varied markedly from one country to another. A methodological factor in our design could have influenced this uniform distribution of depressive disorders among rural communities in Europe found in the ODIN study. In our methodology, ‘rural’ was defined according to a similar socio-economic definition: rural areas were those having no centre of population greater than 15 000 people, with at least 20% of economically active citizens engaged in occupations directly related to agriculture, fishing or forestry. On the contrary, ‘urban’ was defined solely in terms of population density criteria. Thus, the uniform distribution of depressive disorders across the rural sites could be merely a reflection of a similar distribution of socio-economic factors. On the contrary, the heterogeneity of the prevalence figures in the urban sites could be related in part to the heterogeneous socio-economic circumstances across the study sites. Further analysis of the ODIN sample will enable us to study to what extent these urban-rural differences in the prevalence of depressive disorders may be related to differential exposure to life events or differential levels of social support networks, as has been recently proposed by Paykel et al (Reference Paykel, Abbot and Jenkins2000).
Implications
Although the representation of European countries is incomplete, the centres in this study are spread between northern and southern Europe, representing different religious denominations and covering mainland areas and islands. The information gathered in the ODIN study could be used to evaluate needs for treatment and the allocation of health resources. However, some authors have raised concerns about the health policy implications of high prevalence rates of psychiatric disorders for determining treatment needs (Reference Regier, Kaelber and RaeRegier et al, 1998; Reference SpitzerSpitzer, 1998). In particular, they question whether making a psychiatric disorder diagnosis can be equated with demonstrating a treatment need. It is still unclear to what extent the psychiatric disorders, as defined by rigorous criteria such as the ICD-10 or DSM-IV used in our project, identified in community populations are equivalent to those identified with the same criteria in clinical settings, or whether they have the same clinical significance and response to treatment. The design of the ODIN enables us to introduce new elements of discussion into this debate, and adds fresh evidence that validates the ability of epidemiological studies to identify subjects with depressive disorders who might benefit from therapeutic interventions. As we have described elsewhere (Reference Dowrick, Casey and DalgardDowrick et al, 1998), this is the first population-based study that incorporated into its design a randomised controlled trial of individual problem-solving treatment and a group psychoeducation programme. Participants identified as having depression in the epidemiological phase were offered the chance to take part in the controlled trial, the results of which (Reference Dowrick, Dunn and Ayuso-MateosDowrick et al, 2000) suggest that psychological interventions are effective in reducing depressive caseness, symptoms and personal disability in the short term. Thus, our prevalence estimates identified a segment of the population with a depressive disorder that could benefit from an intervention.
We believe that the data in the present study confirm that depressive disorder is a highly prevalent condition among working-age adults in Europe, particularly in urban centres, and that this epidemiological information should be used to inform and implement equitable and effective health policies across the continent in order to address this public health challenge.
Clinical Implications and Limitations
CLINICAL IMPLICATIONS
-
• The prevalence estimates in the present study show that a substantial proportion of the population of working age in Europe has a depressive disorder that could benefit from an intervention in the short term.
-
• Rural communities show a lower prevalence of depressive episodes than urban ones in three of the four countries where urban and rural samples were studied.
-
• Our findings could be considered a representative baseline framework on the extent of depressive disorders in Europe. By repeating this survey in future years, it will be possible to monitor the effectiveness of mental health prevention and treatment programmes.
LIMITATIONS
-
• The representation of European countries is incomplete.
-
• Use of different strategies in the first phase of the community survey (home interviews in Santander, postal survey in the other centres).
-
• Problems related to the representativeness of the sample in some of the centres, mainly due to the high rate of refusal and low response rate at those centres.
Acknowledgements
Financial support for the ODIN Project, in addition to that provided by the European Commission Biomed 2 programme, has come from the NHS Executive North-West Research and Development Office (Contract RDO/18/31); the Spanish FIS (Exp. No 96/1798); the Wales Office of Research and Development (Contrast RC092); the Norwegian Research Council, Council for Mental Health and Department of Health and Social Welfare; and the Finnish Pensions Institute of Agricultural Entrepreneurs (Contract 0339).
The ODIN Group is composed of the academic colleagues and research and administrative staff who have worked on this part of the Outcome of Depression International Network (ODIN) Project. They include: Javier Ballesteros, Gail Birkbeck, Trygve Børve, Maura Costello, Pim Cuijpers, loana Davies, Juan Francisco Diez-Manrique, Nicholas Fenlon, Mette Finne, Fiona Ford, Luis Gaite, Andres Gomez del Barrio, Claire Hayes, Andrés Herrán, Ann Horgan, Tarja Koffert, Nicola Jones, Marja Lehtilä, Catherine McDonough, Erin Michalak, Christine Murphy, Anna Nevra, Teija Nummelin and Britta Sohlman.


eLetters
No eLetters have been published for this article.