


Obsessive—compulsive disorder (OCD) is a serious and treatment-responsive mental health problem, with onset in childhood or adolescence occurring in at least half of all cases (Reference Rasmussen, Eisen, Jenike, Baer and MinicielloRasmussen & Eisen, 1998). It is likely that OCD in all age groups is under-recognised, so knowing the population rates of this disorder is important in anticipating service provision. Existing epidemiological studies of OCD in young people aged 18 years or under (see Table 1 for a summary) indicate prevalence rates of 0.1-4%, with relatively few of these studies including prepubertal children. The purpose of this article is to report on the first British population-based study of childhood OCD in order to: estimate the prevalence rates for OCD; describe the age trends of these rates; describe the correlates of OCD in terms of associated demographic findings, behavioural symptoms and comorbid diagnoses; and establish the global impact on functioning.
Table 1 Prevalence of obsessive—compulsive disorder
| Authors | Site | Number | Age (years) | Prevalence (%) | M/F (% or n) |
|---|---|---|---|---|---|
| Reference Flament, Whitaker and RapoportFlament et al, 1988 | USA, | 5596 | 14-18 | 1.9LT | 11 M/9 F |
| Northeast | |||||
| Reference Lewinsohn, Hops and RobertsLewinsohn et al, 1993 | USA, | 1710 | 14-18 | 0.06 | 0% M/ 0.11% F |
| Oregon | 0.53LT | 0.73% M/0.34% F | |||
| Reference Reinherz, Giaconia and LefkowitzReinherz et al, 1993 | USA, | 386 | 17-18 | 1.3 | |
| north-east | 2.1LT | 2 M/6 F | |||
| Reference Zohar, Ratzoni and PaulsZohar et al, 1992 | Israel, | 562 | 16-17 | 3.56LT | 4.5%LT M/1.6%LT F |
| army recruits | |||||
| Reference Zohar, Ratzoni and BinderZohar et al, 1993 | Israel, | 861 | 16-17 | 2.3LT | 2.4%LT M/2.4%LT F |
| army recruits | |||||
| Reference Valleni-Basile, Garrison and JacksonValleni-Basile et al, 1994 | USA, | 3283 | 12-15 | 2.9 | 3.3% M/2.6% F |
| south-east | |||||
| Reference Douglass, Moffitt and DarDouglass et al, 1995 | New Zealand, | 930 | 18 | 4.0 | 15 M/22 F |
| Dunedin | |||||
| Reference Costello, Angold and BurnsCostello et al, 1996 | USA, | 4500 | 9, 11, 13 | 0.17 | 0.20% M/0.14% F |
| North Carolina | |||||
| Reference Canals, Domenech and CarbajoCanals et al, 1997 | Spain, | 290 | 18 | 0.7 (DSM-III-R) | 1.4% M/0% F |
| Catalonia | 1.4 (ICD-10) | 2.1% M/0.6% F | |||
| Reference Verhulst, van der Ende and FerdinandVerhulst et al, 1997 | Holland | 2916 | 13-18 | 1.0 | No data available |
| Reference Steinhausen, Metzke and MeierSteinhausen et al, 1998 | Switzerland, | 1964 | 7-16 | 0.21 | No data available |
| Zurich | |||||
| Reference Wittchen, Nelson and LachnerWittchen et al, 1998 | Germany, | 3021 | 14-24 | 0.6 | 0.4% M/0.8% F |
| Munich | 0.7LT | 0.5%LT M/0.9%LT F | |||
| Reference Maina, Albert and BogettoMaina et al, 1999 | Italy, | 1883 | 17 | 2.0 | Male-only sample |
| Piedmont | 2.6LT |
METHOD
The major survey design features are summarised here. Full details about the methodology of the survey are available elsewhere (Reference Meltzer, Gatward and GoodmanMeltzer et al, 2000).
Sample
The parents of children in the UK are entitled to receive child benefits. The centralised computerised records from the Child Benefit Register (CBR) were used as a sampling frame to select children aged 5-15 years throughout England, Wales and Scotland. Families with no detailed postal code in the database or those subjected to a current revision of their record (i.e. death of the child, changing address) were excluded. The total number finally included in the sampling frame was 6 422 202, representing an estimated 90% coverage of the whole population. The sampling frame was stratified further by the Regional Health Authority, and within that by socio-demographic groupings. Postal sectors then were selected at random within that frame, with a probability proportional to the size of the sector. To facilitate the logistics of the survey, a few areas were oversampled but weights were introduced in the analysis to adjust for unequal sampling probabilities. From the final list of 475 postal sectors selected from the 8265 sectors covering the whole country, the CBR was instructed to sample 30 children within each postal sector and a letter subsequently was sent to the families by the CBR on behalf of the Office for National Statistics (ONS) survey team. Of the 14 250 families contacted, 931 parents (6.5%) chose to opt out by calling the CBR and a further 790 addresses (5.5%) were found to be incorrect. This left a sample of 12 529 children eligible for interview.
Instruments
The diagnostic interview used in this survey is a new instrument (Development and Well-Being Assessment: DAWBA) combining the features of structured and semi-structured interviews (Reference Goodman, Ford and RichardsGoodman et al, 2000). The DAWBA is administered by trained interviewers, who interview parents about psychiatric symptoms and their functional impact. Interviewers also enter on the computer a verbatim account of parental descriptions of positive symptoms, which are elaborated by open-ended questions and supplementary prompts. A teacher questionnaire on common symptoms and their impact is included. A DAWBA module for direct interview of subjects is available for 11— to 16-year-olds. Most common psychiatric disorders are covered by the DAWBA. Diagnoses subsequently are generated by computer algorithms based on DSM-IV (American Psychiatric Association, 1994) and the Tenth Revision of the International Classification of Diseases (ICD—10 Diagnostic Criteria for Research; World Health Organization, 1993) using the information from all available informants. These computer-generated summary sheets and all interview data subsequently are reviewed by experienced clinicians, who confirm or overturn the computer-generated diagnoses. The reliability of clinical diagnosis was assessed by two clinicians who, independently, rated 500 randomly chosen subjects. The kappa statistic for chance-corrected agreement for the presence or absence of any DSM—IV diagnosis was 0.86 (95% CI 0.78-0.95).
Although the main focus of the survey was on common child psychiatric disorders, a screening question was introduced in the DAWBA to detect possible obsessive—compulsive symptoms. This question was preceded by an explanation as follows: “Many children have some habits or superstitions, such as not stepping on the cracks in the pavement, or having to go through a special goodnight ritual, or having to wear lucky clothes or to have a lucky mascot for exams or football/netball matches. It is also common for children to go through phases when they seem obsessed by a particular subject or activity. I want to ask whether [Child] has rituals or obsessions that go beyond this”. If there was a positive response to the screening question — “Overall, does [Child] have rituals or obsessions that upset him/her, waste a lot of his/her time, or interfere with his/her ability to get on with everyday life?” — then more detailed parent and child descriptions of the child's past and current levels of obsessive—compulsive phenomena were obtained.
Other survey instruments used in this analysis were the parent, teacher and youth (for children aged 11 years or more) extended versions of the Strength and Difficulties Questionnaire (SDQ; Reference GoodmanGoodman, 1999). The SDQ is a brief screening measure enquiring about psychiatric symptoms and positive attributes and assessing the impact of the psychiatric symptoms. In addition to the total score, five sub-scores are derived that tap emotional state, conduct, hyperactivity, prosocial behaviour and peer relationships. The behaviour and the impact scores have been shown to have good reliability and validity (Reference GoodmanGoodman, 1999). If children had obtained a high score on the emotional sub-scale of the SDQ, parents were also asked in more detail about OCD symptoms, irrespective of whether the response to the OCD screening question in the DAWBA was positive. In addition, parents completed a 12-item self-report measure that assesses common psychological symptoms for the current period (GHQ—12; Reference Goldberg and WilliamsGoldberg & Williams, 1988).
Intelligence
Survey children of all ages were administered the British Picture Vocabulary Scale (BPVS—11; Reference Dunn, Whetton and BurleyDunn et al, 1997) and reading and spelling tests from the British Ability Scales (BAS—II; Reference Elliott, Smith and McCullochElliott et al, 1996). The BPVS IQs were available for all 25 of the children with OCD.
Data collection procedure
Lay interviewers (about 300) regularly involved in the Office for National Statistics surveys were used to collect survey data. Special attempts were made to trace families whose addresses or names had changed. Interviewer training emphasised the need to obtain respondents' descriptions of any problems and concerns in their own words. Interviewers first completed the face-to-face interview with the main caregiver (90% mothers) and permission subsequently was sought to ask questions of the sampled child. Children aged 11-15 years had a private face-to-face interview. At the end of the interview, parents were asked to nominate a teacher who knew their child well and to whom the SDQ subsequently was mailed, with a reminder letter if necessary.
Statistical analyses
Two weights were devised to adjust for unequal probability of postal sector selection in the sampling frame and to compensate for differential response rate by region. Then, adjustment weights were used to correct for non-response bias, with the age and gender distribution of survey respondents being equated to the population structure as determined from the 1991 Census. All prevalence estimates were calculated with the weighted sample, and asymptotic 95% confidence intervals were obtained with Stata version 6 software (Stata Corporation, 1997). The remaining analyses were conducted on unweighted data because further analyses of the survey showed small design effects on most estimates. A conventional P value of 0.05 was retained as the level of statistical significance.
RESULTS
Of the 12 529 eligible children, interviews were conducted with 10 438 subjects (83%). Failure to interview was owing to either non-contact (2%) or refusal (15%). Within cooperating families, interviews were completed in 95.3% of the cases. The teacher response rate was 80.3% for the whole sample and 64% in the OCD group. Participation in general was lower within the London metropolitan area (around 70%) but appropriate weights corrected for the possible resulting bias. Because no data were available on non-respondents, it is impossible to evaluate the extent to which non-participation in this survey might have been associated with higher rates of psychiatric morbidity, and more specifically with the presence or absence of a child with OCD in the family.
All the cases given a diagnosis of OCD by the survey team were reviewed by an independent child psychiatrist with a special interest in OCD (I. H.). The initial diagnostic evaluation was confirmed in 96% of the cases. One child was excluded from the original subset thought to have OCD, and one child from the survey in whom the diagnosis had been uncertain was added to the final sample. Of the remaining children, 9509 had no psychiatric diagnosis, and 904 received another psychiatric diagnosis. For the purposes of this analysis, the children with OCD are compared with the normal controls and a psychiatric control group consisting of 421 children with emotional disorders, some of whom also had an additional non-emotional disorder such as a conduct disorder.
Prevalence, age and gender
Of the 10 438 subjects included in the survey, 25 children received a diagnosis of OCD. After weighting the sample for differential response, this gives an overall prevalence of 0.25% (95% CI 0.14-0.35). Although overall numbers are small, dividing OCD cases into the age bands shown in Table 2 reveals an exponential increase in the rate of OCD as age increases (Fig. 1). Diagnoses in the under-11s are based on parental accounts and in the over-11s on a self-report and parental report, but the increase with age is not accounted for simply by a jump in prevalence after the age of 11 years, when self-report is included. The increase with age is just as evident when the number of informants does not change (from 5-7 to 8-10 years or from 11-12 to 13-15 years). Prevalence rates for the different age bands are as follows: 5-7 years, 0.026% (95% CI 0.00-0.08); 8-10 years, 0.14% (95% CI 0.002-0.28); 11-12 years, 0.21% (95% CI 0.004-0.41); 13-15 years, 0.63% (95% CI 0.30-0.95). There were equal numbers of boys (13) and girls (12) with OCD overall.
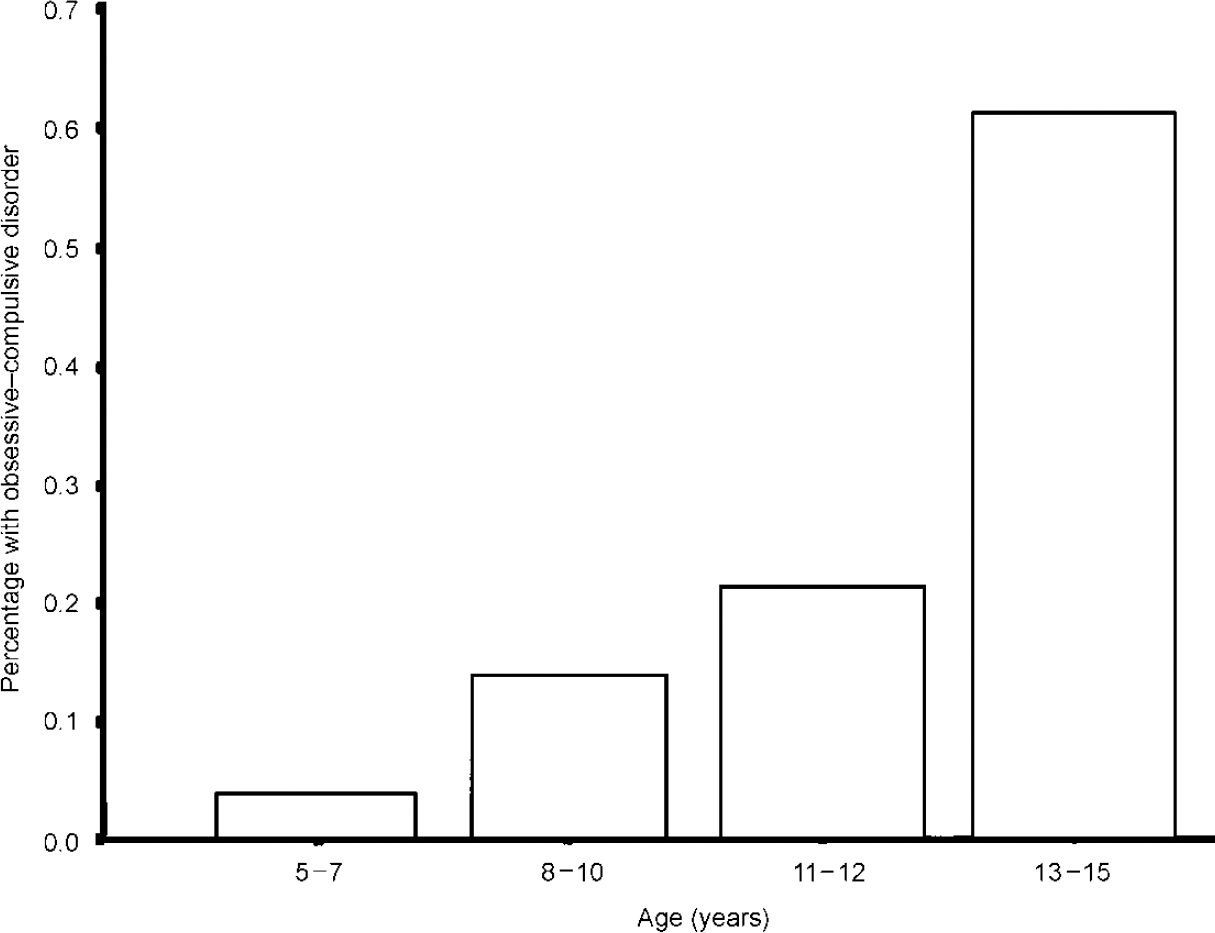
Fig. 1 Age trends.
Table 2 Sample characteristics
| Normal controls (n=9509) | Emotional disorders (n=421) | OCD (n=25) | P (χ2 test) | |
|---|---|---|---|---|
| Age (%) | ||||
| 5-7 years | 28.9 | 22.8 | 4.0 | 0.0001 |
| 8-10 years | 28.6 | 21.8 | 16.0 | |
| 11-12 years | 18.2 | 18.6 | 16.0 | |
| 13-15 years | 24.4 | 36.8 | 64.0 | |
| Gender (% male) | 48.9 | 47.0 | 52.0 | NS |
| Social class (%) (as defined by occupation of head of household) | ||||
| I | 8.2 | 3.3 | 4.3 | 0.0001 |
| II | 33.1 | 26.3 | 17.4 | |
| III (non-manual) | 12.1 | 16.1 | 4.3 | |
| IV (manual) | 26.3 | 27.0 | 47.8 | |
| IV/V | 20.2 | 27.3 | 26.1 | |
| Ethnicity (% White) | 91.3 | 92.4 | 76.0 | 0.019 |
| Family size (%) | ||||
| 1 child | 20.7 | 22.8 | 12.0 | 0.002 |
| 2 children | 45.9 | 39.7 | 24.0 | |
| 3 children | 23.1 | 23.5 | 40.0 | |
| 4+ children | 10.3 | 14.0 | 24.0 | |
| Marital status (%) | ||||
| Married | 71.3 | 56.3 | 56.0 | 0.0001 |
| Cohabiting | 7.6 | 7.6 | 12.0 | |
| Lone parent | 21.0 | 36.1 | 32.0 | |
| Income (%) (£/week gross) | ||||
| 0-199 | 22.1 | 38.7 | 34.8 | 0.0001 |
| 200-299 | 14.6 | 18.8 | 30.4 | |
| 300-399 | 12.3 | 11.6 | 13.0 | |
| 400-599 | 21.5 | 13.1 | 13.0 | |
| 600+ | 29.5 | 17.8 | 8.7 |
The characteristics of the 25 children with OCD are summarised in Table 2, compared with normal controls (n=9509) and the group with emotional disorders other than OCD (n=421). There was a significant difference (P<0.0001) in age distribution between the three groups, the OCD group being older, with 16 individuals aged 13 years or older and only one aged less than 8 years. The OCD cases were significantly older than both the normal controls (χ2=22.8; d.f.=3; P<0.001) and the psychiatric controls (χ2=8.8; d.f.=3; P=0.03). The mean age of the OCD cases is 12.6 years (s.d.=2.2; range=7-15).
Correlates
Social class distribution (see Table 2) differed between the three groups (P<0.0001). Compared with normal controls, the social class of the OCD sample was significantly lower, with 74% being in the lower social classes compared with 47% of the normal controls (χ2=6.9; d.f.=1; P=0.009). When the OCD group was compared with the psychiatric controls, a similar shift towards lower social classes was found (χ2=3.4; d.f.=1; P=0.66). Family size differed across the three groups (P<0.002); children with OCD came from larger families than normal controls (χ2=11.1; d.f.=3; P=0.011), with a similar trend when compared with the psychiatric controls (χ2=7.0; d.f.=3; P=0.073). Income levels also differed significantly between the three groups. Families of children with OCD had significantly lower incomes than normal controls (χ2=9.5; d.f.=3; P=0.023) but income was not different from that found in psychiatric controls (χ2=2.2; d.f.=3; NS). In summary, OCD occurred equally often in boys and girls, but those with OCD differed from the other children in tending to be older and from larger families. Their families also tended to be of lower social class and to have lower average incomes.
There was a significantly greater proportion of children from ethnic minorities in the OCD sample compared with the normal controls or the psychiatric controls (P=0.019).
The mean BPVS IQ of the 25 OCD cases was 87.4 (s.d.=15.3; range=65-120). This compares with a mean IQ of 95.7 in the emotional disorder control group and 101.8 in the normal controls. The OCD group was significantly lower than the normal controls (t=4.69; P<0.001) and the psychiatric control group (t=2.26; P=0.025). Within the OCD group further analysis was carried out, comparing those with and without comorbid conduct disorder and those from low and high socio-economic class. Low IQ was not accounted for by either of these variables. Only 1/25 cases had a specific learning disability (ability-attainment discrepancy in the lowest 5%).
Comorbidity
Comorbid diagnoses were found in 19 cases (76%), both using ICD—10 and DSM—IV comorbid definitions. Using ICD there were 10 subjects (40%) with two or more diagnoses; the corresponding figure using DSM—IV was 11 subjects (44%). Using ICD—10, the types of comorbid diagnoses were: 13 with anxiety disorders (52%), 5 with depression (20%), 11 with conduct disorder (44%) and 1 with an eating disorder (4%). An examination of the 11 cases with a broad conduct disorder diagnosis shows that 6 had oppositional defiant disorder, 3 had socialised conduct disorder and 2 had other forms of conduct disorder. There were no children with comorbid hyperactivity or tic disorders.
Impact of OCD and service use
The impact scores of the parent SDQ (five items; range 0-10) and of the teacher SDQ (three items; range 0-6) were used to assess overall impairment in the child's functioning (Table 3). Impact scores for all informants were significantly higher in children with OCD than in normal control children. Parents and teachers of children with other emotional disorders rated them as presenting a similarly high impact as children with OCD. Children with OCD did not rate their own impairment significantly differently from the ratings given by children in the psychiatric control group. Self-report scores on the GHQ showed similar levels of psychological distress in parents of children with OCD and with other non-OCD diagnoses.
Table 3 Children's behavioural difficulties and family variables
| Normal controls (NC) (n=9509) | Emotional disorder (ED) (n=421) | OCD (n=25) | Post hoc Scheffé tests1 | |
|---|---|---|---|---|
| SDQ scores | ||||
| Impact | ||||
| Parent | 0.21 | 2.00 | 2.17 | OCD, ED>NC |
| Teacher | 0.27 | 1.17 | 1.19 | OCD, ED>NC |
| Self | 0.16 | 1.25 | 1.10 | OCD, ED>NC |
| Burden | ||||
| Parent | 0.26 | 1.32 | 1.21 | OCD, ED>NC |
| Teacher | 0.27 | 0.73 | 1.00 | OCD, ED>NC |
| Self | 0.24 | 0.84 | 0.90 | OCD, ED>NC |
| Parental self-report (GHQ-12) | ||||
| Total GHQ | 1.63 | 3.98 | 3.50 | OCD, ED>NC |
| Family Function Scale | ||||
| Score | 20.24 | 22.35 | 23.42 | OCD, ED>NC |
Previous contact with services also was examined. At some stage in the history of their child's difficulties, 36% of the families of children with OCD had consulted their general practitioner, either for OCD or for a comorbid emotional or behavioural problem. The corresponding rates of consultation were 12% for child specialist services (paediatricians or child mental health services), 8% for social services, 20% for educational services and 0% for alternative therapies.
DISCUSSION
Prevalence, gender and age trends
It is difficult to compare the overall prevalence of OCD in this epidemiological sample with the rates from other studies, because most other studies of young people have included those aged up to 18 years, whereas this study only included those aged 15 years and under. The overall rate is in line with two previous studies of this age group (Reference Costello, Angold and BurnsCostello et al, 1996; Reference Steinhausen, Metzke and MeierSteinhausen et al, 1998). Higher rates of 1-4% have been found in surveys screening up to age 18 years. The results presented here show exponential increases in each increasing age band, and it seems plausible that the majority of cases in young people occur in 16— to 18-year-olds, thus bringing the overall rates up to above 1%, as shown in other studies. For example, in the study of 14— to 18-year-olds by Flament et al (Reference Flament, Whitaker and Rapoport1988), 15 of the 18 children with OCD were aged 16 years or older. Neither our results nor previous published results are in line with the findings of Valleni-Basile et al (Reference Valleni-Basile, Garrison and Jackson1994) on 12— to 15-year-olds. They report a very high prevalence rate of OCD in this age group, with a reversal of the normal age trend (rates falling between 13 and 15 years).
Our finding of equal rates in boys and girls is consistent with most epidemiological studies of this age group (Reference Flament, Whitaker and RapoportFlament et al, 1988), although clinical samples frequently have contained more boys than girls. By age 18 years a female predominance is reported in epidemiological samples (59.55% in Reference Douglass, Moffitt and DarDouglass et al, 1995) and this is the case for most adult studies.
The trend towards higher rates of OCD in the ethnic minority groups reported here is in contrast to previous findings in epidemiological samples. Other studies have suggested that OCD is relatively rare in non-White populations, although this might not be specific to OCD, because rates for other psychiatric disorders appeared low (Reference Karno, Golding and SorensonKarno et al, 1988).
Social class and intelligence
Most previous epidemiological studies would have been unable to detect ethnic or socio-economic trends because the samples usually have consisted of rather homogeneous populations, unlike the nationwide sample reported in the present study. The sample surveyed here shows a trend for higher rates of OCD in lower socio-economic groups, in line with most other psychiatric disorders detected in the survey. This is in contrast with the findings of Flament et al (Reference Flament, Whitaker and Rapoport1988), who found no correlation with socio-economic status. Clinical samples consistently have shown the reverse trend (Reference HannaHanna, 1995), and the belief that OCD is a disorder of children of high social class seems quite widespread but probably represents an artefact of clinic populations.
The present study shows that the individuals with OCD had significantly lower IQs than normal controls. Few epidemiological studies have included measures of cognitive functioning, so it is difficult to compare the finding reported here with other samples. In a study of young Israeli army recruits, similar findings are reported for individuals with OCD compared with normal controls (Reference Zohar, Ratzoni and BinderZohar et al, 1993). Another study failed to show any difference in cognitive profile between young individuals with OCD and psychiatric or normal controls (Reference Douglass, Moffitt and DarDouglass et al, 1995). Several studies have reported school difficulties in young people with OCD, including higher rates of significant specific learning disability, that appear to predate the onset of OCD (Reference Swedo, Rapoport and LeonardSwedo et al, 1989; Reference HannaHanna, 1995). Once again, this finding of lower IQs in individuals with OCD is in contrast to the beliefs stated in much of the early anecdotal literature, where it is held generally that people with OCD are of above average intelligence (reviewed by Reference Rasmussen, Eisen, Jenike, Baer and MinicielloRasmussen & Eisen, 1998).
Comorbidity
The high rates of comorbidity reported here are in line with the rates from other epidemiological samples, showing that about two-thirds of young people with OCD have at least one other psychiatric diagnosis (reviewed by Reference ZoharZohar, 1999). Several clinical studies report rates of about 20% for comorbid tic disorders, but this was not found in our sample, nor in most other epidemiological samples (Reference Flament, Whitaker and RapoportFlament et al, 1988; Reference Douglass, Moffitt and DarDouglass et al, 1995). One epidemiological study that included specific screening questionnaires for tics did report higher than expected rates of tic disorder (Reference Zohar, Ratzoni and PaulsZohar et al, 1992).
This high rate of comorbidity, the often chronic nature of OCD itself and the associated disadvantages may contribute to the high levels of impairment experienced by young people with OCD. There is a clinical suggestion that early detection and treatment can improve prognosis (Reference Leonard, Swedo and LenaneLeonard et al, 1993), yet the majority of children identified in this survey were unknown to services despite the availability of safe and effective treatments (Reference Rapoport and Inoff-GermainRapoport & Inoff-Germain, 2000).
Clinical Implications and Limitations
CLINICAL IMPLICATIONS
-
• Obsessive—compulsive disorder (OCD) is rare in young children but prevalence rises exponentially with increasing age.
-
• As in most child psychiatric disorders, childhood OCD is associated with lower socio-economic class and lower intelligence.
-
• Few children with OCD are in contact with specialist services, suggesting that most go untreated.
LIMITATIONS
-
• Although clinicians were involved in the rating of assessments, the assessments themselves were carried out by non-clinicians.
-
• Despite sampling from over 10 000 children, only 25 cases of OCD were identified, which limits the power of subgroup analysis.
-
• The cross-sectional nature of this study did not allow a prospective assessment of the natural history of the disorder or of access to services.
Acknowledgements
The survey was funded by the British Department of Health and carried out by the Office for National Statistics.


eLetters
No eLetters have been published for this article.