


More than 90% of those admitted formally to psychiatric hospitals in England are detained under Part II of the Mental Health Act 1983 (Department of Health, 1999). The aggregate returns collected by the Department of Health give limited information about the characteristics of those subject to this part of the Act (Department of Health, 1999). A more detailed exploration of how Part II of the Act is applied to different sections of the population, defined by age, gender and ethnicity, would require data to be collected about individual detentions under the Act. The existence of data-sets collected by a number of local authorities and National Health Service (NHS) trusts, for purposes other than central monitoring, provides an opportunity to do this.
METHOD
Identification of Mental Health Act data-sets
At the outset, the research team was aware of data collected by local authorities in the north-west of England, Nottingham and Kirklees. These data collections originated from a study of social work activity under the Act conducted by the Social Services Research Group in 1985-1986 (Reference Fisher, Barnes and BowlFisher et al, 1987; Reference Barnes, Bowl and FisherBarnes et al, 1990). This work was modified and extended by the University of Manchester for the north-west sites (Reference Hatfield, Mohamad and HuxleyHatfield et al, 1992). To supplement this information, the research team wrote to all other local authorities and all NHS trusts in England and Wales (with a follow-up letter to non-responders), asking whether they had computerised data about the use of the Act. Organisations that responded positively were contacted, and when necessary visited, to explore the nature and quality of the data. Only those that had collected information relating to at least two consecutive years were included. The data collected had a range of start and stopping dates. Overall, the data collection period covered the years 1988 to 1999 inclusive. Ten sites provided data covering the period 1995 to 1998, with six sites providing data covering the period 1990 to 1998.
Census data
Demographic data were obtained from the Manchester Information and Associated Services (MIMAS) data centre at the enumeration district level. These data are based on the national census and include information about the composition of population in terms of age, gender and ethnicity.
Data management and missing data
The data from local authorities, which used a variety of formats and codes, were reformatted, redefined and merged. This involved dialogue with those in the local authorities and trusts who were responsible for managing the data locally. Ethnicity was recorded in a number of ways (the number of categories ranged from four to 16). To achieve a common denominator, ethnicity was recoded to one of four categories. The census data were also recoded to the same categories. The category ‘White’ included White people of European, North American or Australasian origin; ‘Black’ included those described as Black African, African—Caribbean, Black British or Black Other; ‘Asian’ included those of Indian, Bangladeshi, Pakistani, Chinese and Japanese origin; and ‘Other’ included people of South American, Middle Eastern and North African origin.
Most sites had some missing data. Reasons for this included refusal by individual approved social workers to participate, and temporary suspension of data collection during staff absences. The research team interviewed local data managers to estimate the extent of missing returns for each site. The total amount of missing data was calculated to be about 14%. Estimates for individual sites ranged from 0% to 50% (median 10%). These estimates were used to weight the data.
Census data were aggregated from the level of the enumeration district to that of the local authority.
Data analysis
The analyses reported here relate to the use of Sections 2, 3 and 4 of the Act. For some analyses, census data were used to standardise the rates of sectioning for specific subgroups of the population defined by age, gender and ethnicity. Data were analysed using SPSS version 8 (SPSS, 1997) and STATA version 5 (StataCorp, 1997).
RESULTS
The sites
Data suitable for inclusion were obtained from 20 local authorities and six trusts. One of the trusts had a catchment area coterminous with that of a local authority. There was no overlap between the catchment populations of the local authorities and NHS trusts. The size of the catchment populations of the sites varied considerably (98 000-994 000). Their combined catchment population was 9.2 million, about 18% of the total population of England and Wales.
How representative are the sites?
The Office for National Statistics (ONS) has created a classification of English local authorities based on census and other social demographic variables (Office for National Statistics, 1996). These provide a simple indicator of the similarity between areas for comparative or targeting purposes. Nine of the eleven ONS classification groups were represented among the 20 organisations whose catchment areas were coterminous with an English local authority area. The two ONS groupings not represented are two of the more affluent ones: ‘most prosperous’ and ‘resort and retirement’. Jarman underprivileged area scores (Reference JarmanJarman, 1983) for the 20 English local authorities ranged from 92 to 154. The distribution of scores confirmed that the most socially privileged areas of the country were slightly under-represented.
Some personal demographic characteristics of the population of the 20 English local authority areas could be compared with those of the population of England as a whole using data from MIMAS. These suggested that the sample was representative of the national picture in terms of gender (48.3% male for the sample v. 48.4% male for the population as a whole), marital status (46.6% v. 45.6% married) and ethnicity (1.8% v. 1.9% Black; 3.4% v. 3.7% Asian and 0.6% v. 0.6% Other).
Detentions under Part II of the Act
The mean number of years over which the 26 local authorities and trusts collected data was 5.6 (median 5, range 2-11). All data related to the period between 1988 and 1998. The final data-set contained information about 31 702 episodes of detention under Part II of the Act.
Forty-nine per cent of the detentions were of men (n=15 418). Of those detentions for which ethnicity data were available (n=29 860), 8% were of Black people (n=2279), 4% of Asian people (n=1213) and 2% of people from another ethnic minority group (n=529).
Age and gender
The number of detentions per year under the Mental Health Act is shown for men and women and by age groups in Fig. 1.
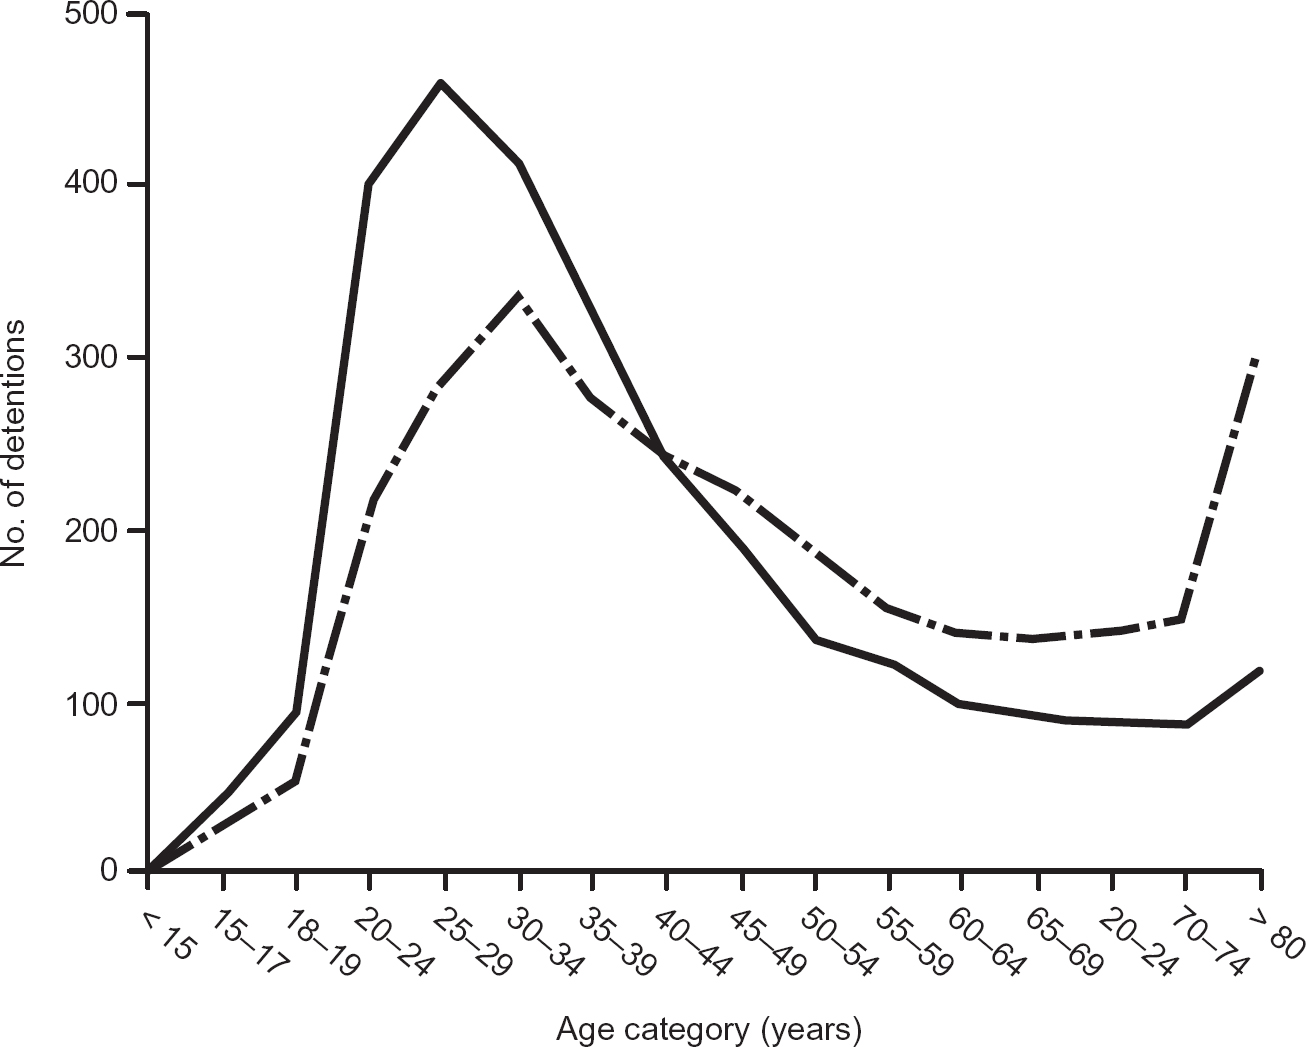
Fig. 1 The number of detentions under Part II of the mental Health Act 1983 per year for men (solid line) and women (broken line) by age group.
-
(a) The highest rates of detention under Part II of the Act are of people aged 25-34 years. Forty-seven per cent of all detentions are of people aged 20-39 years.
-
(b) The mode for detentions is at a slightly younger age group for men than for women (25-29 v. 30-34 years).
-
(c) Men make up 59% of detentions of those aged 20-39 years.
-
(d) The differential between the genders reverses after the age of 40 years. A higher proportion of detentions of older people are of women. This is most pronounced for the oldest age groups (over 80), where 72% of detentions under Part II are of women.
Figure 2 shows the effect of standardising Part II detentions to age— and gender-specific population rates.
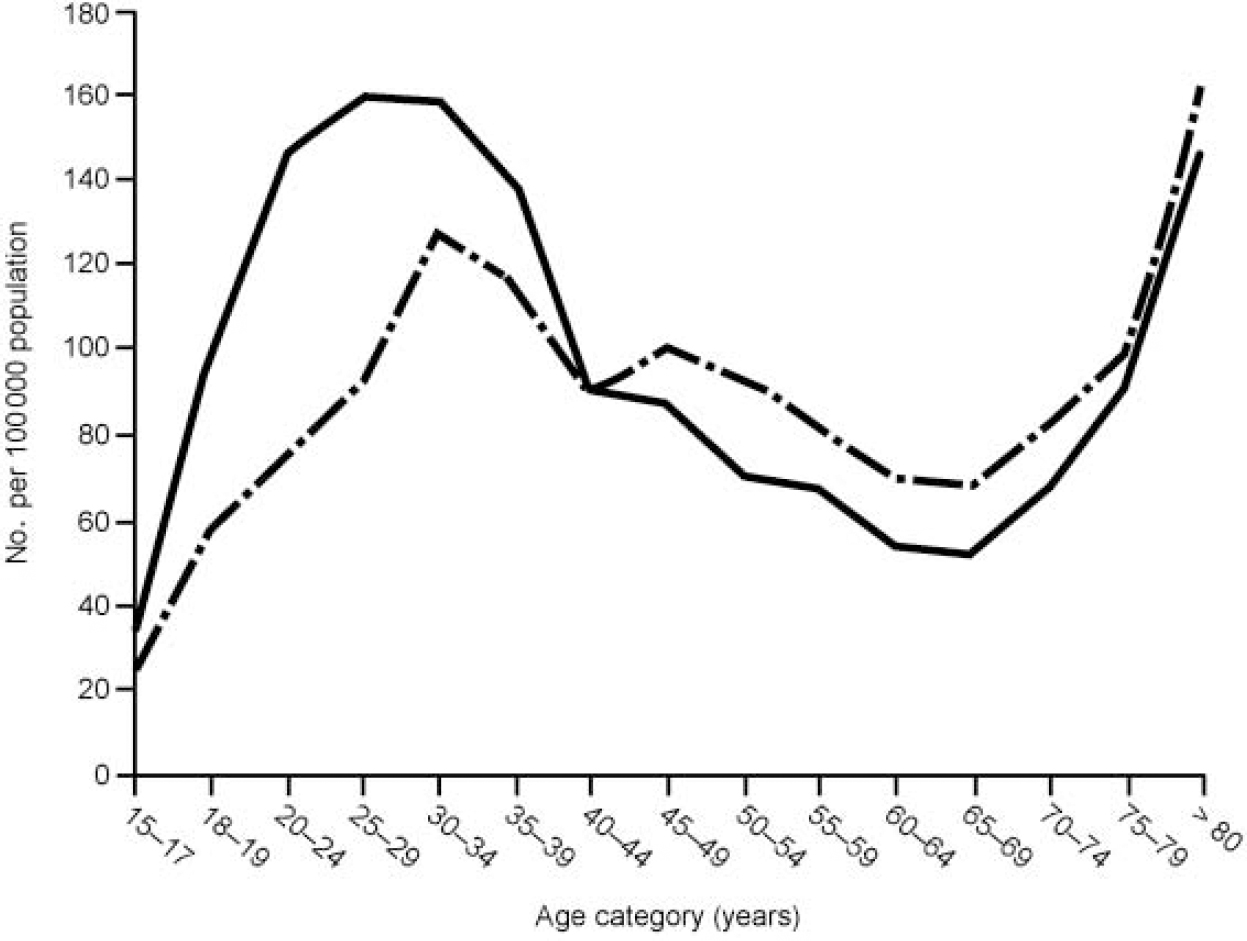
Fig. 2 Annual rates of detention under Part II of the Mental Health Act 1983 per 100 000 population standardised for gender and age group (solid line, men; broken line, women).
-
(a) The overall distribution by age group is now more clearly bimodal.
-
(b) The differential detention rates between men and women remain for the younger group but are much less apparent for the older groups. That is, the greater likelihood of older detainees being women is much less pronounced once the size of the base population is controlled for.
Ethnicity
When rates of sectioning are standardised as number per unit of ethnically specific population, there are striking differences between the ethnic groups. Detentions are over six times more likely to be of Black people than of White people (450 v. 68 per 100 000 population); the rate of detentions involving Asian people is 65% higher than those involving White people (112 per 100 000). The rate of detentions of people from other ethnic minority groups is intermediate between that for Asian people and Black people (324 per 100 000). Detentions of Black men are eight times more frequent than detentions of White men (553 v. 69 per 100 000). As Fig. 3 shows, the pattern of differences in rates of sectioning between ethnic groups is present at all ages. The census data permit age and ethnicity to be analysed only in broad age bands. Also, only a relatively small number of detentions (529) were of people from the ethnic groups assigned to the ‘Other’ category, with 54 detentions in those aged over 61 years.
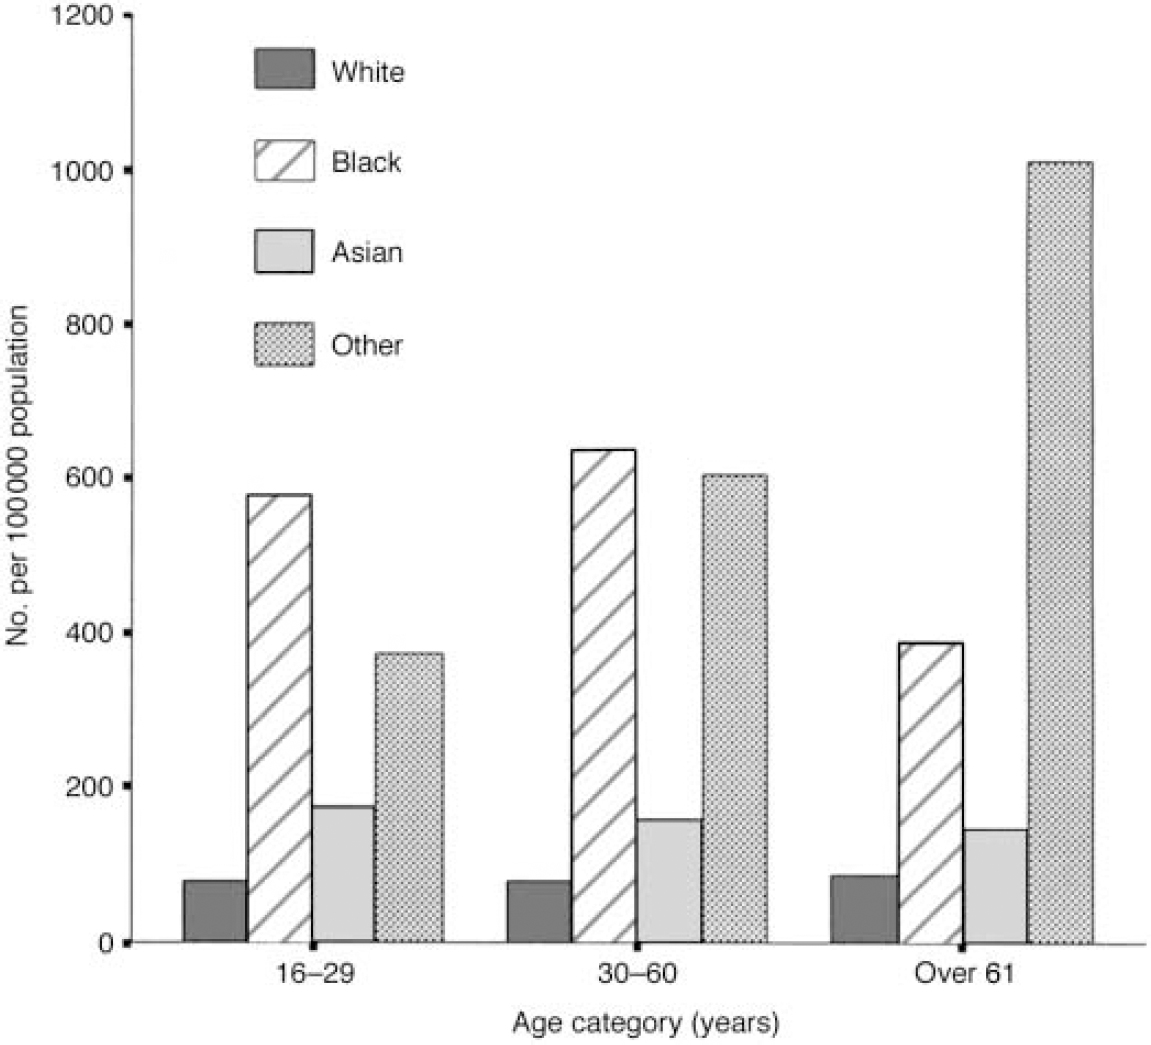
Fig. 3 Standardised annual rates of detention under Part II of the Mental Health Act 1983 for four ethnic groups by age bands.
Among the Black sub-population, detentions of men are more frequent than detentions of women (553 v. 353 per 100 000).
DISCUSSION
Limitations of the study
The study is opportunistic in that it uses data collected for a variety of other purposes. The sample of local authorities and trusts is self-selected on the sole basis that the organisations involved gathered good-quality data over number of years. The way in which sites were selected might have introduced bias in that those with good data collection systems might also have differed in how the Act was applied. Although the catchment areas of the sites were varied in terms of their levels of social deprivation and social demography, the most affluent areas were underrepresented. Given the relationship between social deprivation and need for mental health services (Reference Glover, Leese and McCroneGlover et al, 1999), the calculated rates of use of the Act are likely to be slightly higher than those that apply across the whole of England and Wales.
The data were collected about individual detentions under the Act and so provide a level of detail that central aggregated returns cannot. However, some limitations remain. Perhaps most important is the inability to link detentions over time. In the absence of a unique case identifier, it is not possible to identify individuals who were detained under the Act more than once during the data collection period, or those who were detained under one section of the Act and subsequently had their detention converted to another section. The latter would have been recorded as two separate detentions. One effect of this would be that subgroups of people who have high rates of repeated detention under the Act would be overrepresented in the sample.
The quality of the data was controlled by the local managers who were responsible for collecting it. On close examination, none of the local data-sets was found to be complete. The method for weighting for missing data was chosen because nearly all applications for admission under Sections 2, 3 and 4 of the Act are made by an approved social worker. When discussing the completeness of returns with local data managers, the research team found no reason to believe that the practice of social workers whose activity was not recorded differed markedly from those whose activity was recorded.
The data were collected over a period of 11 years. During this time, there have been changes in how ethnic and racial groups are categorised and assigned. Furthermore, a variety of systems for classifying ethnicity were used in different sites. Given that data were collected during the course of Mental Health Act assessments, it is likely that in most cases the assignment of ethnicity was made by the approved social worker rather than by the person concerned (Reference McKenzie and CrowcroftMcKenzie & Crowcroft, 1996). The final groupings are not consistent with current best practice; for example, people from South Asia are placed in the same category as people from East Asia. However, those groupings represent the best that can be made with the data available.
Even with these caveats, the study provides unique information about the use of the Act which could not be obtained from aggregate returns or from smaller studies of detentions from single, localised catchment populations (Reference McKenzie, van Os and FahyMcKenzie et al, 1995; Reference Davies, Thornicroft and LeeseDavies et al, 1996; Reference Wall, Churchill and HotopfWall et al, 1999).
Overrepresentation of Black and ethnic minority groups
The differences in rates of detention between ethnic groups in perhaps the most striking finding of this study. Previous studies have found that Black people admitted to a psychiatric hospital are about twice as likely to be detained under the Mental Health Act as White people (Reference Wall, Churchill and HotopfWall et al, 1999). African and African—Caribbean people who have a psychotic illness and who live in London are between four and eight times more likely to be detained than their White counterparts (Reference McKenzie, van Os and FahyMcKenzieet al, 1995; Reference Davies, Thornicroft and LeeseDavieset al, 1996). These studies, however, are of small, localised cohorts and do not relate rates of detention to the size of the base populations. When this is done, the difference appears to be towards the upper end of the ranges reported. The rate of use of Part II found in this study might be exaggerated by the underenumeration of Black people, and particularly young Black men, in the census. However, this effect is likely to be small, perhaps accounting for 5% of the difference (Office of Population Censuses and Surveys, 1993).
The possible causes of overrepresentation of Black people in the population of detained in-patients include a higher prevalence of severe mental illness, in particular schizophrenia; mistrust of services, leading to delay in seeking help and presentation at a later and more severe stage of illness; poorer compliance with medication; greater contact with police; a more frequent history of violence (Reference Wall, Churchill and HotopfWall et al, 1999); and differences in the way in which mental health care workers respond to people from different ethnic minority groups. The relative weight of the contribution of these factors is unknown.
Whatever the causes, mental health services whose catchment areas contain significant numbers of Black people must make provision both for higher numbers of formal admissions and to meet the specific needs of Black patients. The latter might include advocacy services and recruitment practices designed to ensure a corresponding ethnic mix among the staff.
Differences related to age and gender
In this sample, slightly fewer detentions under Part II were of men than of women (except for the Black sub-population, where more detentions were of men). This appears to contradict a recent review which concludes that men are more likely to be sectioned than women (Reference Wall, Churchill and HotopfWall et al, 1999). The explanation for this might be that many of the studies reviewed were based on samples drawn from general psychiatry and so would contain fewer older people, among whom women predominate. Our findings are consistent with the aggregated returns of the Department of Health which include all ages (Department of Health, 1999). These show that the balance between the genders has switched in recent years. Up to 1994-1995, more women than men were detained under Part II of the Act; after that time, slightly more men were detained (the ratio of men to women in 1988-1989 was 0.75; in 1998-1999 it was 1.02). The sample in our study spans this period.
This study confirms the gender and age differences in absolute numbers of detentions under Part II (Reference Hatfield, Mohamad and HuxleyHatfield & Mohamad, 1994). It shows that young men are more at risk of being detained than young women are. It suggests, however, that the excess of women among older people detained under Part II is largely accounted for by the fact that the population of older people contains more women — that is, it is due to the lower life expectancy of men.
Need for better monitoring of formal admissions
It is likely that within 5 years the Mental Health Act 1983 will have been replaced by new legislation. This study demonstrates the importance of also revising the way in which the use of mental health legislation is monitored. The effect of age, gender and ethnicity, and changes in these effects over time, can only be evaluated if data are collected at the case level. The introduction of the proposed new mental health minimum data-set would enable this (Reference GloverGlover, 1995).
Clinical Implications and Limitations
CLINICAL IMPLICATIONS
-
• Areas with a large population of Black people will have much higher rates of detention under Part II of the Mental Health Act.
-
• Mental health services whose catchment areas have a significant Black population should make special provision to meet the specific needs of Black people detained under the Mental Health Act.
-
• The way in which the use of mental health legislation is monitored should be revised to allow for data collection at the level of individual cases.
LIMITATIONS
-
• The sites in the sample were self-selected and might not have been representative of the national picture.
-
• The data-sets did not contain personal identifiers and so did not permit the identification of episodes of detention over time that related to the same person. Therefore, subgroups of people who are more at risk of repeated detention under the Act will be overrepresented.
-
• Information about ethnicity was categorised and collected in a variety of ways across the different data-sets.
Acknowledgements
The authors thank those who provided data-sets. In particular we are grateful to Barbara Hatfield, Director of Social Work Studies at the University of Manchester, who gave the north-west local authority data-set for use in this study. The study would not have been possible without her assistance in the early stages.


eLetters
No eLetters have been published for this article.