


There is now widespread recognition of the immense burden that depression imposes on individuals, communities and health services throughout the world. Latest estimates from the Global Burden of Disease study GBD 2000 indicate that unipolar depressive disorders account for 4.4% of the global disease burden (65 million disability adjusted life years (DALYs) lost in total), in the same range as the total burden attributable to ischaemic heart disease, diarrhoeal diseases, or the combined impact of asthma and chronic obstructive pulmonary disease (World Health Organization, 2002; Reference Üstün, Ayuso-Mateos and ChatterjiÜstün et al, 2004, this issue). What can be done to reduce this global burden, and at what cost? Although service access and treatment coverage remain low, there is growing empirical evidence from lower-income as well as higher-income countries for the effectiveness and also cost-effectiveness of a range of pharmacological and psychosocial interventions for treating and managing depression (e.g. Reference Chisholm, James and SekarChisholm et al, 2000; Reference Schoenbaum, Unutzer and SherbourneSchoenbaum et al, 2001; Reference Simon, Katon and Von KorffSimon et al, 2001; Reference Araya, Rojas and FritschAraya et al, 2003; Reference Patel, Chisholm and Rabe-HeskethPatel et al, 2003). Using these and other data relating to the epidemiological burden of depression, the clinical outcomes associated with different interventions and the economic costs of treatment, this analysis set out to inform mental health policy and planning through the provision of a population-level assessment of cost-effectiveness for different regions of the world.
METHOD
World Health Organization guidelines on sectoral cost-effectiveness analysis (WHO-CHOICE)
In the ongoing work programme WHO-CHOICE (CHOosing Interventions that are Cost Effective; Reference Tan Torres, Baltussen and AdamTan Torres et al, 2003), a consistent and ‘generalised’ approach to sectoral, population-level cost-effectiveness analysis is pursued, a key feature of which is the comparison of current and new interventions for a health condition to an epidemiological scenario of no intervention. The use of such a common starting point for analysis enhances the ability to compare cost-effectiveness analysis findings across a wide range of competing interventions for reducing leading contributors to disease burden (World Health Organization, 2002). WHO-CHOICE adopts a societal perspective to the valuation of costs and effects, and is intended to identify order-of-magnitude differences in the relative cost-effectiveness of (single and combined) health strategies, with a view to reducing existing inefficiencies as well as highlighting combinations of interventions that generate most health gain for available resources.
Setting
The 192 member states of the WHO were divided into five mortality strata on the basis of their levels of child and adult mortality (World Health Organization, 2002). When these mortality strata were applied to the six regions of the WHO, they gave rise to 14 epidemiologically defined subregions (Table 1). Costs and effects of key depression interventions were modelled at the level of the total population in these subregions, and are provided in a way that allows for contextualised analyses by country-level analysts.
Table 1 Prevalence of ICD—10 depressive episode (rates per 1000 population, by World Health Organization subregion)
| Region and subregion | Mortality | Gender | Total population (million) | Prevalence by age group | ||||||||
|---|---|---|---|---|---|---|---|---|---|---|---|---|
| Child | Adult | 0—4 | 5—14 | 15—29 | 30—44 | 45—59 | 60—69 | 70—79 | 80+ | |||
| Africa | ||||||||||||
| AfrD (e.g. Nigeria, Senegal) | High | High | Male | 147.1 | 0.0 | 11.0 | 13.1 | 21.2 | 20.0 | 16.1 | 6.5 | 4.9 |
| Female | 146.9 | 0.0 | 11.0 | 21.0 | 34.0 | 32.0 | 26.1 | 10.6 | 8.0 | |||
| AfrE (e.g. Botswana, Kenya) | High | Very high | Male | 171.6 | 0.0 | 11.0 | 13.1 | 21.2 | 20.0 | 16.1 | 6.5 | 4.9 |
| Female | 173.9 | 0.0 | 11.0 | 21.0 | 34.0 | 32.0 | 26.1 | 10.6 | 8.0 | |||
| The Americas | ||||||||||||
| AmrA (e.g. Canada, USA) | Very low | Very low | Male | 160.5 | 0.0 | 11.0 | 31.0 | 30.1 | 22.3 | 22.0 | 9.6 | 7.8 |
| Female | 164.7 | 0.0 | 11.0 | 60.2 | 46.5 | 37.8 | 35.3 | 14.3 | 10.9 | |||
| AmrB (e.g. Brazil, Mexico) | Low | Low | Male | 213.3 | 0.0 | 11.0 | 18.0 | 25.0 | 23.0 | 19.3 | 7.8 | 5.9 |
| Female | 217.6 | 0.0 | 11.0 | 32.0 | 43.0 | 40.0 | 33.0 | 13.4 | 10.1 | |||
| AmrD (e.g. Ecuador, Peru) | High | High | Male | 35.5 | 0.0 | 11.0 | 18.0 | 25.0 | 23.0 | 19.3 | 7.8 | 5.9 |
| Female | 35.8 | 0.0 | 11.0 | 32.0 | 43.0 | 40.0 | 33.0 | 13.4 | 10.1 | |||
| Eastern Mediterranean | ||||||||||||
| EmrB (e.g. Iran, Saudi Arabia) | Low | Low | Male | 72.2 | 0.0 | 11.0 | 16.0 | 30.0 | 28.0 | 23.0 | 9.0 | 7.1 |
| Female | 66.9 | 0.0 | 11.0 | 24.0 | 46.0 | 42.0 | 35.3 | 15.3 | 11.7 | |||
| EmrD (e.g. Egypt, Morocco) | High | High | Male | 174.3 | 0.0 | 11.0 | 16.0 | 30.0 | 28.0 | 23.0 | 9.0 | 7.1 |
| Female | 168.3 | 0.0 | 11.0 | 24.0 | 46.0 | 42.0 | 35.3 | 15.3 | 11.7 | |||
| Europe | ||||||||||||
| EurA (e.g. France, Norway) | Very low | Very low | Male | 201.5 | 0.0 | 11.0 | 19.3 | 19.2 | 17.8 | 14.7 | 6.0 | 4.6 |
| Female | 210.4 | 0.0 | 11.0 | 41.2 | 44.7 | 39.2 | 34.3 | 14.9 | 10.5 | |||
| EurB (e.g. Armenia, Poland) | Low | Low | Male | 108.2 | 0.0 | 11.0 | 19.0 | 21.2 | 23.2 | 17.0 | 7.1 | 5.4 |
| Female | 110.3 | 0.0 | 11.0 | 33.0 | 38.3 | 37.2 | 31.5 | 12.8 | 9.6 | |||
| EurC (e.g. Estonia, Russia) | Low | Low | Male | 114.1 | 0.0 | 11.0 | 18.0 | 19.5 | 17.8 | 14.0 | 7.0 | 4.5 |
| Female | 129.1 | 0.0 | 11.4 | 15.4 | 40.0 | 33.9 | 30.0 | 12.8 | 10.0 | |||
| South-East Asia | ||||||||||||
| SearB (e.g. Indonesia, Thailand) | Low | Low | Male | 147.2 | 0.0 | 11.0 | 15.0 | 18.0 | 16.0 | 13.0 | 5.6 | 4.2 |
| Female | 146.6 | 0.0 | 11.0 | 28.0 | 24.0 | 23.0 | 21.0 | 9.3 | 7.2 | |||
| SearD (e.g. India, Nepal) | High | High | Male | 639.1 | 0.0 | 11.0 | 21.0 | 24.0 | 23.0 | 18.4 | 7.5 | 5.7 |
| Female | 602.7 | 0.0 | 11.0 | 36.0 | 44.7 | 39.2 | 34.3 | 14.9 | 11.4 | |||
| Western Pacific | ||||||||||||
| WprA (e.g. Australia, Japan) | Very low | Very low | Male | 75.8 | 0.0 | 11.0 | 11.0 | 13.6 | 12.0 | 7.8 | 4.0 | 3.0 |
| Female | 78.6 | 0.0 | 11.0 | 15.0 | 19.6 | 17.0 | 15.0 | 6.0 | 5.0 | |||
| WprB (e.g. China, Vietnam) | Low | Low | Male | 785.1 | 0.0 | 11.0 | 18.9 | 19.0 | 24.0 | 18.5 | 7.5 | 5.6 |
| Female | 747.9 | 0.0 | 11.0 | 15.4 | 28.3 | 47.0 | 36.1 | 15.6 | 12.0 | |||
Population model for depression
Intervention effectiveness was determined through a state transition population model (PopMod; Reference Lauer, Murray and RoehrichLauer et al, 2003), which traces the development of a subregional population taking into account births, deaths and the disease in question. Susceptibles (i.e. persons not currently depressed) become cases at an instantaneous transition rate i (incidence, including recurrence); persons with a depressive episode go back to being susceptible at remission rate r; cases are subject to the instantaneous case-fatality rate f; and both susceptibles and cases are subject to a general mortality rate m. For all hazard rates, units are the number of events per year at risk. The model distinguishes male and female populations, each segmented into 1-year age groups. In addition, a disability weight or health state valuation is specified (on a 0–1 scale, where 1 equals full health) for time spent in the diseased state and also for time spent susceptible but not depressed.
The population model was run for two scenarios over a lifetime analytic horizon (100 years, by which time a ‘steady state’ or equilibrium has been reached), to give the total number of healthy years lived by the population. The first scenario was an epidemiological situation representing the natural history of depression (no depression interventions in place), and the second was an epidemiological situation reflecting the population-level impact of each specified intervention (such as reduced illness duration resulting from use of an antidepressant drug), implemented for a period of 10 years (thereafter, epidemiological rates and health state valuations move back to natural history values). The difference between these two simulations represents the population-level health gain (the DALYs averted) resulting from the implementation of the intervention over a 10-year period, relative to the situation of doing nothing. In line with the GBD 2000 study, DALYs averted per year were discounted (at 3%) and age-weighted in the base case analysis.
Natural history of ICD–10 depressive episode
Depression was modelled as an episodic disorder (ICD–10 code F32, 33; World Health Organization, 1992) with a high rate of remission (recovery) and subsequent recurrence, and with excess mortality from unnatural causes (suicide). Cases of dysthymia were excluded. Comorbidity was incorporated into the epidemiological estimates underlying the population model by adopting the strategy employed in the GBD 2000 study (Reference Üstün, Ayuso-Mateos and ChatterjiÜstün et al, 2004, this issue); namely, only counting the case in the condition with the more severe disability (depressive episode) and subtracting that case from the prevalence figure of the other conditions (most notably, anxiety disorders and substance misuse). Using GBD 2000 disability weights for different severity levels, the composite health state valuation (HSV) for an untreated depressive episode was calculated as a weighted average of 0.62, where 1 equates to full health, giving 23% severe, HSV=0.24; 47% moderate, HSV=0.65; and 30% mild, HSV=0.86.
Point prevalence and duration for depressive episodes in different subregions were drawn from GBD 2000, based on an extensive international review of epidemiological studies (Reference Üstün, Ayuso-Mateos and ChatterjiÜstün et al, 2004, this issue; see also Table 1). Incidence and remission rates were derived with reference to prevalence and duration as follows:
-
(a) adopting the GBD 2000 estimate of 6 months (0.5 years) as the mean duration of an untreated depressive episode, an instantaneous rate of incidence can be readily calculated as double the point prevalence estimate (i.e. there is a linear relationship between incidence, prevalence and duration);
-
(b) remission, by contrast, can be considered mathematically as the inverse of duration (as long as the case fatality rate is low), thereby resulting in an instantaneous (untreated) rate of remission of 2.0 (1/0.5 years).
Case fatality rates were based on a lifetime suicide risk for affective disorders of 6% among adults aged over 15 years (Reference Inskip, Harris and BarracloughInskip et al, 1998), with incident proportions subsequently converted into instantaneous rates. Because of a higher risk of mortality at younger ages, this rate was adjusted up to 9% for age groups between 15 and 45 years and reduced to 3% for age groups over 45 years. Consistent with a meta-analysis by Harris & Barraclough (Reference Harris and Barraclough1998), no excess risk of mortality from natural causes was attributed. Detailed tabulation of data sources and model inputs can be found for each subregion on the WHO-CHOICE website (http://www.who.int/evidence/cea).
Effectiveness of interventions
The expected population-level impacts of seven (self-standing or combined) primary-care-based interventions capable of being implemented in different regions of the world were assessed:
-
(a) older antidepressants: tricyclic antidepressants (TCAs, e.g. imipramine, amitriptyline);
-
(b) newer antidepressants: selective serotonin reuptake inhibitors (SSRIs, e.g. fluoxetine);
-
(c) brief psychotherapy: brief cognitive therapy or problem-solving treatment;
-
(d) older antidepressants plus brief psychotherapy;
-
(e) newer antidepressants plus brief psychotherapy;
-
(f) proactive collaborative care with older antidepressants;
-
(g) proactive collaborative care with newer antidepressants.
Episodic treatment regimens for antidepressant pharmacotherapy and brief psychotherapy (interventions a–e) followed guideline-level therapeutic dosages or number of sessions over the average duration of an untreated episode. Maintenance treatment for recurrent depression was incorporated into a proactive collaborative care strategy (interventions f and g), which pursues a multifaceted disease management protocol that seeks to increase conformity with evidence-based guidelines through patient education and enhanced primary care clinician support (Reference Katon, Von Korff and LinKaton et al, 2001; Reference Simon, Katon and Von KorffSimon et al, 2001).
The main modelled impact of intervention targeted at episodic treatment of a new depressive episode was a reduction in the duration of time depressed, equivalent to an increase in the remission rate (Table 2). Remission rates under treatment, ranging from 2.4–2.5 for psychotherapy to 2.7–2.8 for collaborative care, were based on pragmatic trials that reported the proportion of study subjects recovered at time intervals, which could be used to calculate a duration and converted into an instantaneous remission rate (Reference Solomon, Keller and LeonSolomon et al, 1997; Reference Thase, Greenhouse and FrankThase et al, 1997; Reference Malt, Robak and MadsbuMalt et al, 1999; Reference Chilvers, Dewey and FieldingChilvers et al, 2001; Reference Katon, Von Korff and LinKaton et al, 2001). Brief psychotherapy was modelled to have a slightly lower rate of remission than pharmacotherapy because the onset of effect is not as rapid for more severe depression (Reference Thase, Greenhouse and FrankThase et al, 1997). No difference was found for combined drug and psychosocial strategies using older v. newer antidepressants. Following recent studies that indicate larger treatment effect sizes for both single and combined interventions in developing countries (Reference Araya, Rojas and FritschAraya et al, 2003; Reference Bolton, Bass and NeugebauerBolton et al, 2003; Reference Patel, Chisholm and Rabe-HeskethPatel et al, 2003), a modest advantage in treated remission rates was ascribed to developing subregions. In addition, all interventions were attributed a moderate improvement in the disability level or health state valuation of an unremitted depressive episode (13–18%), resulting from increased proportions of cases moving from more to less severe health states (Table 2). Temporal symptom severity profiles for unremitted episodes were informed by a commissioned analysis of the ‘Pittsburgh 600’ data-set assembled from six research projects conducted between 1982 and 1992 (M. A. Dew, personal communication, 2001).
Table 2 Changes to model parameters as a result of intervention effects
| Model scenario | Parameter1 | Estimate (efficacy)2 | % Improvement (efficacy)3 | Coverage | Adherence | Partial response4 | Estimate (effectiveness)2 | % Improvement (effectiveness)3 |
|---|---|---|---|---|---|---|---|---|
| 0 Null (no intervention) | Health state valuation | 0.62 | ||||||
| Remission hazard rate | 2.00 | |||||||
| Incidence hazard rate5 | 2 × prevalence | |||||||
| (a) Pharmacotherapy: TCAs | Health state valuation | 0.70 | 12.9 | 50% | 60% | 20% | 0.65 | 4.5 |
| Remission hazard rate | 2.6—2.7 | 30—35 | 2.17—2.21 | 9.0—10.5 | ||||
| (b) Pharmacotherapy: SSRIs | Health state valuation | 0.705 | 13.7 | 50% | 63% | 20% | 0.65 | 5.0 |
| Remission hazard rate | 2.6—2.7 | 30—35 | 2.18—2.22 | 9.5—11.0 | ||||
| (c) Psychotherapy | Health state valuation | 0.71 | 14.5 | 50% | 70% | 20% | 0.66 | 5.8 |
| Remission hazard rate | 2.4—2.5 | 20—25 | 2.14—2.18 | 7.0—8.8 | ||||
| (d) TCA+psychotherapy | Health state valuation | 0.72 | 16.1 | 50% | 70% | 15% | 0.66 | 6.3 |
| Remission hazard rate | 2.6—2.7 | 30—35 | 2.21—2.25 | 10.5—12.3 | ||||
| (e) SSRI+psychotherapy | Health state valuation | 0.72 | 16.1 | 50% | 70% | 15% | 0.66 | 6.3 |
| Remission hazard rate | 2.6—2.7 | 30—35 | 2.21—2.25 | 10.5—12.3 | ||||
| (f) TCA+proactive care | Health state valuation | 0.73 | 17.7 | 0.67 | 7.3 | |||
| Remission hazard rate | 2.7—2.8 | 35—40 | 50% | 75% | 15% | 2.26—2.30 | 13.1—15.0 | |
| Incidence hazard rate5 | Incnull × 56% × 50% | 28.0 | 8.9 | |||||
| (g) SSRI+proactive care | Health state valuation | 0.73 | 17.7 | 0.67 | 7.3 | |||
| Remission hazard rate | 2.7—2.8 | 35—40 | 50% | 75% | 15% | 2.26—2.30 | 13.1—15.0 | |
| Incidence hazard rate5 | Incnull × 56% × 50% | 28.0 | 8.9 |
No intervention effect was attributed to the incidence of first episodes. However, for the estimated 56% of prevalent cases eligible for maintenance treatment (at least two lifetime episodes), the additional impact of efficacious maintenance treatment was incorporated into the proactive collaborative care strategies by reducing the incidence of recurrent episodes by 50% (i.e., an absolute risk reduction in recurrence of 0.50; Reference Geddes, Carney and FurukawaGeddes et al, 2003). None of the selected depression interventions was credited with resulting in a reduction in case fatality, owing to the lack of robust clinical evidence that antidepressants or psychotherapy per se alter the relative risk of death by suicide (Reference Storosum, van Zweiten and van den BrinkStorosum et al, 2001).
Estimates of efficacy obtained from clinical trials were adjusted to better reflect outcome in the real world, specifically with reference to treatment coverage, partial response and adherence (Table 2). Given the modest care-seeking and recognition rates observed in international studies of depression and other common mental disorders, a 50% target coverage rate was adopted for all subregions. Recent meta-analyses have reported adherence rates of 70% for TCAs and 73% for SSRIs (Reference Barbui, Hotopf and FreemantleBarbui et al, 2002), and higher rates still for cognitive therapy (Reference Gloaguen, Cottraux, Cucherat and BlackburnGloaguen et al, 1998), but these can be viewed as upper limits given the controlled research environment within which source studies were conducted. Accordingly, these adherence rates were adjusted downwards by a further ‘real world’ factor of 0.6–0.75 to give an overall level of adherence of between 45% and 55%.
Costs of interventions
Costs were considered at the patient level and the programme level. Programme-level costs included central administration and training, with an estimate of 2–3 days per trainee used for training primary care doctors and case managers in the management of depression, whereas 10 days of initial training (including role play) and 2 days of supervision per year were allocated for psychosocial treatments (Reference Dowrick, Casey and DalgardDowrick et al, 1998). Patient-level resource use profiles per 6-month treatment period were generated for each severity category of depressive episode, based on data from prospective studies (Reference Chisholm, James and SekarChisholm et al, 2000; Reference Katon, Von Korff and LinKaton et al, 2001; Reference Simon, Katon and Von KorffSimon et al, 2001; Reference Patel, Chisholm and Rabe-HeskethPatel et al, 2003) and also informed by a dedicated multi-country Delphi consensus study of resource use in developing countries (Reference Ferri, Chisholm and Van OmmerenFerri et al, 2004). Resource use components included, as applicable, drug dosage and frequency (e.g. 20 mg fluoxetine daily); brief psychotherapy (6–8 sessions); case management (4–6 contacts); primary care (3–6 visits); psychiatric out-patient care (33–66% of cases, 4–6 visits); and in-patient stays (5–15% of moderate–severe cases, 1–2 weeks). The severity-weighted estimate for each resource component was then multiplied by the subregion-specific unit cost of the service, to give a mean cost per treated episode.
Unit costs of primary and secondary care services were derived from an econometric analysis of a multinational data-set of hospital costs, using gross national income per capita (plus other explanatory variables) to predict unit costs in different WHO subregions (Reference Adam, Evans and MurrayAdam et al, 2003). For the costs of antidepressant medication, supplier prices for generically produced drugs (e.g. $0.01 per 25 mg amitriptyline or imipramine tablet, equivalent to $0.03–0.05 per daily dose) were obtained from the International Drug Price Indicator Guide for the year 2000 (http://erc.msh.org/dmpguide), with deviations from the baseline price for SSRIs assessed by sensitivity analysis (e.g. unit prices of $0.10 and $1.00 per 20 mg fluoxetine were considered alongside a baseline value of $0.25, reflecting expected variations in both the extent of government bulk purchasing for primary care providers and also the availability of generic, rather than branded, products).
Mean costs per episode were multiplied by the number of treated episodes in the subregional population (at a coverage rate of 50%), to give a total cost of care for 1 year of implementation. Fully worked resource profiles and cost templates for all interventions in each subregion can be found on the WHO-CHOICE website (http://www.who.int/evidence/cea/region/region). All baseline analysis costs for the 10-year implementation period were discounted at 3% and expressed in international dollars (I$), which adjust for differences in the relative price and purchasing power of countries and thereby facilitate interregional analysis. That is, I$1 buys the same quantity of health care resources in China or India as it does in the USA.
Uncertainty analyses
First, a series of one-way sensitivity analyses that assessed the impact on final cost-effectiveness analysis results of discounting and age-weighting were performed. Second, best- and worst-case scenarios incorporating upper and lower values for key drivers of cost (unit price of SSRI drugs and health care services, the proportion of individuals using secondary services) and treatment effectiveness (efficacy and adherence) were generated. Third, baseline data (with pessimistic and optimistic scenarios as lower and upper ranges) were entered into an analytical software package (MCLeague; Reference Tan Torres, Baltussen and AdamTan Torres et al, 2003), which performs a probabilistic uncertainty analysis using Monte Carlo simulation (2000 runs were made, using a truncated normal distribution).
RESULTS
Intervention effectiveness and averted burden of depression
Total population effects of different depression interventions are reported in Table 3. Proactive collaborative care strategies had the greatest impact on population health (close to double the number of DALYs averted by antidepressants or psychotherapy alone), on account of the additional benefits that come from avoiding a significant proportion of recurrent depressive episodes. Total population-level health gains can be expressed as a proportion of GBD 2000 depression burden for each subregion, which shows that, at a treatment coverage level of 50%, antidepressants and brief psychotherapy on their own (interventions a–c) could avert between 9% and 15% of the current burden, whereas combination strategies d and e could avert 11–18% and the proactive collaborative care strategies could avert 18–29% of DALYs attributed to depression. The health gain per treated episode, similar in concept to the ‘depression-free day’ (Reference Simon, Katon and Von KorffSimon et al, 2001), is also shown in Table 3, and demonstrates that single interventions (a–c) achieve between 18 and 23 disability-free or healthy days per treated episode, combined interventions (d and e) 23–28 days and proactive collaborative care strategies (f and g) 24–29 days. Although proactive care generates much greater total gain in the population, its individual effect is not appreciably different on account of the larger number of individuals receiving treatment.
Table 3 Population-level intervention effectiveness and averted burden of depression by World Health Organization subregion
| Africa | The Americas | Eastern Mediterranean | Europe | South-East Asia | Western Pacific | |||||||||
|---|---|---|---|---|---|---|---|---|---|---|---|---|---|---|
| AfrD | AfrE | AmrA | AmrB | AmrD | EmrB | EmrD | EurA | EurB | EurC | SearB | SearD | WprA | WprB | |
| Total population (million) | 294.1 | 345.5 | 325.2 | 430.9 | 71.2 | 139.1 | 342.6 | 411.9 | 218.5 | 243.2 | 293.8 | 1241.8 | 154.4 | 1532.9 |
| Current burden of depression | 1906 | 2154 | 5031 | 5589 | 867 | 1184 | 3507 | 4074 | 2548 | 2634 | 2832 | 17 123 | 1000 | 14 515 |
| (DALYs, 000)1 | ||||||||||||||
| Total population effect (DALYs averted per year) 2 | ||||||||||||||
| (a) Older antidepressants: TCAs | 243 409 | 268 381 | 503 869 | 564 188 | 87 249 | 173 568 | 406 517 | 503 574 | 260 119 | 239 342 | 257 055 | 1 619 708 | 95 459 | 1 759 925 |
| (b) Newer antidepressants: SSRIs | 256 912 | 283 377 | 534 199 | 595 157 | 92 059 | 183 250 | 429 377 | 533 238 | 275 660 | 253 735 | 271 535 | 1 709 838 | 10 1 234 | 1 859 678 |
| (c) Brief psychotherapy | 253 865 | 280 251 | 541 470 | 588 449 | 90 988 | 181 0 17 | 424 114 | 540 939 | 279 30 1 | 257 30 1 | 267 825 | 1 689 800 | 102 297 | 1 835 781 |
| (d) TCA+psychotherapy | 302 856 | 334 118 | 635 069 | 702 036 | 108 562 | 215 975 | 505 921 | 634 539 | 327 713 | 30 1 648 | 319 642 | 2 0 15 752 | 120 155 | 2 189 831 |
| (e) SSRI+psychotherapy | 302 856 | 334 118 | 635 069 | 702 036 | 108 562 | 215 975 | 505 921 | 634 539 | 327 713 | 30 1 648 | 319 642 | 2 0 15 752 | 120 155 | 2 189 831 |
| (f) TCA+proactive care | 477 102 | 525 494 | 1 031 234 | 1 105 894 | 171 151 | 340 530 | 797 291 | 1 029 952 | 532 555 | 489 20 1 | 502 500 | 3 175 356 | 195 202 | 3 447 334 |
| (g) SSRI+proactive care | 477 102 | 525 494 | 1 031 234 | 1 105 894 | 171 151 | 340 530 | 797 291 | 1 029 952 | 532 555 | 489 20 1 | 502 500 | 3 175 356 | 195 202 | 3 447 334 |
| % current burden of depression averted | ||||||||||||||
| (a) Older antidepressants: TCAs | 12.8% | 12.5% | 10.0% | 10.1% | 10.1% | 14.7% | 11.6% | 12.4% | 10.2% | 9.1% | 9.1% | 9.5% | 9.5% | 12.1% |
| (b) Newer antidepressants: SSRIs | 13.5% | 13.2% | 10.6% | 10.6% | 10.6% | 15.5% | 12.2% | 13.1% | 10.8% | 9.6% | 9.6% | 10.0% | 10.1% | 12.8% |
| (c) Brief psychotherapy | 13.3% | 13.0% | 10.8% | 10.5% | 10.5% | 15.3% | 12.1% | 13.3% | 11.0% | 9.8% | 9.5% | 9.9% | 10.2% | 12.6% |
| (d) TCA+psychotherapy | 15.9% | 15.5% | 12.6% | 12.6% | 12.5% | 18.2% | 14.4% | 15.6% | 12.9% | 11.5% | 11.3% | 11.8% | 12.0% | 15.1% |
| (e) SSRI+psychotherapy | 15.9% | 15.5% | 12.6% | 12.6% | 12.5% | 18.2% | 14.4% | 15.6% | 12.9% | 11.5% | 11.3% | 11.8% | 12.0% | 15.1% |
| (f) TCA+proactive care | 25.0% | 24.4% | 20.5% | 19.8% | 19.7% | 28.8% | 22.7% | 25.3% | 20.9% | 18.6% | 17.7% | 18.5% | 19.5% | 23.8% |
| (g) SSRI+proactive care | 25.0% | 24.4% | 20.5% | 19.8% | 19.7% | 28.8% | 22.7% | 25.3% | 20.9% | 18.6% | 17.7% | 18.5% | 19.5% | 23.8% |
| Health gain per treated episode (‘disability-free days’) 3 | ||||||||||||||
| (a) Older antidepressants: TCAs | 21.0 | 20.0 | 18.5 | 20.6 | 21.8 | 22.1 | 21.3 | 18.5 | 18.9 | 18.0 | 19.8 | 20.9 | 19.2 | 21.3 |
| (b) Newer antidepressants: SSRIs | 22.3 | 21.2 | 19.7 | 21.9 | 23.1 | 23.5 | 22.6 | 19.7 | 20.1 | 19.2 | 21.0 | 22.2 | 20.4 | 22.6 |
| (c) Brief psychotherapy | 22.1 | 21.1 | 20.2 | 21.7 | 23.0 | 23.3 | 22.4 | 20.1 | 20.6 | 19.6 | 20.8 | 22.0 | 20.8 | 22.5 |
| (d) TCA+psychotherapy | 26.3 | 25.0 | 23.4 | 25.8 | 27.2 | 27.7 | 26.6 | 23.4 | 23.9 | 22.7 | 24.7 | 26.1 | 24.2 | 26.6 |
| (e) SSRI+psychotherapy | 26.3 | 25.0 | 23.4 | 25.8 | 27.2 | 27.7 | 26.6 | 23.4 | 23.9 | 22.7 | 24.7 | 26.1 | 24.2 | 26.6 |
| (f) TCA+proactive care | 27.1 | 25.9 | 24.9 | 26.6 | 28.2 | 28.6 | 27.5 | 24.9 | 25.4 | 24.2 | 25.5 | 27.0 | 25.8 | 27.5 |
| (g) SSRI+proactive care | 27.1 | 25.9 | 24.9 | 26.6 | 28.2 | 28.6 | 27.5 | 24.9 | 25.4 | 24.2 | 25.5 | 27.0 | 25.8 | 27.5 |
Costs and cost-effectiveness of interventions
Patient-level costs per treated episode are shown in Table 4. As expected, there is considerable variation in the average cost of a treated episode, both between subregions and also between interventions. The lowest patient-level costs per treated episode relate to older antidepressants, ranging from I$50–80 in high-mortality developing subregions (AfrD, AfrE, AmrD, EmrD, SearD) to approximately I$400 in the most economically developed subregions (AmrA, EurA, WprA). At the other end of the cost spectrum, the average cost per treated episode for proactive collaborative care with newer generic antidepressants (intervention g) ranges from I$130–150 in high-mortality developing regions to I$700–750 in developed subregions. Programme-level costs accounted for only 1–10% of total costs, with the highest proportion applicable to brief psychotherapy because of more intensive training needs. Total intervention costs per year for each subregion are reported in Table 4, which illustrates further the wide variation in costs, as a function of both differential price levels and population size. The differential cost of care between pharmacological interventions with TCAs v. SSRIs is greater in lower-income regions than in industrialised subregions, a consequence of the relatively high price payable in low-income subregions for newer antidepressant drugs (to illustrate, one newer antidepressant tablet bought at a price of $1 would be equivalent to 25% of the cost of an out-patient visit in African subregions, compared with 2% in North America).
Table 4 Population-level costs and cost-effectiveness of depression interventions by World Health Organization subregion (costs shown in international dollars (1$) at 2000 rates)
| Africa | The Americas | Eastern Mediterranean | Europe | South-East Asia | Western Pacific | |||||||||
|---|---|---|---|---|---|---|---|---|---|---|---|---|---|---|
| AfrD | AfrE | AmrA | AmrB | AmrD | EmrB | EmrD | EurA | EurB | EurC | SearB | SearD | WprA | WprB | |
| Gross national income per capita (1$) | 1381 | 1576 | 31 477 | 7833 | 3837 | 7870 | 2393 | 23 927 | 5873 | 6916 | 3915 | 1449 | 27 534 | 4186 |
| Patient-level cost per episode (1$) 1 | ||||||||||||||
| (a) Older antidepressants: TCAs | 54 | 55 | 459 | 135 | 82 | 87 | 63 | 391 | 103 | 117 | 83 | 53 | 424 | 86 |
| (b) Newer antidepressants: SSRIs | 88 | 88 | 493 | 169 | 116 | 121 | 97 | 425 | 137 | 151 | 117 | 87 | 458 | 120 |
| (c) Brief psychotherapy | 75 | 75 | 697 | 173 | 101 | 112 | 79 | 611 | 126 | 141 | 102 | 73 | 653 | 106 |
| (d) TCA+psychotherapy | 93 | 93 | 772 | 196 | 119 | 132 | 96 | 682 | 145 | 160 | 120 | 90 | 726 | 124 |
| (e) SSRI+psychotherapy | 130 | 130 | 809 | 234 | 156 | 169 | 133 | 719 | 182 | 197 | 157 | 128 | 763 | 161 |
| (f) TCA+proactive care | 92 | 92 | 731 | 176 | 108 | 122 | 89 | 656 | 128 | 140 | 109 | 88 | 693 | 112 |
| (g) SSRI+proactive care | 132 | 132 | 772 | 217 | 148 | 162 | 130 | 696 | 168 | 180 | 149 | 129 | 733 | 152 |
| Total population cost (1$m per year) 2 | ||||||||||||||
| (a) Older antidepressants: TCAs | 178 | 214 | 3555 | 1018 | 90 | 192 | 336 | 3207 | 409 | 469 | 300 | 1133 | 652 | 2092 |
| (b) Newer antidepressants: SSRIs | 284 | 337 | 3816 | 1271 | 127 | 264 | 513 | 3480 | 542 | 603 | 421 | 1844 | 702 | 2903 |
| (c) Brief psychotherapy | 253 | 299 | 5385 | 1307 | 111 | 249 | 442 | 4958 | 516 | 562 | 382 | 1539 | 988 | 2645 |
| (d) TCA+psychotherapy | 311 | 364 | 5977 | 1480 | 131 | 291 | 527 | 5555 | 586 | 643 | 445 | 1915 | 1106 | 3072 |
| (e) SSRI+psychotherapy | 428 | 501 | 6269 | 1760 | 172 | 372 | 724 | 5862 | 734 | 791 | 580 | 2697 | 1164 | 3975 |
| (f) TCA+proactive care | 594 | 687 | 11 278 | 2642 | 236 | 529 | 968 | 10 596 | 1028 | 1111 | 799 | 3721 | 2080 | 5480 |
| (g) SSRI+proactive care | 843 | 977 | 11 896 | 3241 | 323 | 700 | 1386 | 11 244 | 1341 | 1428 | 1088 | 5406 | 2199 | 7402 |
| Average CER (1$ per DALY) 3 | ||||||||||||||
| (a) Older antidepressants: TCAs | 733 | 799 | 7055 | 1805 | 1034 | 1108 | 827 | 6368 | 1574 | 1960 | 1165 | 700 | 6828 | 1189 |
| (b) Newer antidepressants: SSRIs | 1105 | 1188 | 7143 | 2136 | 1379 | 1443 | 1194 | 6526 | 1966 | 2376 | 1551 | 1078 | 6936 | 1561 |
| (c) Brief psychotherapy | 998 | 1067 | 9946 | 2220 | 1223 | 1378 | 1043 | 9165 | 1846 | 2186 | 1428 | 911 | 9661 | 1441 |
| (d) TCA+psychotherapy | 1026 | 1089 | 9411 | 2109 | 1208 | 1350 | 1042 | 8754 | 1789 | 2131 | 1392 | 950 | 9204 | 1403 |
| (e) SSRI+psychotherapy | 1414 | 1498 | 9871 | 2507 | 1582 | 1721 | 1432 | 9238 | 2240 | 2623 | 1816 | 1338 | 9687 | 1815 |
| (f) TCA+proactive care | 1244 | 1307 | 10 936 | 2389 | 1377 | 1553 | 1214 | 10 288 | 1929 | 2272 | 1590 | 1172 | 10 653 | 1590 |
| (g) SSRI+proactive care | 1767 | 1858 | 11 536 | 2931 | 1886 | 2056 | 1738 | 10 917 | 2519 | 2920 | 2164 | 1702 | 11 264 | 2147 |
| ICER (1$ per DALY) 4 | ||||||||||||||
| Older antidepressants=lowest CER | 733 | 799 | 7055 | 1805 | 1034 | 1108 | 827 | 6368 | 1574 | 1960 | 1165 | 700 | 6828 | 1189 |
| SSRIs v. TCAs (b v. a) | 7800 | 8152 | 8607 | 8165 | 7643 | 7461 | 7727 | 9216 | 8524 | 9299 | 8408 | 7888 | 8719 | 8135 |
| Psychotherapy v. TCAs (c v. a) | 7159 | 7145 | 48 690 | 11 885 | 5623 | 7670 | 6028 | 46 861 | 5536 | 5199 | 7690 | 5787 | 49 209 | 7289 |
| TCA+psychotherapy v. TCA only (d v. a) | 2224 | 2276 | 18 462 | 3353 | 1919 | 2339 | 1924 | 17 931 | 2616 | 2789 | 2324 | 1974 | 18 385 | 2279 |
| SSRI+psychotherapy v. TCAs only (e v. a) | 4202 | 4354 | 20 690 | 5382 | 3825 | 4231 | 3905 | 20 275 | 4804 | 5172 | 4489 | 3950 | 20 736 | 4380 |
| Proactive care+TCAs v. TCAs only (f v. a) | 1777 | 1838 | 14 644 | 2998 | 1734 | 2017 | 1616 | 14 038 | 2269 | 2571 | 2036 | 1664 | 14 314 | 2008 |
| Proactive care+SSRIs v. TCAs only (g v. a) | 2845 | 2965 | 15 817 | 4104 | 2772 | 3042 | 2687 | 15 268 | 3421 | 3839 | 3211 | 2746 | 15 509 | 3147 |
Relative to the natural history of depression, and before allowance for model uncertainty, the most cost-effective stand-alone intervention in all subregions was pharmacotherapy with older antidepressants (cost per DALY averted: I$700–1000 in high-mortality developing subregions AfrD, AfrE, AmrD, EmrD, SearD; I$1100–1800 in low-mortality developing regions AmrB, EmrB, SearB, WprB; and I$1600–1700 in developed subregions AmrA, EurA, EurB, EurC, WprA). Across the 14 subregions, newer antidepressants had an average cost-effectiveness ratio (CER) in the range I$1000–7000, which resulted in an incremental CER of I$7500–9000 for moving from older to newer antidepressants (Table 4). The incremental CER for psychotherapy alone v. older antidepressants was more variable (reflecting differences in psychotherapists’ salaries), ranging from I$6000–7000 in high-mortality developing subregions to nearly I$50 000 in developed subregions with very low rates of child and adult mortality. The most cost-effective combination strategy was proactive collaborative care with older antidepressants (incremental CER: I$1650–1850 in high-mortality developing subregions; I$2000–3000 in low-mortality developing subregions; I$2300–14 000 in developed subregions). In all subregions, the incremental CER of pharmacotherapy with older antidepressants – and with the exception of the lowest-income subregions, proactive collaborative care with older antidepressants too – was considerably less than average yearly income per capita, which is an international threshold value recently proposed for accepting an intervention as very cost-effective (Commission on Macroeconomics and Health, 2001).
Uncertainty analysis
Summary findings of a series of one- and multi-way sensitivity analyses are presented in Table 5. Substitution of the baseline discount rate of 3% with values of 0% and 6% altered total costs and average CERs for all interventions by 14% and – 11%, respectively. The removal of age-weighting had a more significant impact on results, reducing total health gain estimates by 16–25% across subregions (resulting in a corresponding increase of 19–34% in average CERs). Under the best-case scenario (see Table 5 for details), total costs were 30–50% lower and total effects 24–30% higher than base case results, thereby lowering the average cost per DALY averted by 50–60%. Results for the worst-case scenario were more extreme, with respective increases of 45–90% and 110–220% in the average cost and cost-effectiveness of interventions using older antidepressant drugs, and even larger changes for interventions with newer antidepressants because of the significantly higher drug price. To illustrate, the average CER for pharmacotherapy with SSRIs in the Western Pacific subregion WprB baseline value: I$1560) ranged from I$600 to I$7000. Under the best-case scenario, the rank order of cost-effectiveness was unchanged in all but the three high-income subregions (AmrA, EurA and WprA, where generic SSRIs become the most cost-effective strategy); under the worst-case scenario, the combined approach of TCAs plus proactive care became the single most cost-effective strategy in Eastern Europe (subregions EurB and EurC), but elsewhere the rank order was preserved.
Table 5 One-way and multi-way sensitivity analyses by World Health Organization subregions
| Sensitivity analysis | Parameter | Africa | The Americas | Eastern Mediterranean | Europe | South-East Asia | Western Pacific | ||||||||
|---|---|---|---|---|---|---|---|---|---|---|---|---|---|---|---|
| AfrD % | AfrE % | AmrA % | AmrB % | AmrD % | EmrB % | EmrD % | EurA % | EurB % | EurC % | SearB % | SearD % | WprA % | WprB % | ||
| 1 Costs not discounted | Total cost | 13 | 13 | 14 | 14 | 14 | 13 | 13 | 14 | 14 | 14 | 14 | 14 | 13 | 14 |
| Average CER | 13 | 13 | 14 | 14 | 14 | 13 | 13 | 14 | 14 | 14 | 14 | 14 | 13 | 14 | |
| 2 Costs discounted at 6% | Total cost | — 10 | — 10 | — 11 | — 11 | — 11 | — 11 | — 11 | — 11 | — 11 | — 11 | — 11 | — 11 | — 11 | — 11 |
| Average CER | — 10 | — 10 | — 11 | — 11 | — 11 | — 11 | — 11 | — 11 | — 11 | — 11 | — 11 | — 11 | — 11 | — 11 | |
| 3 Effects not age-weighted (but discounted at 3%) | Total effect | — 25 | — 25 | — 21 | — 23 | — 25 | — 24 | — 24 | — 18 | — 21 | — 18 | — 24 | — 24 | — 16 | — 19 |
| Average CER | 34 | 34 | 26 | 30 | 33 | 31 | 31 | 21 | 26 | 21 | 31 | 32 | 19 | 23 | |
| 4 Effects not age-weighted or discounted | Total effect | — 8 | — 9 | — 2 | — 5 | — 6 | — 5 | — 6 | 2 | — 3 | 0 | — 6 | — 6 | 3 | 0 |
| Average CER | 8 | 9 | 2 | 5 | 7 | 5 | 6 | — 1 | 3 | 0 | 6 | 7 | — 3 | 0 | |
| 5 Best-case scenario 1 | |||||||||||||||
| (a) Older antidepressants: TCAs | Average CER | — 46 | — 47 | — 51 | — 54 | — 54 | — 51 | — 52 | — 50 | — 55 | — 55 | — 54 | — 46 | — 50 | — 54 |
| (b) Newer antidepressants: SSRIs | Average CER | — 59 | — 59 | — 53 | — 59 | — 62 | — 59 | — 62 | — 52 | — 61 | — 61 | — 62 | — 61 | — 52 | — 61 |
| (c) Brief psychotherapy | Average CER | — 53 | — 53 | — 56 | — 58 | — 58 | — 56 | — 55 | — 55 | — 57 | — 59 | — 57 | — 76 | — 55 | — 57 |
| (d) TCA+psychotherapy | Average CER | — 48 | — 48 | — 53 | — 54 | — 53 | — 51 | — 51 | — 52 | — 53 | — 54 | — 53 | — 66 | — 52 | — 53 |
| (e) SSRI+psychotherapy | Average CER | — 57 | — 57 | — 54 | — 58 | — 60 | — 58 | — 59 | — 53 | — 59 | — 59 | — 59 | — 69 | — 53 | — 59 |
| (f) TCA+proactive care | Average CER | — 45 | — 45 | — 48 | — 50 | — 49 | — 48 | — 47 | — 48 | — 49 | — 50 | — 49 | — 69 | — 48 | — 49 |
| (g) SSRI+proactive care | Average CER | — 56 | — 56 | — 50 | — 56 | — 58 | — 56 | — 58 | — 50 | — 57 | — 57 | — 57 | — 74 | — 50 | — 57 |
| 6 Worst-case scenario 2 | |||||||||||||||
| (a) Older antidepressants: TCAs | Average CER | 166 | 173 | 210 | 223 | 215 | 203 | 201 | 199 | 227 | 231 | 217 | 176 | 203 | 217 |
| (b) Newer antidepressants: SSRIs | Average CER | 359 | 358 | 243 | 315 | 351 | 335 | 367 | 238 | 339 | 331 | 352 | 372 | 237 | 348 |
| (c) Brief psychotherapy | Average CER | 169 | 174 | 195 | 219 | 218 | 203 | 199 | 186 | 224 | 234 | 215 | 181 | 189 | 216 |
| (d) TCA+psychotherapy | Average CER | 137 | 141 | 165 | 184 | 178 | 167 | 162 | 157 | 188 | 195 | 177 | 145 | 160 | 179 |
| (e) SSRI+psychotherapy | Average CER | 286 | 288 | 189 | 264 | 299 | 279 | 304 | 185 | 287 | 287 | 295 | 303 | 185 | 293 |
| (f) TCA+proactive care | Average CER | 111 | 114 | 132 | 145 | 140 | 133 | 128 | 127 | 147 | 153 | 139 | 116 | 129 | 140 |
| (g) SSRI+proactive care | Average CER | 257 | 259 | 157 | 230 | 265 | 248 | 272 | 154 | 254 | 253 | 262 | 268 | 155 | 261 |
Finally, by entering costs and effectiveness data into a stochastic uncertainty framework, it is possible to assess the likelihood of each intervention being considered cost-effective at different levels of resource availability. Figure 1 provides a graphical display of these competing probabilities in the South-East Asian subregion SearD. In this subregion, pharmacotherapy with older antidepressants is the cost-effective choice when resources are very restricted (other interventions exceed the available budget), but at higher resource levels the probability is reduced as other single or combined interventions, including psychotherapy and proactive collaborative care, become candidates for inclusion (for example, proactive collaborative care with older antidepressants becomes most likely to be cost-effective once the level of resource availability is quadrupled). Similar in concept to cost-effectiveness accept ability curves, this approach to uncertainty analysis provides decision-makers with information on the most economically feasible strategies for reducing the current burden of depression over the short- and longer-term, while acknowledging the inherent imprecision underlying baseline results.
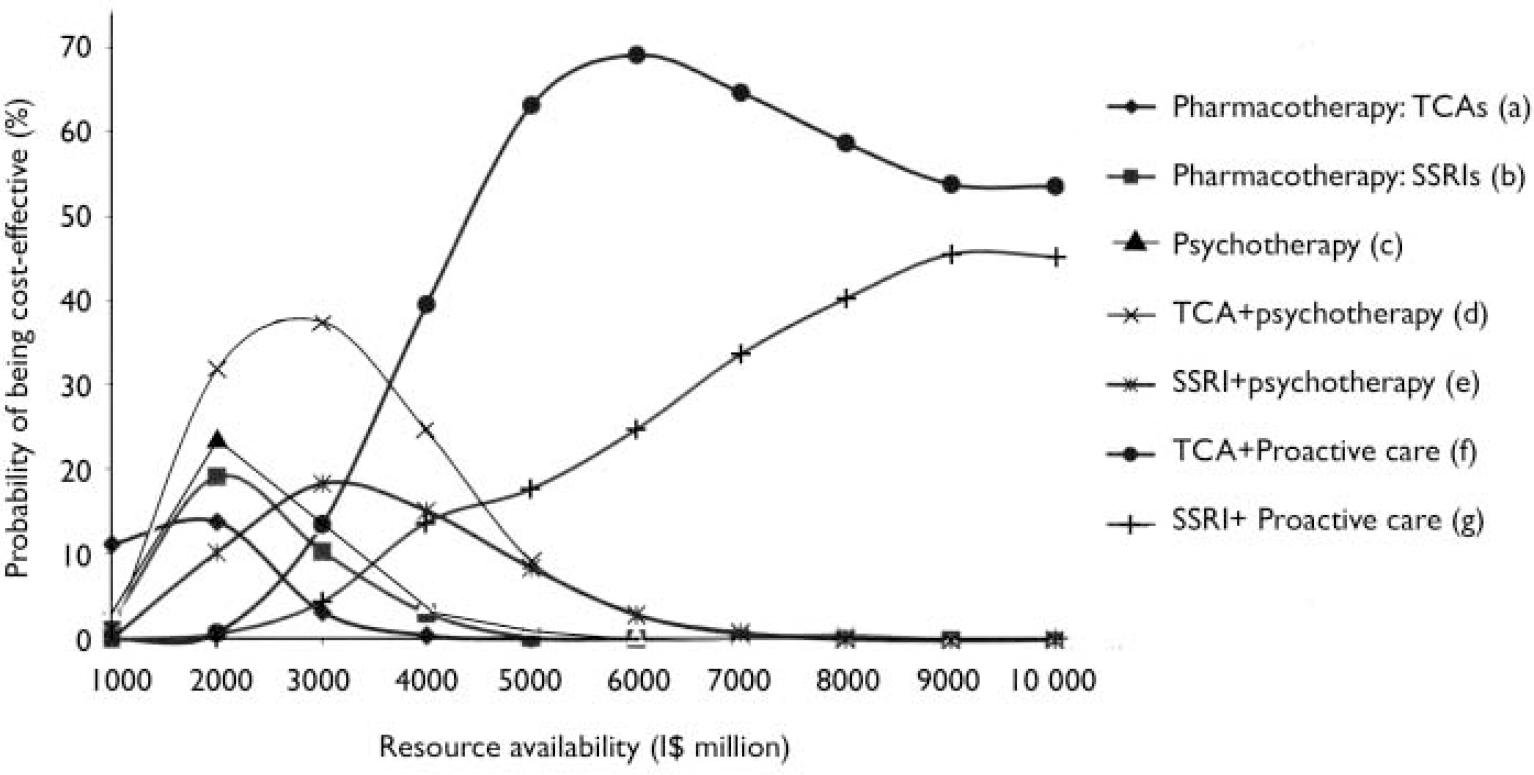
Fig. 1 Probabilistic uncertainty analysis of depression interventions for South-East Asian subregion SearD. I$, international dollars.
DISCUSSION
In light of the increasing international public health attention to the burden of depression, this study set out to examine the population-level cost-effectiveness of key health care strategies capable of reducing this burden in different subregions of the world. The purpose of such an exercise is to locate the broad, relative position of effective and applicable depression interventions within a wider cost-effectiveness and priority-setting framework in the health care sector.
Depression care and health sector efficiency
Using the criteria of the Commission for Macroeconomics and Health (2001), the results of this study indicate that implementation of efficient depression interventions in primary care settings would be very cost-effective (each DALY averted costs less than 1 year of average per capita income). These findings therefore provide relevant new information to health policy makers regarding the relatively good value of investing in depression treatment, and in so doing could help to remove one of many remaining barriers to a more appropriate public health response to the burden of common mental disorders.
Comparison of results with other cost-effectiveness analysis studies of depression that have employed population-level approaches to health measurement is limited, although one study of a quality improvement programme from North America (Reference Schoenbaum, Unutzer and SherbourneSchoenbaum et al, 2001) reported an incremental cost per quality-adjusted life year of $9500–36 000 for medication and psychotherapy regimens over usual primary care, which is in the same range as that given here for subregion AmrA. Estimated ‘depression-free days’ (18–28 additional days per 6-month treatment period compared with no treatment) were also in line with other studies that have used this metric. Simon et al (Reference Simon, Katon and Von Korff2001), for example, report an incremental gain of 12.6–16.7 depression-free days for collaborative care over usual primary care. When considered alongside the cost-effectiveness of other interventions evaluated by WHO-CHOICE to date, interventions for depression are in the same range as treatment strategies for reducing hypertension or cholesterol levels (World Health Organization, 2002), suggesting that evidence-based interventions for depression could have just as much a claim on scarce health resources as those for other chronic, non-communicable conditions that impose a significant burden on societies.
Reducing the global burden of depression
In terms of global effectiveness, evaluated interventions can potentially avert between 7 and 14 (out of 65) million DALYs, yet by expressing these health gains as a proportion of the current (and very largely untreated) burden of depression – ranging from 10% to 30% – it is evident that these technologies have a limited impact at the population level, even at a target coverage rate in excess of that prevailing now in most regions. A similar finding was reached in a recent analysis for Australia, where an estimated 22% of the burden of depression is currently being averted by specific treatment, and only 45% of the current burden would be avoided even at a 100% effective coverage rate (Reference Andrews, Sanderson and CorryAndrews et al, 2000). Over and above health system challenges such as increased access or coverage, there is therefore an evident need to increase the capability or efficacy of pharmacological and psychosocial treatments to resolve depressive symptoms promptly, as well as to avert their occurrence or recurrence through the development of effective community-based prevention and promotion strategies.
Interregional variation in the cost-effectiveness of interventions
A central debate in the health economics of depression concerns whether the higher acquisition costs of newer antidepressants are offset by greater compliance and reductions in use of health care and other services (Reference Barbui, Hotopf and FreemantleBarbui et al, 2002). The results from this analysis, in which a small advantage for SSRIs in terms of adherence and disability improvement was modelled, suggest that a cost-offset cost-offset hypothesis currently has limited pertinence in low-income subregions, since the higher acquisition price of generic SSRIs increases total costs of care substantially (if branded newer antidepressants were used, the costs would be far higher still). Consequently, the baseline incremental CER of I$7500–9000 for moving from older to newer antidepressants constitutes a relatively cost-ineffective use of resources in resource-poor subregions, whereas in the most industrialised subregions such a ratio could easily be justified on efficiency grounds. However, and as examined in the best-case scenario analysis, this situation can be expected to change as the price of generic SSRIs falls, as it has already done in countries such as India (the incremental CER for all subregions falls below I$2000).
By contrast, and not withstanding the severe current shortage of training, lower salaries make the use of brief evidence-based psychotherapy a potentially more attractive treatment alternative to older antidepressants in developing regions compared with high-income regions. Finally, there appear to be good grounds for thinking that proactive care strategies incorporating maintenance treatment offer a cost-effective option in all regions, as a significant reduction in the incidence of recurrent episodes (plus increased adherence) is achieved at a moderate additional cost (follow-up by a case manager).
Limitations of the population-based modelling approach
This analysis is constrained in a number of important respects. First, the use of epidemiological subregions as the unit of analysis is a compromise between a global level of aggregation and country-by-country assessment. Because policies are implemented by individual countries, there is a clear requirement to contextualise subregional estimates down to this level, in particular adjusting results for local variations in epidemiology, clinical effectiveness, service use patterns and unit costs. Such a process is now well under way in a number of countries as part of the WHO-CHOICE programme, results from which will provide an important test of the validity of the models used here. Second, the analysis did not confront the complex issue of comorbidity in depression, other than by including individuals for whom the co-occurring illness had a lower level of disability than the depression (e.g. anxiety disorders). Because treatment response might be slower in comorbid cases, as well as more costly to obtain, this is a potential source of overestimation of effectiveness and cost-effectiveness, which future revisions might be able to correct for as more knowledge on the costs and effects of treatments for comorbid depression becomes available.
Third, the population and costing models rest upon a series of best estimates, including the average duration of depressive episodes (plus related GBD 2000 parameters), expected patterns of resource use and, perhaps most importantly, estimates of intervention efficacy. Efficacy estimates were drawn mainly from trials undertaken in industrialised countries, although recent controlled trials from India, Uganda and Chile found treatment effects at least as large as studies carried out in the USA and UK for antidepressant therapy, group psychotherapy and proactive care respectively (Reference Araya, Rojas and FritschAraya et al, 2003; Reference Bolton, Bass and NeugebauerBolton et al, 2003; Reference Patel, Chisholm and Rabe-HeskethPatel et al, 2003). Uncertainty analyses can help in assessing the sensitivity and robustness of baseline estimates, and showed that whereas absolute values could deviate from base case findings by as much as half or more than double, the prevailing pattern or rank order of intervention cost-effectiveness was preserved in all low- and middle-income subregions. However, there clearly remain important questions around, for example, the transferability and cultural sensitivity of structured psychotherapies to regions as diverse as Africa, Asia and Latin America.
Finally, and despite the pursuit of a societal perspective, considerable challenges in the international measurement of productivity gains and of patient and informal carer time spent seeking or providing care have precluded their valuation in the present analysis (Reference Tan Torres, Baltussen and AdamTan Torres et al, 2003). Incorporation of these wider costs and consequences, however, would be expected only to enhance the cost-effectiveness of depression interventions (Reference Chisholm, James and SekarChisholm et al, 2000; Reference Patel, Chisholm and Rabe-HeskethPatel et al, 2003).
From economic evidence to mental health service development
Evidence for the comparative cost-effectiveness of interventions for depression provides only one input into the decision-making process. Mental health policy makers also need to address a series of issues beyond which interventions to choose purely from an efficiency perspective, most notably how to increase access to services of sufficient quality to ensure both the continuity of and adherence to these effective treatments. Moving from today's very modest level of effective treatment coverage to one that can make a significant impression on the existing burden of depression will require political commitment, public awareness campaigns and investment in health professionals working in primary and mental health care.
Clinical Implications and Limitations
CLINICAL IMPLICATIONS
-
▪ Primary-care-based depression interventions have the potential to reduce the current burden of depression by 10–30%.
-
▪ Proactive care strategies incorporating maintenance treatment for recurrent depression yield considerably greater population-level health gain than episodic treatments.
-
▪ On efficiency grounds alone, interventions using older antidepressants are currently more cost-effective than those using newer antidepressants, particularly in lower-income regions.
LIMITATIONS
-
▪ Estimates of depression treatment efficacy, mainly from industrialised countries, have been generalised to world regions without a robust empirical evidence base.
-
▪ Analysis was performed at the highly aggregated level of world subregions, whereas resource allocation decisions are ultimately made at the level of individual countries.
-
▪ The wider economic consequences of depression and its treatment, including lost work opportunities, were not measured.
Acknowledgements
The work was supported under WHO's Global Programme on Evidence for. Health Policy. The work of J.L.A.-M. was supported by the Spanish Fondo de. Investigacion Sanitaria (Contract No. 02/10069). We warmly acknowledge the. following colleagues, who have actively contributed to the conceptual and. methodological development of WHO-CHOICE: Taghreed Adam, Rob Baltussen, David. Evans, Raymond Hutubessy, Ben Johns, Jeremy Lauer, Christopher Murray and. Tessa Tan Torres. We also thank Gavin Andrews, Theo Vos and Mark van Ommeren. for comments on an earlier version of this paper. The views expressed are. those of the authors and not necessarily those of the organisations they. represent.


eLetters
No eLetters have been published for this article.