


Hippocampal structure and function are implicated in the neurobiology of depression. Especially in older subjects, depression is associated with hypercortisolaemia (Reference O'BrienO’Brien, 1997). At higher glucocorticoid levels the hippocampus down-regulates the hypothalamic–pituitary–adrenal (HPA) axis (Reference McEwen, De Kloet and RosteneMcEwen et al, 1986; Reference De Kloet, Vreugdenhil and OitzlDe Kloet et al, 1998). Hypercortisolaemia may damage hippocampal neurons, potentially disrupting HPA axis down-regulation: this is the glucocorticoid cascade hypothesis (Reference Sapolsky, Krey and McEwenSapolsky et al, 1986). The balance of evidence favours hippocampal volume loss in depression, with results variably showing bilateral (Sheline et al, Reference Sheline, Wang and Gado1996, Reference Sheline, Sanghavi and Mintun1999; Reference Steffens, Byrum and McQuoidSteffens et al, 2000), left unilateral (Reference Mervaala, Fohr and KononenMervaala et al, 2000) and right unilateral atrophy (Reference Bell-McGinty, Butters and MeltzerBell-McGinty et al, 2002). Reports of hippocampal atrophy correlating with depression duration support the glucocorticoid cascade hypothesis (Sheline et al, Reference Sheline, Wang and Gado1996, Reference Sheline, Sanghavi and Mintun1999). Other work suggests more atrophy with later illness onset, partly contradicting this (Reference Steffens, Byrum and McQuoidSteffens et al, 2000). A strong relationship exists between magnetic resonance imaging (MRI) hyperintensities, vascular disease and depression, therefore vascular pathology may underlie hyperintensities and may be of particular significance in late-onset depression (Reference O'Brien, Ames and SchweitzerO’Brien et al, 1996; Reference Salloway, Malloy and KohnSalloway et al, 1996; Reference Thomas, O'Brien and DavisThomas et al, 2002). We hypothesised that individuals with early-onset depression would have greater hippocampal atrophy than those with late-onset depression or controls and that MRI hyperintensity load would be greater in late- than in early-onset illness or controls.
METHOD
The study was approved by local research ethical committees in Newcastle and North Tyneside, Gateshead and Durham.
Study participants
Individuals with depression were recruited from old age and adult psychiatry in-patient and out-patient services. Informed consent was obtained. Healthy controls were recruited from among patients’ spouses, voluntary organisations and a list of individuals who had expressed an interest in research. All subjects were aged 60 years or over. The following assessment schedules were used: the Montgomery–Åsberg Depression Rating Scale (MADRS; Reference Montgomery and ÅsbergMontgomery & Åsberg, 1979), the Geriatric Depression Scale (GDS; Reference Yesavage, Brink and RoseYesavage et al, 1983), the National Adult Reading Test (NART; Reference NelsonNelson, 1982) and the Cambridge Cognitive Examination (CAMCOG; Reference Roth, Tym and MountjoyRoth et al, 1986) within which is the Mini-Mental State Examination (MMSE; Reference Folstein, Folstein and McHughFolstein et al, 1975). Social class was assessed using the UK Office of Population Censuses and Surveys (1991) definitions. All patients met the DSM–IV criteria for major depression (American Psychiatric Association, 1994) and scored at least 20 on the MADRS. Exclusion criteria applied to patients were: history or clinical evidence of cognitive impairment; score of <75 on CAMCOG; electroconvulsive therapy in the 3 months preceding assessment; evidence or any history of other psychiatric disorder, drug miuse or regular alcohol consumption above recommended maximum levels (more than 28 units/week for males and 21 units/week for females, as judged from screening history and review of notes); neurological disease; insulin-dependent diabetes; other serious physical illness or any medical condition likely to affect HPA axis function; sedative medication likely to affect cognitive function (low-dose benzodiazepines as a hypnotic only were allowed); and current or past use of steroids, with the exception of occasional brief courses for obstructive airways disease, at least 3 months prior to the study. Exclusion criteria for controls were identical, with the addition that the maximum allowable MADRS score was 8. Age of illness onset and lifetime duration of depression were determined by interview and inspection of hospital and general practitioner records. Early-onset illness was defined as having the first episode before age 60 years; late-onset illness was defined as having the first episode at age 60 years or above. Vascular risk factors were rated using the Framingham stroke risk scale (Reference Wolf, D'Agostino and BelangerWolf et al, 1991), those participants in the current study with ages above the range of the Framingham study being scored as though in the Framingham maximum age band.
Magnetic resonance imaging data
Data were acquired on a 1.0 Tesla Siemens Magnetom Impact/Expert MRI scanner (Siemens Medical Solutions, Siemans AG, Erlangen, Germany). The same experienced radiographer performed all scans with the use of standard head positioning. Axial pilot scans were used to optimise initial head position. Axial slices were aligned parallel to a plane joining the inferior-most portions of the genu and splenium of the corpus callosum – this approximates closely to the anterior commissure–posterior commissure line. The following were acquired: a sagittal three-dimensional magnetisation-prepared rapid acquisition gradient echo (3D-MPRAGE) turbo fast low angle shot whole-brain volumetric T1-weighted sequence (repetition time 11.4 ms, echo time 4.4 ms, inversion time 400 ms, time to delay 50 ms, flip angle 15°, field of view 256 mm, matrix 256×256, slice thickness 1 mm, no interslice gap) with truly isotropic voxels of side 1 mm; and rapid acquisition with relaxation enhancement technique fast-spin echo axial dual echo proton density and T2-weighted sequences (repetition time 2800 ms, echo time (proton density) 14 ms/(T2) 85 ms, field of view 230 mm, matrix 256×256, slice thickness 5 mm, interslice gap 0.5 mm) to give pixel size 0.92×0.92 mm and acquisition time 4 min 13 s.
Images were stored on optical disc and then transferred via digital magnetic tape to a Sun Ultra 10 workstation running Solaris 2.7 (Sun Microsystems, Mountain View, CA, USA). All volumetric image processing was carried out on the three-dimensional T1 data-set by the same operator (A.J.L.), masked to participant identity and diagnosis, using AnalyzeAVW-3.0 software (AnalyzeDirect.com, Lenexa, KS, USA). Image volumes were cropped to remove unwanted voxels, the inferior axial level being at the foramen magnum. Volumes were digitally reorientated to bring the long axis of the hippocampi into the axial plane. This reorientated file was used for all subsequent analyses. Reduced image intensity due to field inhomogeneity was observed only inferiorly in tissues of the neck and was not observed in the scan volume containing the brain. Tissue intensity ranges for cerebrospinal fluid, white matter and grey matter were defined for each subject by sampling multiple areas of each tissue remote from the boundary with any other tissue class, thereby excluding pixels of partial volume intensity at tissue boundaries.
An index of intracranial volume was calculated from the midsagittal area of the intracranial cavity and its maximum axial width. Whole brain volume was measured using a semi-automated iterative process of erosion and region-growing within Analyze-AVW. Ventricular volumes were measured to give an additional index of brain atrophy, including localised temporal lobe change, and were normalised for head size by dividing by the intracranial volume. Hippocampal volumes were normalised for brain size and any overall atrophic effect by dividing by the whole brain volume. Ventricular volumes were calculated by setting tissue thresholds as defined previously to expand a boundary from a seed placed in each area of ventricular cerebrospinal fluid on coronal slices. Limits were added manually as needed to separate lateral, third and temporal horn ventricular volumes. The hippocampus was measured on each side separately on coronal images with reference to standard neuroanatomical works (Reference Jackson and DuncanJackson & Duncan, 1996; Reference Talairach, Tournoux and RayportTalairach & Tournoux, 1998). The posterior limit on each side was the slice in which the fornix was visible in its longest length. The anterior limit was taken as the last slice in which the head of the hippocampus was visible according to a priori defined boundaries and/or by visualisation of a small, but distinct, bulge of the hippocampal head into the medial aspect of the temporal horn. Full definitions for hippocampal boundaries are given in a data supplement to the online version of this paper, and are available from the authors on request. Boundaries were traced manually with a mouse-driven cursor on interpolated, triple-sized images in the following order: lateral, inferior, medial, superior; starting at the posterior limit and moving through slices in a postero-anterior direction. The alveus was identifiable anteriorly in most participants. Hippocampal volume was calculated automatically as the sum of grey matter voxels of the areas defined. Intra-rater reliability (intraclass correlation coefficient, α) assessed on ten participants selected randomly and rated twice on separate occasions was excellent for all volumetric measures, reflecting the use of operationalised definitions of tissue intensity ranges for all tissues in each participant and minimal need for operator-dependent boundary-drawing for cerebrospinal fluid volumes (intracranial volume, α=0.98; brain volume, α=0.99; left hippocampus, α=0.97; right hippocampus, α=0.99; right lateral ventricle, α=1.0; left lateral ventricle, α=0.96; third ventricle, α =1.0; right temporal horn, α=1.0; left temporal horn, α =1.0).
White matter lesions were rated using the Scheltens rating scale (Reference Scheltens, Barkhof and LeysScheltens et al, 1993) on hard copies of dual echo (T2 and proton density) axial scans. This scale has been shown previously to have good inter- and intra-rater reliability (Reference Scheltens, Barkhof and LeysScheltens et al, 1993; Reference Kapeller, Barber and VermeulenKapeller et al, 2003). Two raters (R.B. and J.T.O’B.) independently scored each participant. Any differences in score were resolved by discussion and arrival at a consensus rating.
Statistical analysis
Analyses were conducted with SPSS for Windows, release 11. Normally distributed continuous variables were analysed with independent t-tests. One-way analysis of variance (ANOVA) was used for multiple comparisons, with the conservative post hoc Scheffe's test used when significant between-group differences were identified. Based on the Levene test, results are reported with modified values for t, d.f. and P as appropriate when variances were unequal. Non-normally distributed data were transformed using natural logarithms (ln) and square roots and re-examined for fit to the normal distribution. When non-normality persisted, non-parametric tests (Mann–Whitney U and Kruskall–Wallis with post hoc χ2 as appropriate) were used. Categorical data were compared with χ2 or, when the expected cell frequency fell below 5, Fisher's exact test. Correlations were assessed with Pearson's r or Spearman's r for parametric and non-parametric variables, respectively.
RESULTS
A total of 67 individuals with depression and 39 controls were recruited. Not all were willing or able to tolerate MRI scanning and data from one person with depression were distorted by movement artefact. Thus, all 39 controls and 51 of the individuals with depression (23 early-onset, 28 late-onset) were included. No significant difference was found on demographic, educational or mood rating factors between those included and those without useable MRI data within each participant group (P>0.15).
Demographic characteristics of participants are summarised in Table 1. The mean MADRS score for the whole depression group was 30.5 (s.d.=7.2) and for controls was 2.3 (s.d.=2.1). The GDS scores for depression and control groups were, respectively, 19.9 (s.d.=7.6) and 4.2 (s.d. =3.3). Neither of these ratings differed significantly between early-onset (MADRS, 29.7 (s.d.=8.1); GDS, 20.6 (s.d.=6.5)) and late-onset (MADRS, 31.2 (s.d.=6.3); GDS, 19.4 (s.d.=8.5)) depression. A significant difference in age at onset of depression was confirmed between the depression subgroups: early-onset, 38.7 years (95% CI 33.2–44.1), late-onset 72.0 years (95% CI 69.7–74.2), U=0.00, P<0.001. Differences were also found in the number of depressive episodes (early-onset, 5.1, 95% CI 3.7–6.6; late-onset, 2.0, 95% CI 1.4–2.5; U=78.0, P<0.001) and cumulative lifetime weeks depressed (untransformed means: early-onset, 88.3; late-onset, 24.3; ln-transformed means: early-onset, 4.3 (s.d.=0.7); late-onset, 2.8 (s.d.=0.9); t=6.33, d.f.=49, P<0.001). Early-onset and late-onset illness did not differ significantly with regard to DSM–IV diagnosis of melancholic depression (early-onset, 52%; late-onset, 64%) or history of previous electroconvulsive therapy (early-onset, 39%; late-onset, 21%). The presence of DSM–IV psychotic depression did not reach significance (early-onset, 4%; late-onset, 21%; Fisher's exact test: P=0.085). Participants with depression performed significantly less well than controls on the CAMCOG total score (depression mean of 88.6 (s.d.=7.9) and control mean of 96.8 (s.d.=4.8); t=6.10, d.f. 84, P<0.001) and memory sub-score (depression, 23.7 (s.d.=2.9); control, 26.7 (s.d.=1.9); t=5.85, d.f.=87, P<0.001). A similar relationship was found with MMSE (depression, 26.4 (s.d.=2.5); control, 26.7 (s.d.=1.9); t=2.80, d.f.=88, P=0.006). Significant between-group differences were observed on all three of these measures on comparing controls and the two depression sub-groups (CAMCOG total: F= 17.8, P<0.001; early-onset (mean=90.1, s.d.=7.5) <control, P=0.001; late-onset (mean=87.3, s.d.=8.2) <control, P<0.001; early-onset v. late-onset, no significant difference (NS); CAMCOG memory: F=16.3, P<0.001; early-onset (mean=24.2, s.d.=2.6) <control, P= 0.001; late-onset (mean=23.2, s.d.=3.2) <control, P<0.001; early-onset v. late-onset, NS; MMSE: F=5.49, P=0.006; late-onset (mean=27.7, s.d.=1.9) <control, P=0.006; early-onset v. control and early-onset v. late-onset, NS.)
Table 1 Demographic comparisons
| Control (n=39) | All depression (n=51) | Early-onset depression (n=23) | Late-onset depression (n=28) | |||
|---|---|---|---|---|---|---|
| Age | Range | 61–87 | 63–90 | 63–90 | 65–88 | All comparisons, NS |
| Mean | 73.1 | 74.0 | 72.7 | 75.1 | ||
| s.d. | 6.7 | 6.3 | 6.7 | 5.8 | ||
| NART IQ | Range | 81–127 | 84–124 | 84–121 | 87–124 | C> All, P=0.003 |
| Mean | 110.9 | 103.9 | 104.0 | 103.8 | C> LO, P=0.037 | |
| s.d. | 11.1 | 10.9 | 10.0 | 11.6 | C v. EO, NS | |
| LO v. EO, NS | ||||||
| Years education | Range | 6–16 | 1–17 | 4–16 | 7–17 | All comparisons, NS |
| Mean | 10.4 | 9.7 | 9.6 | 9.8 | ||
| 95% CI | 9.7–11.1 | 9.0–10.3 | 8.6–10.8 | 8.9–10.7 | ||
| Gender (M:F) | 10:29 | 10:41 | 1:22 | 9:19 | C v. All, NS | |
| C v. LO, NS | ||||||
| C> EO, P=0.042 | ||||||
| LO> EO, P=0.015 | ||||||
| Handedness (L:R) | 2:37 | 4:47 | 0:23 | 4:24 | All comparisons, NS |
Framingham scores for vascular risk factors did not differ in comparisons between any of the groups. Many age bands of both the control group and the participants with depression had Framingham scores above those of the original Framingham study. This was particularly so for women. Details are given in Table 2.
Table 2 Framingham risk scores by gender and age group: comparison of study participants and original Framingham results
| Age band (years) | Men | Women | ||||
|---|---|---|---|---|---|---|
| Framingham average score (%)1 | Control mean score (%) | Depression mean score (%) | Framingham average score (%)1 | Control mean score (%) | Depression mean score (%) | |
| 60–64 | 7.8 | – | – | 4.7 | 9.1 | 5.4 |
| 65–69 | 11.0 | 7.3 | 7.3 | 7.2 | 15.9 | 12.8 |
| 70–74 | 13.7 | 9.7 | 9.3 | 10.9 | 15.5 | 20.2 |
| 75–79 | 18.0 | – | 31.8 | 15.5 | 23.1 | 24.7 |
| 80–84 | 22.3 | 42.5 | 23.7 | 23.9 | 21.3 | – |
| 85–89 | – | – | – | – | – | 28.8 |
| 90–94 | – | – | – | – | – | 22.4 |
Volumetric analyses
Raw volumetric data are given in Table 3, detailing absolute values for reference. Male control participants had greater mean values than females for intracranial volume (male: 1468.4 cm3, s.d.=133.2; female: 1351.4 cm3, s.d.=99.0; t=2.94, d.f.=37, P=0.006). This comparison did not reach significance in participants with depression. Whole brain volume did not differ between genders. All subsequent statistical analyses refer to normalised volumes (as described in the Method section) rather than absolute values.
Table 3 Raw (non-normalised) volumetric data
| Region | Group1 | Range (cm3) | Mean | s.d. |
|---|---|---|---|---|
| Intracranial volume | Control | 1147.8-1720.6 | 1381.4 | 118.8 |
| All depression | 1198.3-1638.8 | 1373.2 | 98.7 | |
| Early-onset | 1198.3-1549.6 | 1355.2 | 83.3 | |
| Late-onset | 1241.9-1638.8 | 1388.0 | 109.0 | |
| Left lateral ventricle | Control | 1.3-49.2 | 11.0 | 9.2 |
| All depression | 2.3-37.3 | 13.2 | 8.5 | |
| Early-onset | 2.3-24.3 | 11.0 | 6.4 | |
| Late-onset | 3.9-37.3 | 15.0 | 9.6 | |
| Right lateral ventricle | Control | 1.9-37.5 | 9.8 | 7.3 |
| All depression | 2.3-39.0 | 12.2 | 8.3 | |
| Early-onset | 2.3-28.6 | 9.8 | 7.3 | |
| Late-onset | 3.4-39.0 | 14.1 | 8.6 | |
| Left temporal horn | Control | 0-0.9 | 0.1 | 0.2 |
| All depression | 0-0.4 | 0.3 | 0.6 | |
| Early-onset | 0-1.3 | 0.2 | 0.3 | |
| Late-onset | 0-3.6 | 0.3 | 0.5 | |
| Right temporal horn | Control | 0-0.8 | 0.1 | 0.2 |
| All depression | 0-2.4 | 0.3 | 0.4 | |
| Early-onset | 0-1.5 | 0.2 | 0.3 | |
| Late-onset | 0-2.4 | 0.3 | 0.5 | |
| Third ventricle | Control | 0.3-2.8 | 1.0 | 0.6 |
| All depression | 0.3-2.8 | 1.1 | 0.6 | |
| Early-onset | 0.3-2.1 | 1.0 | 0.4 | |
| Late-onset | 0.3-2.8 | 1.3 | 0.7 | |
| Whole brain | Control | 756.9-1161.3 | 968.9 | 82.9 |
| All depression | 766.3-1240.9 | 962.7 | 96.7 | |
| Early-onset | 846.2-1240.9 | 974.1 | 92.4 | |
| Late-onset | 766.3-1117.0 | 953.3 | 100.7 | |
| Left hippocampus | Control | 2.0-3.7 | 2.8 | 0.4 |
| All depression | 1.9-3.7 | 2.7 | 0.4 | |
| Early-onset | 2.2-3.7 | 2.9 | 0.4 | |
| Late-onset | 1.9-3.2 | 2.6 | 0.4 | |
| Right hippocampus | Control | 2.2-3.7 | 3.0 | 0.4 |
| All depression | 1.8-3.8 | 2.8 | 0.5 | |
| Early-onset | 2.3-3.8 | 3.0 | 0.4 | |
| Late-onset | 1.8-3.7 | 2.7 | 0.5 |
Normalised hippocampal volumes are expressed as 103× ratio of hippocampal volume to whole brain volume. Left/right asymmetry was not found in any group for normalised ventricular volume but was evident in hippocampal volumes, the right being greater than the left in all cases. (Control – left: 2.9, s.d.=0.3; right: 3.1, s.d.=0.3; t=-4.74; d.f.=38, P<0.001. All depression – left: 2.8, s.d.=0.3; right: 2.9, s.d.=0.4; t=-3.75, d.f.=50, P<0.001. Early-onset – left: 3.0, s.d.=0.3; right: 3.1, s.d.=0.4; t=-3.47, d.f.=22, P=0.002. Late-onset – left: 2.7, s.d.=0.3; right: 2.8, s.d.=0.4; t=-2.19, d.f.=27, P=0.037.) Within the control and depression groups there was no difference in normalised hippocampal volume on the basis of gender. (Control, left – males: 2.9, s.d.=0.2; females: 2.9, s.d.=0.4; t=0.42, d.f.=37, P=0.680. Control, right – males: 3.1, s.d.=0.3; females: 3.1, s.d.=0.4; t= -0.08, d.f.=37, P=0.940. Depression, left – males: 2.8, s.d.=0.4; females: 2.8, s.d.=0.3; t=-0.28, d.f.=49, P=0.783. Depression, right – males: 2.8, s.d.=0.4; females: 3.0, s.d.=0.4; t=-0.83, d.f.=49, P=0.409.)
Normalised ventricular volumes (ln-transformed) did not differ significantly between control participants (see Table 4) and the whole depression group (left temporal horn: 3.5, s.d.=1.8; right temporal horn: 3.7, s.d.=1.8; left lateral ventricle: 8.6, s.d.=0.6; right lateral ventricle: 8.5, s.d.=0.6; third ventricle: 6.2, s.d.=0.5). Comparison of control participants and early-onset and late-onset depression groups is given in Table 4, revealing a between-group difference in the right lateral ventricle volume that was shown to be significant between the control and late-onset depression groups. Individual normalised hippocampal data are illustrated in Fig. 1. Comparisons between groups are detailed in Table 4. Both the left and right hippocampal volumes were reduced by 7% (P=0.047) and 10% (P=0.003), respectively, in participants with late-onset depression compared with controls. The reduction in late-onset compared with early-onset depression was: left, 10% (P=0.013); right, 11% (P=0.011). Hippocampal volume did not differ significantly between individuals with early-onset depression and controls.
Table 4 Normalised hippocampal and ventricular volumes: control v. participants with early-onset (EO) v. late-onset (LO) depression

| Region | Control Mean (s.d.) | EO Mean (s.d.) | LO Mean (s.d.) | F | P | Post hoc Scheffé | P |
|---|---|---|---|---|---|---|---|
| Left hippocampus | 2.9 (0.3) | 3.0 (0.3) | 2.7 (0.3) | 5.23 | 0.007 | Control > LO | 0.047 |
| EO > LO | 0.013 | ||||||
| EO v. Control | NS | ||||||
| Right hippocampus | 3.1 (0.3) | 3.1 (0.4) | 2.8 (0.4) | 7.27 | 0.001 | Control > LO | 0.003 |
| EO > LO | 0.011 | ||||||
| EO v. Control | NS | ||||||
| In left temporal horn | 3.3 (1.3) | 3.1 (2.0) | 3.9 (1.6) | NS | |||
| In right temporal horn | 3.3 (1.4) | 3.3 (1.8) | 4.1 (1.8) | NS | |||
| In left lateral ventricle | 8.3 (0.7) | 8.4 (0.6) | 8.7 (0.6) | NS | |||
| In right lateral ventricle | 8.2 (0.7) | 8.3 (0.7) | 8.7 (0.6) | 3.94 | 0.023 | Control < LO | 0.037 |
| EO v. LO | NS | ||||||
| EO v. Control | NS | ||||||
| In third ventricle | 6.0 (0.6) | 6.1 (0.5) | 6.2 (0.5) | NS |
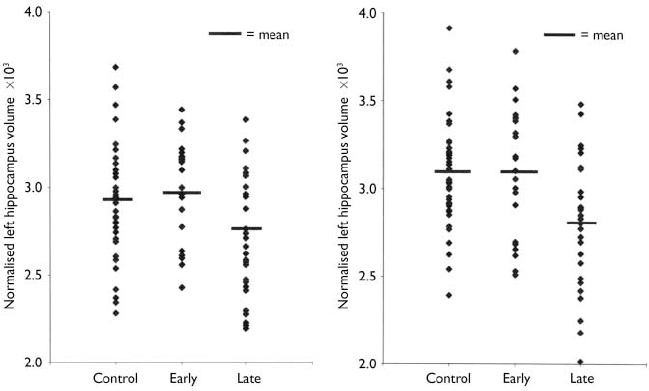
Fig. 1 Distribution of individual hippocampal data by participant group.
Hyperintensity ratings
No difference was found between any of the study groups with regard to total hyper-intensity load, total deep white matter lesion score or total periventricular lesion score. Specific regional comparisons of deep white matter lesion score for frontal lobes, thalami and basal ganglia similarly showed no differences (see Table 5).
Table 5 Hyperintensity ratings
| Region | Mean score (95% CI) | Control v. depression (Mann-Whitney) | Control v. EO v. LO (Kruskall-Wallis) | |||||
|---|---|---|---|---|---|---|---|---|
| Control | All depression | EO | LO | U | P | χ2 | P | |
| Total hyperintensities | 13.1 (9.7-16.5) | 13.5 (11.2-15.1) | 12.3 (9.4-15.2) | 13.9 (11.0-16.8) | 697.0 | 0.636 | 0.77 | 0.680 |
| DWML total | 6.8 (4.8-8.7) | 6.5 (5.4-7.7) | 5.8 (4.3-7.3) | 7.2 (5.3-9.0) | 774.0 | 0.923 | 1.04 | 0.594 |
| PVL total | 2.9 (2.4-3.5) | 3.4 (2.9-3.9) | 3.2 (2.5-3.1) | 3.6 (2.9-4.2) | 672.0 | 0.188 | 2.80 | 0.246 |
| Basal ganglia total | 2.0 (1.2-2.9) | 2.5 (1.8-3.3) | 2.3 (1.2-3.4) | 2.7 (1.7-3.8) | 671.0 | 0.266 | 2.15 | 0.342 |
| Infratentorial total | 0.7 (0.3-1.2) | 0.7 (0.4-1.0) | 1.0 (0.5-1.5) | 0.4 (0.1-0.7) | 775.0 | 0.851 | 2.89 | 0.236 |
| Frontal lobes | 2.5 (1.9-3.0) | 2.7 (2.3-3.1) | 2.5 (1.8-3.1) | 3.0 (2.4-3.5) | 719.5 | 0.379 | 2.59 | 0.274 |
| Thalami | 0 | 0.4 (0.1-0.6) | 0.5 (0.03-1.0) | 0.2 (-0.1-0.6) | 737.0 | 0.213 | 4.33 | 0.115 |
| Pons | 0.6 (0.1-1.0) | 0.4 (0.2-0.8) | 0.6 (0.2-1.1) | 0.3 (0.1-0.5) | 785.0 | 0.783 | 0.64 | 0.725 |
Correlations
The significance level for correlations was set at P=0.01. Age correlated significantly with the following variables:
-
(a) whole brain volume in control participants (r=-0.38, P=0.003);
-
(b) total ventricular volume in all groups (control: r=0.46, P=0.003; all depression: r=0.59, P<0.001; early-onset: r=0.60, P=0.003; late-onset: r=0.54, P=0.003);
-
(c) total (left plus right) normalised hippocampal volume in the whole depression group only (r=-0.37, P=0.007);
-
(d) total CAMCOG score in all participants with depression only (r=-0.38, P=0.006);
-
(e) Framingham score in all except the early-onset group, in which a trend in the same direction was noted (control: r=0.58, P=0.001; all depression: r=0.53, P<0.001; early-onset: r=0.46, P=0.039; late-onset: r=0.56, P=0.007).
The cumulative duration of depression did not correlate with hippocampal measures, whereas age at onset of illness correlated negatively with hippocampal volume (r=-0.41, P=0.003) (see Fig. 2). Partial correlation covarying for age in this relationship gave r=-0.33 (P=0.018). An initial negative correlation of ln-transformed Framingham score with hippocampal volume in the depression group (r=-0.41, P=0.008) was lost once age was controlled for (r=-0.23, P=0.145). These two variables showed no significant correlation in control participants. The CAMCOG memory and total scores did not correlate with hippocampal volume either in individuals with depression or in control participants. Framingham risk score did not correlate with hyperintensity load in any group, nor did the CAMCOG total score.
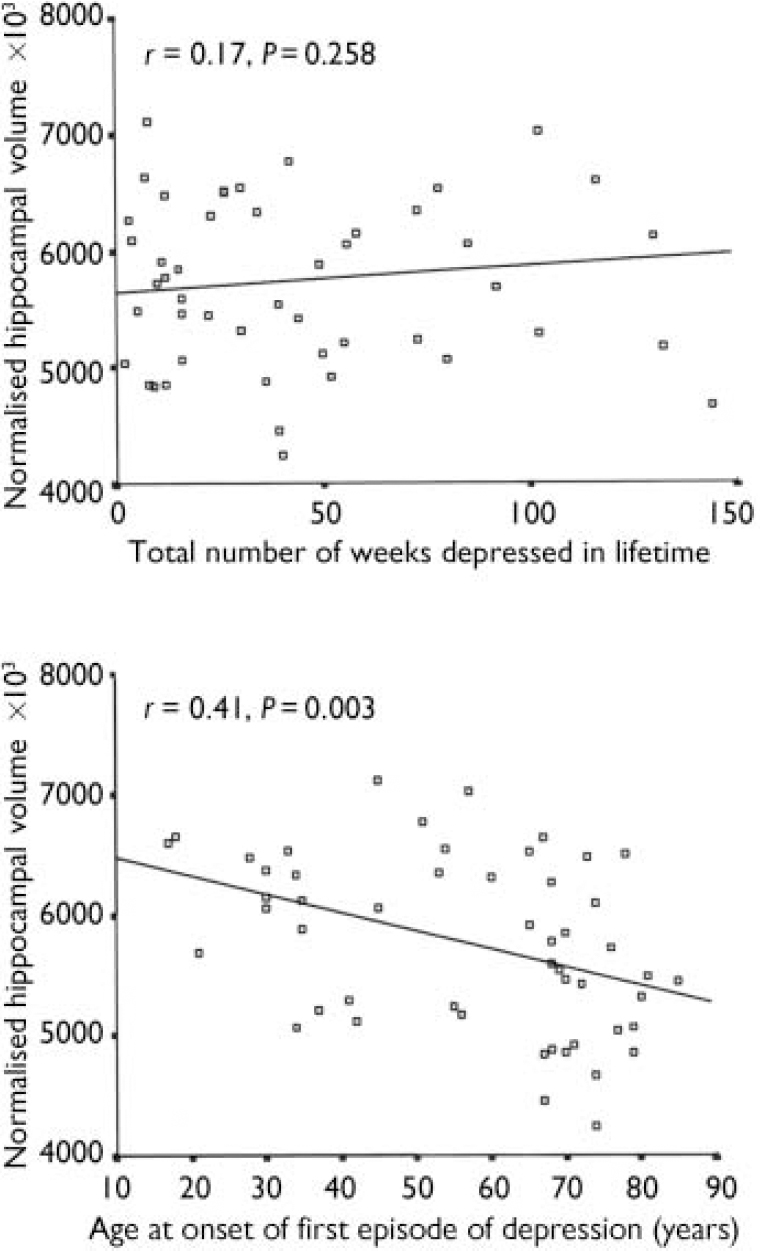
Fig. 2 Correlation of total (left plus right) normalised hippocampal volume with lifetime duration of depression and age at illness onset.
DISCUSSION
The principal findings of this study were of bilateral hippocampal atrophy in late-onset illness compared with both controls and early-onset illness. Control and early-onset hippocampal volumes did not differ. Although no significant relationship was detected between hippocampal volume and cumulative lifetime duration of depression, a negative correlation that remained a very strong trend after correction for age was found with age at onset of depression. Groups did not differ in terms of MRI hyperintensity ratings.
These results were at variance with the expected finding of greater hippocampal atrophy in subjects with early-onset illness. Groups were generally well-matched in terms of demographic factors although the early-onset group had only one male out of 23 subjects. We are unable to define a reason for this gender mismatch other than chance. Because there was no gender effect on the measures of normalised hippocampal volume, it is unlikely that this confounded the findings. The reduction in NART score in the whole depression and late-onset groups compared with controls is difficult to ascribe causally to depression and was not matched by any difference in years of education. No significant differences were found in vascular risk (Framingham scores) between groups, which is at odds with previous work identifying clear links between vascular risk factors and depression (Reference Everson, Roberts and GoldbergEverson et al, 1998).
Methodological issues
High-resolution imaging and operationalised definitions of tissue intensity ranges minimised the degree of error due to partial volume effects and inter-subject intensity differences in MRI data. The finding of close matching between groups on both vascular risk factors and MRI hyperintensities, although unexpected, adds strength to the hippocampal volumetric findings, which are unlikely to be accounted for by the effects of generalised cerebrovascular change. Calculation of lifetime duration of depression was retrospective and thus may have included a degree of inaccuracy, but this was minimised by the use of interview combined with examination of available medical records. The majority of participants were taking medication, the main difference between those with and without depression being the use of antidepressants (but with sedative tricyclic medications an exclusion criterion) with their inherent potential for hypotension. The absence of evidence for excess vascular change (hyperintensities) in participants with depression would argue against this being of significance in this study.
Volumetric findings
Greater ventricular volumes in males compared with females is consistent with previous work in late life, as is the negative correlation of whole brain volume with age in controls. Larger right than left hippocampal volume, as in this study, fits with the majority of previous findings (Reference Sheline, Wang and GadoSheline et al, 1996). Although the hypothesised reduction in hippocampal volume in depression is sustained, the finding of greater atrophy in late-onset than in early-onset depression and the robust lack of any significant difference between participants with early-onset depression and controls was precisely the opposite of that expected on the basis of the glucocorticoid cascade hypothesis. This finding contrasts with negative results in other work that dichotomised subjects by age at illness onset (Reference Steffens, Byrum and McQuoidSteffens et al, 2000) and begins to argue against the hypothesis of more prolonged exposure to depression (and thus hypercortisolaemia) leading to greater hippocampal atrophy. This finding cannot be accounted for by group demographic differences and, although the NART score differed between depression and control groups, it did not differ between early-onset and late-onset depression groups. It is therefore unlikely that the IQ rating results from or is causative in this finding.
The contrasting gender mix of the early-onset and late-onset groups does not explain this difference because hippocampal volumes were normalised to brain volume to account for gender differences in both premorbid head/brain size and rate of atrophy with ageing. In contrast to work by Sheline et al (Reference Sheline, Wang and Gado1996, Reference Sheline, Sanghavi and Mintun1999), we found no correlation between cumulative duration of depression and hippocampal volume. The most important difference between that study and the current work is the female-only sample and the wider age range (23–86 years) in Sheline et al's studies. Thus, the latter work included a whole subset of subjects less affected by ageing. There has been no direct replication of Sheline et al's results, although some indirect support comes from a negative correlation described between time since onset of depression and hippocampal volume (Reference Bell-McGinty, Butters and MeltzerBell-McGinty et al, 2002). Axelson et al (Reference Axelson, Doraiswamy and McDonald1993) found a negative but statistically non-significant correlation of depression duration and amygdalo-hippocampal complex volume but also described a negative correlation with age at onset of illness when the posterior part (mostly hippocampus) of this structure was considered. Steffens et al (Reference Steffens, Byrum and McQuoid2000) described a strong trend towards negative correlation between age at onset and hippocampal volume that agrees with our findings of a correlation in the same direction between these variables. Along with the finding of reduced hippocampal volume in late-onset rather than early-onset depression, this further strengthens the argument against the glucocorticoid cascade hypothesis as the primary mechanism underlying hippocampal damage in this group of individuals. Cortisol data were collected on some of these people but also on others who did not have MRI and will be reported elsewhere (Reference O'Brien, Lloyd and McKeithO’Brien et al, 2004).
Brain hyperintensities
The lack of difference between any of the study groups with respect to hyperintense lesions is surprising, given the large body of evidence supporting increased lesion load in depression (Reference O'Brien, Ames and SchweitzerO’Brien et al, 1996; Reference Salloway, Malloy and KohnSalloway et al, 1996). Higher levels of vascular risk factors in both participants with depression and controls in the current study than in previous similar work and in the Framingham study may have been a confounding factor. Also, the number of participants is around the minimum required for such studies to be adequately powered and therefore type II error cannot be excluded. These results thus should not be taken as strong evidence against findings to the contrary of previous work.
Potential mechanisms of hippocampal atrophy
In addition to the cumulative effect of exposure to cortisol alone, as proposed by the glucocorticoid cascade hypothesis, an additional factor may enhance vulnerability to such damage in late life. Dehydroepiandrosterone (DHEA) has an antiglucocorticoid action (Reference Kalimi, Shafagoj and LoriaKalimi et al, 1994). The cortisol:DHEA concentration ratio across years of the lifespan is a U-shaped curve, representing periods of potentially enhanced vulnerability to glucocorticoid neuronal damage towards the extremes of the age spectrum (Reference Yen and LaughlinYen & Laughlin, 1998). A relatively high cortisol:DHEA ratio in the first years of life may be needed for successful brain maturation but in old age this results in a prolonged period of susceptibility to dendritic and neuronal loss. An increased cortisol:DHEA ratio has been described recently in depression (Reference Young, Gallagher and PorterYoung et al, 2002) in a younger group, thus the normal increase in this ratio in late life may be exaggerated in individuals with depression. This does not, however, offer explanation as to the differential hippocampal volume between age-matched participants with late-onset and early-onset illness as found in this study. What mechanisms, then, could account for reduced hippocampal volume in people with late-onset depression when the glucocorticoid cascade indicates that those with early-onset illness should suffer the greatest hippocampal neuronal damage?
-
(a) A factor other than hypercortisolaemia and of increased prevalence in late-onset depression may damage the hippocampus. Candidates for such a role are vascular damage, genetic factors and (with or without a genetic component) other forms of degenerative brain disease. Although not directly supporting vascular pathology, the current study does not directly contradict other work, indicating its likely role. Alzheimer's disease has a predilection to cause hippocampal volume loss and it is suggested that late-onset depression may herald, or be an early symptom of, Alzheimer's disease before clinically significant cognitive deficit is apparent (Reference Jorm, van Duijn and ChandraJorm et al, 1991). Potential mechanisms underlying such hippocampal damage include the effects of oxidative stress, calcium metabolism and glutamatergic excitotoxicity (Reference SapolskySapolsky, 2000). Whatever the precise pathology, the contrast in hippocampal volume reduction between participants with early-onset and late-onset depression compared with controls suggests that individuals with late-onset depression have more acquired degenerative pathology underlying their illness than do those with early-onset depression.
-
(b) Both hippocampal atrophy and hyper-cortisolaemia may be epiphenomena of a third process and have no direct relationship to one another. To date, no likely candidate has been identified to support this.
-
(c) Each phenomenon may arise from a separate pathology and be coincidental rather than being related to depression. The extensive background evidence of their association with depression argues strongly against this.
Overall effects of vulnerability to damage from cortisol and the first of the three potential mechanisms proposed above thus appear to be the more likely candidates and need not be mutually exclusive. Indeed, it is perhaps the interaction of increased vulner-ability to damage with acquired biological factors that is key in the genesis of depression of onset late in life, and in the associated hippocampal volume loss observed in these individuals. Our results do not indicate a significant difference in basic cognitive function between the early-onset and late-onset depression groups, thus we do not have evidence of dementing processes in these individuals. However, the CAM-COG and MMSE may not be sufficiently sensitive to reveal subtle, early differences. Longitudinal follow-up, therefore, will be required to confirm whether or not the late-onset group contains a disproportionate number of people destined to develop dementia, their depression being an early manifestation of this, as discussed above.
It thus appears that individuals with late-onset illness have factors operating that override the glucocorticoid cascade mechanism that is supported in studies including younger adults (Sheline et al, Reference Sheline, Wang and Gado1996, Reference Sheline, Sanghavi and Mintun1999). Some important questions are raised. Is the hippocampal atrophy in late-onset illness consequent not only upon the presence of elevated cortisol in depression but also on the reduced protective factor of DHEA at the time of illness onset? Do the findings as described represent undeclared Alzheimer's disease presenting initially with depressive symptomatology? Are mechanisms such as oxidative stress implicated in depression of late onset? Although volumetric imaging can define hippocampal atrophy in late-life depression, it does not indicate the nature of this (dendritic, neuronal or glial changes) and recent neuropathological and neurochemical evidence in humans has indicated only limited neuronal loss in the hippocampus consequent upon depression (Reference Lucassen, Muller and HolsboerLucassen et al, 2001).
In order to address these issues there is a need for studies to follow subjects longitudinally with regard to imaging, neuroendocrine and neuropsychological function and, if possible, ultimately neuropathological investigation.
Clinical Implications and Limitations
CLINICAL IMPLICATIONS
-
▪ Aetiologies underlying early- and late-onset depression may differ.
-
▪ The changes underlying subtle cognitive deficits (e.g. memory dysfunction) in depression may vary according to subgroup, hippocampal atrophy being found only in the late-onset subjects.
-
▪ Factors enhancing neuroprotection may become relevant to the management of depression, especially with onset late in life.
LIMITATIONS
-
▪ Retrospective estimation of lifetime duration of depression is imperfect in terms of accuracy.
-
▪ It is not possible to draw clear conclusions from the hyperintensity ratings in this study.
-
▪ Depressed subjects were not drug free.
Acknowledgements
The authors thank Elizabeth McGuckin and Nicola Barnett for help with. subject recruitment and data handling and Philip English for skilled. radiographic assistance.


eLetters
No eLetters have been published for this article.