


Genes, childhood adversity and life events in adulthood contribute to the development of mood disorders, possibly via effects on hypothalamic–pituitary–adrenal (HPA) axis function. This is supported by the finding that healthy probands with a family history of mood disorder show abnormalities on the dexamethasone/corticotrophin-releasing hormone (dex/CRH) test (Reference Holsboer, Lauer and SchreiberHolsboer et al, 1995). However, although the response to the dex/CRH test is abnormal in symptomatic patients with bipolar disorder it has not been shown consistently to normalise with symptom resolution (Reference Schmider, Lammers and GotthardtSchmider et al, 1995; Reference Rybakowski and TwardowskaRybakowski & Twardowska, 1999), suggesting that it may not simply be an epiphenomenon of illness. To test this further, we examined HPA axis function in 53 patients with bipolar disorder, including 27 who fulfilled stringent prospective criteria for remission, and in a further 28 healthy comparison participants. We hypothesised that if HPA axis dysfunction is a trait abnormality, it would be present in both remitted and non-remitted patients.
METHOD
Study participants
Fifty-three patients (age range 23–62 years) with bipolar disorder were recruited from out-patient clinics in secondary and tertiary care in the north-east of England. Diagnosis, illness characteristics, clinical ratings and medication history were determined by trained psychiatrists using the Structured Clinical Interview for DSM–IV (SCID; Reference First, Spitzer and GibbonFirst et al, 1997), case note and medication review and standardised rating scales.
Patients in remission were rated prospectively over 4 weeks and defined as remitted if they satisfied the criteria of the Newcastle Euthymia Protocol (Reference Thompson, Ferrier and HughesThompson et al, 2000). Briefly, these criteria consist of a SCID diagnosis of bipolar disorder in full remission, with a 21-item Hamilton Rating Scale for Depression (HRSD; Reference HamiltonHamilton, 1960) score of ≤7 and a Young Mania Rating Scale (YMRS; Reference Young, Biggs and ZieglerYoung et al, 1978) score ≤7 both at baseline and when repeated 4 weeks later. Additionally, scores on self-rating scales, including the Beck Depression Inventory (BDI; Reference Beck, Ward and MendelsonBeck et al, 1961) and the Altman Mania Rating Scale (AMRS; Reference Altman, Hedeker and PetersonAltman et al, 1997), completed at weekly intervals throughout the assessment period are required to remain unchanged from baseline. The time spent in clinically defined remission was also determined. The non-remitted patients who satisfied the SCID diagnostic criteria for bipolar disorder current episode depressive were classified as depressed.
Twenty-eight control participants (age range 24–60 years) were recruited. They were confirmed as healthy by medical examination and by the SCID to be free of neurological or psychiatric disorder. No control participant gave a history of having a first-degree relative with psychiatric disorder. Both patients and controls were excluded if they had a neurological or medical condition, if they were taking corticosteroids or antihypertensive medication or had a history of substance or alcohol misuse. Gender, age and menstrual status have been reported previously to have an impact on HPA axis function (Reference Viau and MeaneyViau & Meaney, 1991; Reference Seeman, Singer and WilkinsonSeeman et al, 2001). The groups were therefore carefully matched for age (F[1,78]=0.2; P=0.63), gender (χ2 = 0.64; d.f.=1; P=0.43) and menstrual and menopausal status (χ2=3.2; d.f.=3; P=0.36) and the impact of these variables on the neuroendocrine output was determined. The Joint Newcastle and North Tyneside Ethics Committee approved the study. All participants gave written informed consent.
Neuroendocrine testing
The dex/CRH test was performed following the protocol previously used in studies of major depressive disorder (Reference Heuser, Yassouridis and HolsboerHeuser et al, 1994). Participants took 1.5 mg dexamethasone orally at 23.00 h on the evening before neuroendocrine testing. They attended the research unit on the morning of the test day and had a light lunch at noon, following which they were canulated in the antecubital fossa at 13.00 h. Participants then fasted, remained semi-supine and did not sleep. Human CRH (Ufelfingen, Switzerland) 100 μg was administered over 30 s via the canula at 15.00 h. Blood was taken serially for measurement of cortisol levels at 15-minute intervals until 17.00 h. The dexamethasone suppression test (DST) response was determined by the 15.00 h (pre-CRH) cortisol level. Participants lightly chewed a citricacid-impregnated cotton-wool salivette (Sarstedt, UK) at 08.00, 12.00, 16.00 and 20.00 h on the day prior to neuroendocrine testing to allow assessment of both basal cortisol secretion and diurnal variation (Reference Kirschbaum and HellhammerKirschbaum & Hellhammer, 1994). Participants were permitted to smoke as usual throughout the procedure to reduce any effects of nicotine withdrawal.
Biochemical measures
Blood was collected in ethylenediamine-tetracetic acid and centrifuged at 1000 g for 10 min to prepare plasma, which was removed and immediately frozen at -20 °C until assayed. Dexamethasone was assayed at Emory University, Georgia, using a method described previously (Reference Ritchie, Belkin and KrishnanRitchie et al, 1990). In this laboratory, the 80%, 50% and 20% binding points averaged to 0.07, 0.33 and 1.46 ng/ml, respectively. At a level of 0.52 ng/ml, the inter-assay coefficient of variation was 8% and the intra-assay coefficient of variation was 4%. Cortisol was determined using corti-cote radioimmunoassay kits (ICN Pharmaceuticals, California, USA). The sensitivity of the plasma cortisol assay was 1.9 nmol/l. The inter-assay and intra-assay coefficients of variation for the low (107.7 nmol/l), medium (25.1 nmol/l) and high (51.1 nmol/l) quality controls were 5.9%, 7.8%, 9.6% and 7.7%, 6.6%, 9.4%, respectively.
Saliva collected using the salivette system was extracted from the cotton-wool swab by centrifugation and stored at -20 °C until analysis. Samples were analysed for cortisol using radioimmunoassay. The sensitivity of the saliva cortisol assay was 0.08 nmol/l at 98% binding and the inter-assay and intra-assay coefficients of variation for the low (8.6 nmol/l), medium (31.5 nmol/l) and high (87.5 nmol/l) quality controls were 17.2%, 10.3%, 9.6% and 25.8%, 16.3%, 9.1%, respectively.
Effect of treatments
Dexamethasone clearance is increased in patients receiving drugs, including carbamazepine, which induces the main enzyme involved in dexamethasone clearance, CYP3A4, potentially producing false-positive DST results. Medication may also exert effects on cortisol output that are independent of dexamethasone metabolism. We therefore also examined the effect of carbamazepine levels and other medications on dexamethasone and cortisol output.
Statistical analysis
For statistical analysis we used SPSS for Windows, version 9. Data were first examined to see whether they fulfilled the assumptions for parametric statistical analyses. If violations of these assumptions occurred, data were logarithmically transformed (to base ten). If this failed to satisfy assumptions, the data were analysed non-parametrically. Basal cortisol was logarithmically transformed to normalise the distribution and compared between groups using repeated-measures ANOVA, with the four time points as the within-subject variable. The mean and 95% confidence interval (CI) of mean basal cortisol levels were calculated. All other data were analysed non-parametrically. Kruskal–Wallis one-way ANOVA on ranks was utilised to determine group differences when comparing more than two groups. Non-parametric data are reported as median and 95% CI of the median. When comparing two groups, the median difference (Reference Campbell, Gardner, Altman, Machin and BryantCampbell & Gardner, 2000) and Mann–Whitney U-test were used.
Correlations were carried out using Spearman's rank coefficient (r s). Categorical variables were analysed using χ2 tests. The 15.00 h (immediately pre-CRH) plasma cortisol was used for analysis of the DST. Delta cortisol (the difference between the peak cortisol response to the dex/CRH test and the 15.00 h cortisol plasma concentration) was used for analysis of the dex/CRH response. To investigate whether the results differ between patients and controls, receiver operating characteristic curves were plotted for basal cortisol area under the curve, 15.00 h plasma cortisol and delta cortisol. The area under the receiver operating characteristic curve and the 95% CI were determined using the Wilcoxon estimate. All cortisol levels are presented as nmol/l and plasma dexamethasone levels as pmol/l. Based on the effect size seen in the most recent study comparing patients with symptomatic and asymptomatic bipolar disorder (Reference Schmider, Lammers and GotthardtSchmider et al, 1995), the principal comparisons of remitted with non-remitted patients and remitted with depressed patients had a power of >99% at the 0.05 level of significance. Because carbamazepine had such a profound effect on dexamethasone metabolism, post hoc analysis was performed after exclusion of patients taking carbamazepine.
Dexamethasone levels
Earlier studies have demonstrated that there is marked variability in serum dexamethasone levels during the DST and that the rate of dexamethasone metabolism and hence dexamethasone levels are a significant determinant of DST response (Reference Morris, Carr and GillilandMorris et al, 1986; Reference Lowy and MeltzerLowy & Meltzer, 1987; Reference Stokes, Sikes and LasleyStokes et al, 2002a ). There is a middle range of dexamethasone values below which individuals tend to escape from DST suppression and above which they tend to suppress (Reference Ritchie, Belkin and KrishnanRitchie et al, 1990). It has been suggested, therefore, that the DST may not be valid in people whose dexamethasone levels fall outside this window and these individuals should be excluded from analysis (Reference Morris, Carr and GillilandMorris et al, 1986; Reference Lowy and MeltzerLowy & Meltzer, 1987; Reference Stokes, Sikes and LasleyStokes et al, 2002a ). However, it has been argued that enhanced metabolism of dexamethasone is a component of affective illness and may be secondary to hepatic enzyme induction in hypercortisolaemic subjects (Reference Holsboer, Wiedemann and BollHolsboer et al, 1986; Reference Stokes, Stoll and SchlugerStokes et al, 2002b ).
Cut-off points for the dexamethasone window analysis were defined empirically according to the method of Reference Ritchie, Belkin and KrishnanRitchie et al, 1990) as 0.85 and 2.5 pmol/l.
RESULTS
Illness characteristics
A total of 53 patients with bipolar disorder participated in the study, of whom 27 were remitted as defined above (Reference Thompson, Ferrier and HughesThompson et al, 2000); 26 were non-remitted, 14 of whom met the full criteria for depression and the other 12 had sub-threshold symptoms (Table 1). Of the remitted patients, 5 were on antidepressants (1 on mirtazepine, 3 on a selective serotonin reuptake inhibitor and 1 on trazodone), 4 were on typical antipsychotics and 2 on atypical antipsychotics, 17 were on lithium, 2 on lamotrigine, 5 on carbamazepine, 2 on gabapentin and 2 on benzodiazepines. Of the non-remitted patients, 10 were on at least one antidepressant (2 on mirtazepine, 2 on trazodone, 5 on a selective serotonin reuptake inhibitor, 1 on reboxetine and 3 on venlafaxine), 7 were taking typical and 7 atypical antipsychotics, 9 were on lithium, 11 on valproate, 9 on carbamazepine, 3 on gabapentin and 6 on lamotrigine. No patient or control participant was on the oral contraceptive pill.
Table 1 Illness and demographic data (mean and s.d. or percentage)
| Controls | All patients | Remitted | Non-remitted | ||
|---|---|---|---|---|---|
| Neither depressed nor remitted | Depressed | ||||
| Overall number (n) | 28 | 53 | 27 | 12 | 14 |
| n within dexamethasone window | 21 | 27 | 14 | 5 | 8 |
| % Male | 54 | 45 | 46 | 17 | 64 |
| Age (years) | 47.0 (9.4) | 46.2 (9.1) | 45.4 (8.7) | 45.9 (6.1) | 43.8 (11.0) |
| Months of remission | 23.6 (40.3) | ||||
| Months of current depressive episode | 26.7 (62.4) | ||||
| Lifetime months of depression | 63.7 (60.0) | 38.4 (55.4) | 93.0 (16.3) | 76.3 (62.7) | |
| Lifetime months of mania | 21.0 (27.2) | 9.5 (8.8) | 42.9 (42.4) | 19.4 (19.4) | |
| HRSD score | 6.7 (7.9) | 1.6 (2.0) | 3.0 (3.5) | 18.1 (4.6) | |
| YMRS score | 1.2 (2.2) | 0.5 (0.9) | 2.0 (3.0) | 1.2 (1.6) | |
Responses for patients with bipolar disorder compared with controls
The DST
The 15.00 h plasma cortisol levels were significantly higher in patients with bipolar disorder than in controls (P=0.017). Similarly, the area under the receiver operating characteristic curve revealed that patients with bipolar disorder could be discriminated from controls using the 15.00 h cortisol level. The difference in 15.00 h cortisol concentrations between remitted and non-remitted patients and controls was present at the trend level (P=0.058) (see Table 2).
Table 2 Cortisol response to the dexamethasone/corticotrophin-releasing hormone (dex/CRH) and dexamethasone suppression test (DST) and basal salivary cortisol level full analysis (all comparisons are against controls, except where shown)
| Controls | All patients | Remitted | Non-remitted | ||
|---|---|---|---|---|---|
| All non-remitted | Depressed | ||||
| Dex/CRH | |||||
| n | 28 | 53 | 27 | 26 | 14 |
| Median (95% CI) | 1.65 (0.29 to 5.15) | 34.8 (3.8 to 90.1) | 31.4 (1.9 to 129.0) | 36.9 (2.2 to 120.4) | 30.2 (1.6 to 75.6) |
| Kruskal–Wallis H | 10.8 (P=0.004)1 | ||||
| Mann–Whitney U | 410.5 (P=0.001) | 219.0 (P=0.007) | 191.5 (P=0.003) | 109 (P=0.02) | |
| Mann–Whitney U | 348.0 (P=0.96)2 | 186.5 (P=0.95)2 | |||
| Area under ROC curve | 0.72 (0.60 to 0.84) | ||||
| DST | |||||
| Median (95% CI) | 18.5 (12.1 to 20.8) | 21.7 (18.3 to 26.4) | 23.9 (15.6 to 66.5) | 20.3 (17.7 to 28.5) | 20.3 (16.7 to 28.5) |
| Kruskal–Wallis H | 5.7 (P=0.058)1 | ||||
| Mann–Whitney U | 502 (P=0.017) | ||||
| Area under ROC curve | 0.66 (0.53 to 0.79) | ||||
| Basal cortisol | |||||
| n | 22 | 39 | 19 | 20 | 8 |
| Mean (95% CI) | 97.8 (77.7 to 117.9) | 149.7 (43.0 to 256.4) | 99.9 (80.8 to 119) | 197.2 (–11.6 to 406) | 131.8 (77.7 to 185.9) |
| Area under ROC curve | 0.53 (0.37 to 0.70) | ||||
Cortisol response to the dex/CRH test
Dexamethasone and human CRH were well tolerated by all subjects and, other than transient facial flushing, no side-effects were experienced. Delta cortisol was significantly greater in patients with bipolar disorder than in controls (P=0.001). The area under the receiver operating characteristic curve revealed that patients with bipolar disorder could be discriminated from controls using delta cortisol. Examination of cortisol response to dex/CRH challenge in remitted and non-remitted patients and controls revealed a significant group difference. Post hoc analysis revealed that delta cortisol was significantly greater in remitted (P=0.004), non-remitted (P=0.003) and depressed patients (P=0.02) than in controls. There was no significant difference in delta cortisol levels between depressed patients and controls, between remitted and non-remitted patients or between remitted and depressed patients (Table 2 and Fig. 1).
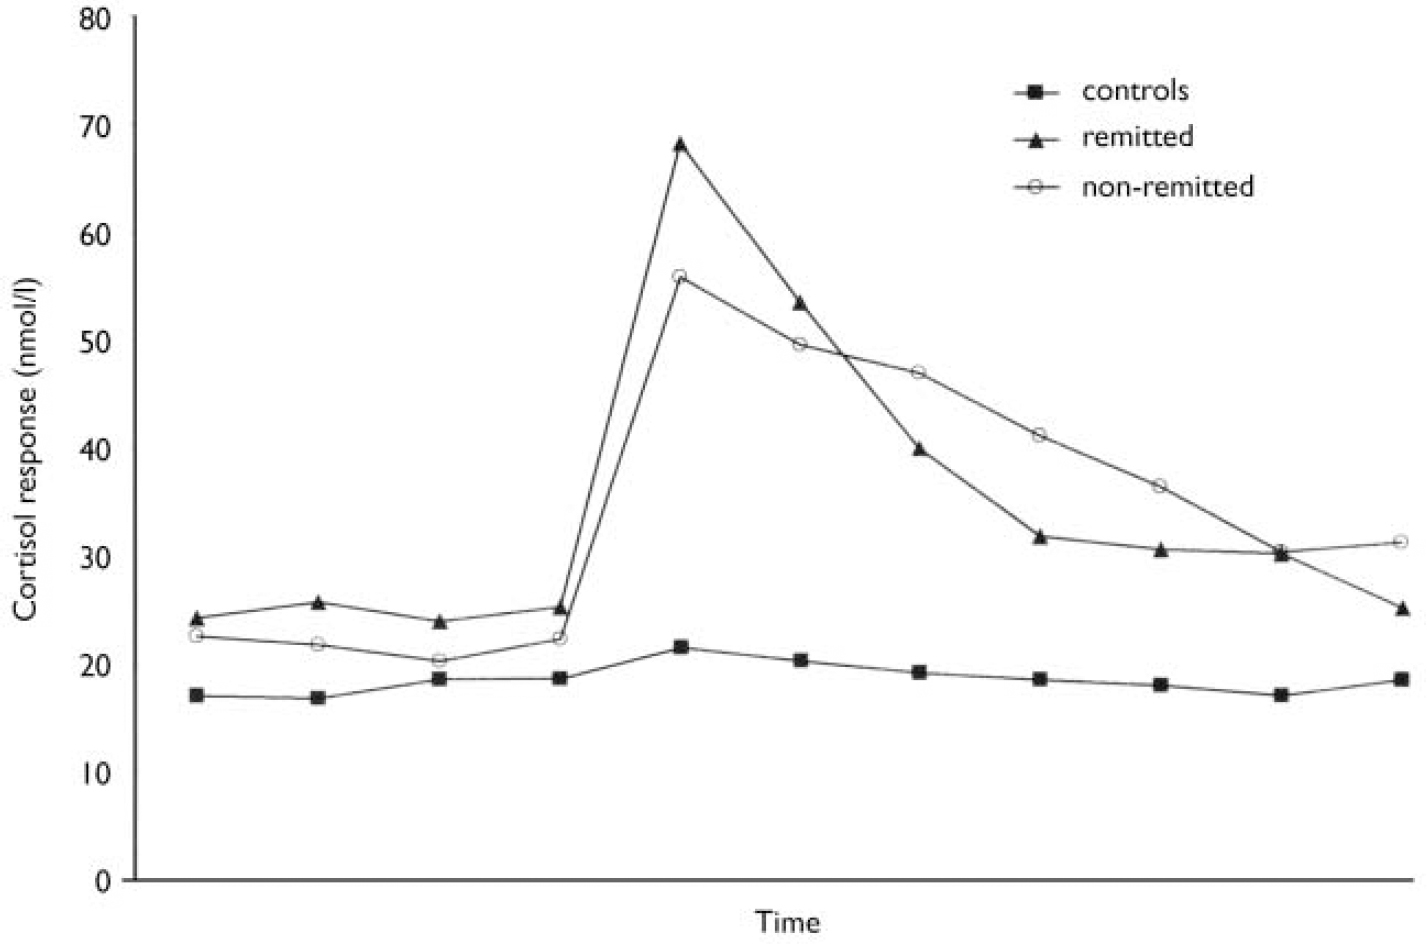
Fig. 1 The median cortisol response to the dexamethasone/corticotrophin-releasing hormone test in remitted and non-remitted patients and controls.
Correlations and predictions
The cortisol response to the dex/CRH test did not differ between males and females or between pre-menopausal and post-menopausal females. Neither age nor cycle frequency correlated with delta cortisol in the patients with bipolar disorder. The length of the clinically defined period of remission did not correlate with the magnitude of the cortisol response to the dex/CRH test in the remitted patients. Neither the duration nor the severity (as measured by the HRSD) of depressive episodes correlated with the magnitude of the cortisol response in the depressed patients (data not shown).
Basal salivary cortisol
Salivary cortisol levels were obtained for 39 patients and 22 controls. Because samples were taken prior to dexamethasone administration, subjects were not excluded from analysis on the basis of dexamethasone levels. Comparison between patients with bipolar disorder and controls revealed a significant effect of time (F[3,177]=3.8; P=0.05) but no main effect of diagnosis or time×diagnosis interaction (P>0.3). The area under the receiver operating characteristic curve revealed that patients with bipolar disorder could not be discriminated reliably from controls using this measure. Basal salivary cortisol levels between remitted and non-remitted patients and controls did not differ over time (F[3,171]=3.5; P=0.06) and there was no main effect of diagnosis and no time×diagnosis interaction (P>0.3) (Table 3).
Table 3 Cortisol response to the dexamethasone/corticotrophin-releasing hormone (dex/CRH) and dexamethasone suppression test (DST) on patients with (DST) dexamethasone levels within the dexamethasone window (all comparisons are against controls, except where shown)

| Controls | All patients | Remitted | Non-remitted | ||
|---|---|---|---|---|---|
| All non-remitted | Depressed | ||||
| Dex/CRH | |||||
| n | 21 | 27 | 14 | 13 | 8 |
| Median (95% CI) | 0.7 (-0.6 to 3.3) | 7.2 (1.9 to 44.2) | 6.9 (0.1 to 70.6) | 12.2 (1.6 to 49.0) | 15.3 (-4.9 to 120.4) |
| Kruskal-Wallis H | 6.7 (n=0.035)1 | ||||
| Mann-Whitney U | 159.0 (P=0.01) | 88.0 (P=0.048) | 34.0 (P=0.020) | 49.0 (P=0.088) | |
| Mann-Whitney U | 89.5 (P=0.94)2 | 53.0 (P=0.087)2 | |||
| Area under ROC curve | 0.72 (0.55 to 0.88) | ||||
| DST | |||||
| Median (95% CI) | 17.4 (11.8 to 21.3) | 17.7 (12.4 to 21.7) | 14.4 (10.4 to 23.9) | 19.1 (15.3 to 22.3) | 18.8 (11.9 to 22.3) |
| Kruskal-Wallis H | 1.5 (P=0.48)1 | ||||
| Mann-Whitney U | 257.0 (P=0.58) | ||||
| Area under ROC curve | 0.55 (0.37 to 0.73) | ||||
Results from analysis after exclusion of patients with dexamethasone levels outside the dexamethasone window (see Fig. 2)
Results are reported in Table 3. The dexamethasone window analysis included 21 controls and 27 patients with bipolar disorder, of whom 14 were remitted. The results remain unchanged except that delta cortisol was no longer significantly greater in depressed patients than in controls, 15.00 h cortisol levels (the DST response) were no longer greater in patients with bipolar disorder than in controls and the area under the receiver operating characteristic curve revealed that patients with bipolar disorder could not be differentiated reliably from controls using the DST response.
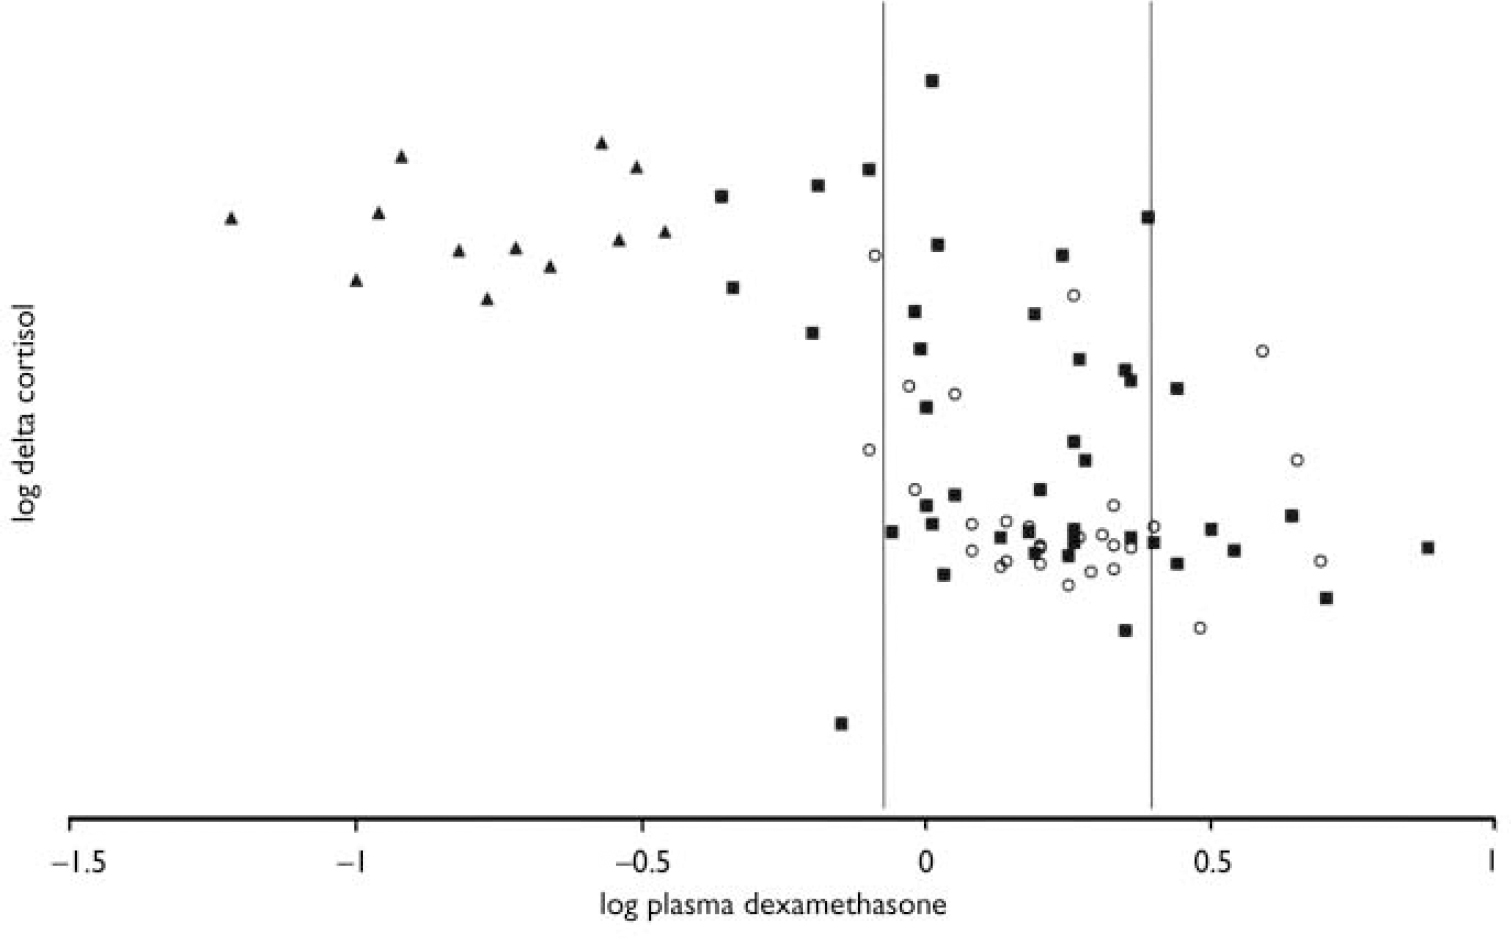
Fig. 2 Delta cortisol against plasma dexamethasone levels. Both parameters have been logarithmically transformed for clarity: (○) controls; (▪) patients; (▴) those patients taking carbamazepine. The area between the vertical lines indicates the dexamethasone window.
Effects of medication on dexamethasone levels and cortisol response
Overall, patients taking carbamazepine had lower dexamethasone levels (U=0.0; P<0.0005), a higher delta cortisol level (U=56.0; P<0.0005) and were more likely to respond to the dex/CRH test than those not taking carbamazepine (difference=63.4%, Fisher's exact test P<0.0005). Overall, there were ten patients taking known CYP3A4-inhibiting drugs. Dexamethasone levels or delta cortisol did not differ between those taking and not taking CYP3A4-inhibiting drugs, lithium or selective serotonin reuptake inhibitors (data not shown).
DISCUSSION
These data show that the cortisol response to the dex/CRH test is abnormal in patients with bipolar disorder. Furthermore, remitted patients continue to have an abnormal cortisol response to the dex/CRH test that cannot be differentiated from the response of non-remitted patients (including those who satisfy the SCID criteria for a depressive episode). These results were also evident after correcting for dexamethasone levels. Basal cortisol does not differ between patients with bipolar disorder and controls.
Confounding factors
Medication may have an impact on the cortisol response. A number of studies have shown that successful resolution of depressive symptoms normalises the HPA axis (Reference Heuser, Schweiger and GotthardtHeuser et al, 1996; Reference Nickel, Sonntag and SchillNickel et al, 2003) but a recent study has shown that in the absence of a treatment response antidepressants did not alter the cortisol output on the dex/CRH test (Reference Kunzel, Binder and NickelKunzel et al, 2003). Bschor et al (Reference Bschor, Adli and Baethge2002) have shown that lithium augmentation in treatment-resistant unipolar depression increases the cortisol response to the dex/CRH test. However, in our study patients on lithium did not have a greater cortisol response. All patients in this study taking carbamazepine had dexamethasone levels outside the normal window and all had an abnormal response on the dex/CRH test. We found no other relationship between psychotropic medication and dexamethasone levels. When dexamethasone windows were applied, there was no difference in dexamethasone levels between patients and controls, therefore an effect of psychotropic medication on cortisol output via dexamethasone metabolism appears unlikely.
After applying dexamethasone windows, 33 of the 81 participants were excluded but the study was still adequately powered and the principal findings remained unchanged. Specifically, the dex/CRH test remained abnormal in patients with bipolar disorder. Furthermore, remitted patients continued to have an abnormal response to the dex/CRH test that could not be differentiated from the response of non-remitted patients (including those who satisfy the SCID criteria for a depressive episode). The reduced power after application of dexamethasone windows may explain the finding that the DST no longer separated patients from controls.
The magnitude of the cortisol response to the dex/CRH test could not be predicted by any single illness or demographic factor, including the period of remission in remitted patients or the cycle frequency. This suggests that the HPA axis dysfunction in patients with bipolar disorder does not have a temporal relationship to the period of remission.
Measures of HPA axis function
We did not demonstrate elevation in basal salivary cortisol levels in patients with bipolar disorder, whereas previous studies employing serial plasma sampling techniques at more frequent intervals have found clear evidence of hypercortisolaemia in bipolar disorder (Reference Cervantes, Gelber and KinCervantes et al, 2001). The relatively infrequent salivary sampling employed in this study may have failed to detect the subtleties of the pulsatile and diurnal pattern of cortisol secretion (Reference Windle, Wood and LightmanWindle et al, 1998; Reference Wong, Kling and MunsonWong et al, 2000) and hence did not uncover the hypercortisolaemia that may be present in the patient group. Nevertheless, the DST and dex/CRH tests are more sensitive than basal measures of cortisol. There are a number of potential explanations for this. It may be that the extra complexity of the tests (addition of dexamethasone and CRH) reveals additional facets of the HPA axis (such as the ability to respond to negative feedback and positive drive; Reference Holsboer and BardenHolsboer & Barden, 1996). Alternatively the dexamethasone and CRH challenge may exaggerate the differences in HPA axis function between patients with bipolar disorder and controls or reduce the variance in response, thereby allowing underlying differences in function to be revealed.
We did not measure the adrenocorticotrophic hormone response to the dex/CRH test. Some previous studies have measured adrenocorticotrophic hormone and cortisol but the adrenocorticotrophic hormone responses tend to parallel cortisol responses and therefore add little to the overall sensitivity of the test (Reference Heuser, Yassouridis and HolsboerHeuser et al, 1994). Another potential criticism of our study is that we did not examine patients in manic or hypomanic states. Schmider et al (Reference Schmider, Lammers and Gotthardt1995) have previously demonstrated that the dex/CRH test is abnormal in patients with mania. Moreover, in addition to the practical problems, a recent prospective study of patients with bipolar disorder reported that time spent in the depressive spectrum predominates threefold over time with manic symptoms and fivefold over time with cycling/mixed symptoms (Reference Judd, Akiskal and SchettlerJudd et al, 2002). The present study therefore examines patients with bipolar disorder in the predominant clinical states.
Comparison with previous research
Previous studies have shown that the HPA axis is abnormal during a bipolar relapse and suggest some degree of normalisation but with residual abnormality on symptom resolution (Reference Greden, DeVigne and AlbalaGreden et al, 1982; Reference Schmider, Lammers and GotthardtSchmider et al, 1995; Reference Rybakowski and TwardowskaRybakowski & Twardowska, 1999). The present study is the first to use a rigorous prospective protocol to define remission. The sample also had a mean clinically defined duration of remission of 2 years prior to entering the euthymic protocol. It is noteworthy that, in accordance with previous studies, we found an abnormal HPA axis during relapse. However, we also found that the response to the dex/CRH test remains abnormal to a similar degree in remission.
In the Munich Vulnerability Study (Reference Holsboer, Lauer and SchreiberHolsboer et al, 1995) 54 apparently healthy people with a family history of affective disorder underwent a similar assessment of HPA axis function. Only a minority of the subjects had a family history of bipolar rather than unipolar affective disorder. None the less, this demonstration of an abnormal response to the dex/CRH test in a proportion of apparently healthy individuals with a family history of affective disorder taken in conjunction with our data suggests that HPA axis dysfunction may be a trait abnormality in bipolar disorder. Whether this dysfunction occurs premorbidly (a potential cause of the illness) or arises as a consequence of the disorder (a ‘biological scar’) should be addressed further by examination and longitudinal follow-up of a larger rigorously defined population at high risk of developing bipolar disorder.
Future studies
Our results suggest that HPA axis dysfunction may be involved in the disease process underlying bipolar disorder. Further studies should examine the temporal evolution of HPA axis function and bipolar disorder.
Clinical Implications and Limitations
CLINICAL IMPLICATIONS
-
▪ Hypothalamic-pituitary-adrenal (HPA) axis function is abnormal in patients with bipolar disorder.
-
▪ The degree of abnormality is equal in remitted and non-remitted patients.
-
▪ Abnormal function of the HPA axis may confer vulnerability to bipolar disorder.
LIMITATIONS
-
▪ This study is cross-sectional.
-
▪ We did not study patients in the manic phase.
-
▪ Longitudinal follow-up of a healthy population at high risk of developing bipolar disorder is needed to confirm that these findings represent a trait abnormality.
Acknowledgements
This study was made possible by the generous support of the Stanley Medical. Research Institute. We thank our patients and controls. We also thank Jill. Thompson for help with recruitment of subjects and Drs Dolores Del-Estal and. Andrea Hearn for providing clinical assessments. We are grateful for the. assistance of Drs Brian Lunn, Brian Moore, Andrew Cole, Suresh Joseph, Lenny. Cornwall, Desmond Benn and Louise Golightly. We also thank Margaret Smith who. performed the neuroendocrine tests, Mel Leitch, Dorothy Nelson, Michelle. Watson and Shirley Dodds who collected and analysed the samples and Anne Maule. who assisted with the preparation of the manuscript.


eLetters
No eLetters have been published for this article.