


Converging evidence suggests that people with bipolar disorder exhibit persistent cognitive impairment across a range of tasks of attention, memory and executive function during remission (Reference van Gorp, Altshuler and Thebergevan Gorp et al, 1998; Reference Ferrier, Stanton and KellyFerrier et al, 1999; Reference Rubinsztein, Michael and PaykelRubinsztein et al, 2000; Reference Clark, Iversen and GoodwinClark et al, 2002; Reference Tavares, Drevets and SahakianTavares et al, 2003; Reference Martinez-Aran, Vieta and ColomMartinez-Aran et al, 2004). However, small sample sizes, the effects of residual mood symptoms and different rates of biological abnormalities such as hypercortisolaemia may confound such studies. Importantly, few studies have examined the magnitude of impairment in a meaningful way, i.e. as effect sizes or in terms of the proportion of patients with ‘clinically significant’ impairment. This study sought to address previous limitations by testing a large sample of well-characterised, prospectively verified euthymic patients with bipolar disorder on a comprehensive neuropsychological test battery. We predicted that patients would demonstrate clear neurocognitive impairment compared with healthy controls.
METHOD
Participants
Sixty-three people with a DSM–IV diagnosis of bipolar affective disorder (American Psychiatric Association, 1994) were recruited from out-patient clinics in secondary and tertiary care in the north-east of England; 54 had bipolar type I disorder, 9 had type II and 5 were rapid-cycling. Diagnoses were confirmed using the Structured Clinical Interview for DSM–IV (SCID; Reference First, Spitzer and GibbonFirst et al, 1997). Illness characteristics were derived from retrospective life charts constructed from patient interview and hospital medical records (Reference Leverich and PostLeverich & Post, 1996). Patients were excluded if they were taking corticosteroids or antihypertensive medication, had any other current Axis I diagnosis or had a neurological or medical condition. A history of substance or alcohol misuse in the past 6 months (6 patients met DSM–IV criteria for a previous history of alcohol dependence, 4 met criteria for a previous history of substance dependence and 1 patient met criteria for previous substance and alcohol dependence) or electro-convulsive therapy (ECT) in the past year also led to exclusion.
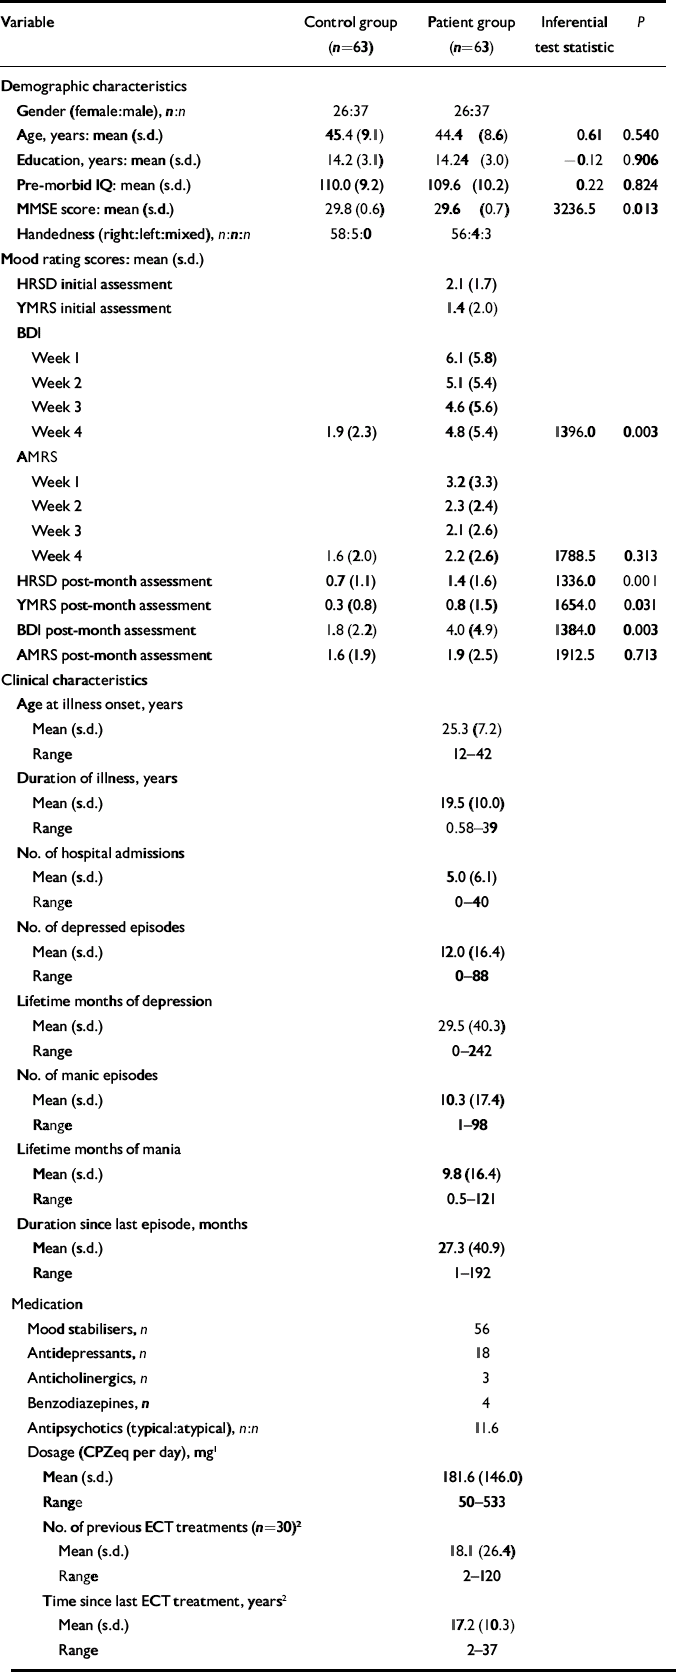
Euthymia was prospectively defined as scores of 7 or below on both the Hamilton Rating Scale for Depression (HRSD; Reference HamiltonHamilton, 1960) and the Young Mania Rating Scale (YMRS; Reference Young, Biggs and ZieglerYoung et al, 1978) at initial assessment and after 1 month. Patients also completed the Beck Depression Inventory (BDI; Reference Beck, Ward and MendelsonBeck et al, 1961) and the Altman Mania Rating Scale (AMRS; Reference Altman, Hedeker and PetersonAltman et al, 1997) each week during the euthymia verification month. Saliva samples collected at 08.00 h, 12.00 h, 16.00 h and 20.00 h on the day before testing confirmed that patients were eucortisolaemic (i.e. exhibited normal rhythm and secretion of cortisol), as measured by directed disequilibrium radioimmunoassay. With the exception of 3 patients who were taking no medication, all patients were stabilised on prophylactic medication at test; 40 were receiving combination treatment. Demographic and clinical characteristics of the sample are presented in Table 1.
Table 1 Demographic and clinical characteristics
| Variable | Control group (n=63) | Patient group (n=63) | Inferential test statistic | P |
|---|---|---|---|---|
| Demographic characteristics | ||||
| Gender (female:male), n:n | 26:37 | 26:37 | ||
| Age, years: mean (s.d.) | 45.4 (9.1) | 44.4 (8.6) | 0.61 | 0.540 |
| Education, years: mean (s.d.) | 14.2 (3.1) | 14.24 (3.0) | -0.12 | 0.906 |
| Pre-morbid IQ: mean (s.d.) | 110.0 (9.2) | 109.6 (10.2) | 0.22 | 0.824 |
| MMSE score: mean (s.d.) | 29.8 (0.6) | 29.6 (0.7) | 3236.5 | 0.013 |
| Handedness (right:left:mixed), n:n:n | 58:5:0 | 56:4:3 | ||
| Mood rating scores: mean (s.d.) | ||||
| HRSD initial assessment | 2.1 (1.7) | |||
| YMRS initial assessment | 1.4 (2.0) | |||
| BDI | ||||
| Week 1 | 6.1 (5.8) | |||
| Week 2 | 5.1 (5.4) | |||
| Week 3 | 4.6 (5.6) | |||
| Week 4 | 1.9 (2.3) | 4.8 (5.4) | 1396.0 | 0.003 |
| AMRS | ||||
| Week 1 | 3.2 (3.3) | |||
| Week 2 | 2.3 (2.4) | |||
| Week 3 | 2.1 (2.6) | |||
| Week 4 | 1.6 (2.0) | 2.2 (2.6) | 1788.5 | 0.313 |
| HRSD post-month assessment | 0.7 (1.1) | 1.4 (1.6) | 1336.0 | 0.001 |
| YMRS post-month assessment | 0.3 (0.8) | 0.8 (1.5) | 1654.0 | 0.031 |
| BDI post-month assessment | 1.8 (2.2) | 4.0 (4.9) | 1384.0 | 0.003 |
| AMRS post-month assessment | 1.6 (1.9) | 1.9 (2.5) | 1912.5 | 0.713 |
| Clinical characteristics | ||||
| Age at illness onset, years | ||||
| Mean (s.d.) | 25.3 (7.2) | |||
| Range | 12-42 | |||
| Duration of illness, years | ||||
| Mean (s.d.) | 19.5 (10.0) | |||
| Range | 0.58-39 | |||
| No. of hospital admissions | ||||
| Mean (s.d.) | 5.0 (6.1) | |||
| Range | 0-40 | |||
| No. of depressed episodes | ||||
| Mean (s.d.) | 12.0 (16.4) | |||
| Range | 0-88 | |||
| Lifetime months of depression | ||||
| Mean (s.d.) | 29.5 (40.3) | |||
| Range | 0-242 | |||
| No. of manic episodes | ||||
| Mean (s.d.) | 10.3 (17.4) | |||
| Range | 1-98 | |||
| Lifetime months of mania | ||||
| Mean (s.d.) | 9.8 (16.4) | |||
| Range | 0.5-121 | |||
| Duration since last episode, months | ||||
| Mean (s.d.) | 27.3 (40.9) | |||
| Range | 1-192 | |||
| Medication | ||||
| Mood stabilisers, n | 56 | |||
| Antidepressants, n | 18 | |||
| Anticholinergics, n | 3 | |||
| Benzodiazepines, n | 4 | |||
| Antipsychotics (typical:atypical), n:n | 11.6 | |||
| Dosage (CPZeq per day), mg1 | ||||
| Mean (s.d.) | 181.6 (146.0) | |||
| Range | 50-533 | |||
| No. of previous ECT treatments (n=30)2 | ||||
| Mean (s.d.) | 18.1 (26.4) | |||
| Range | 2-120 | |||
| Time since last ECT treatment, years2 | ||||
| Mean (s.d.) | 17.2 (10.3) | |||
| Range | 2-37 |
For the control group, 63 healthy volunteers were recruited from the community by local advertisement. Controls were matched on an individual basis with patients for age (±5 years), gender, race, handedness (Reference Briggs and NebesBriggs & Nebes, 1975), years of education (±3 years), and premorbid IQ (±5 IQ points; Reference NelsonNelson, 1982). Controls were screened for significant medical conditions and were excluded if they had a current or past psychiatric illness (confirmed by SCID) or a family history of affective disorders in a first-degree relative, or were taking any medication other than the oral contraceptive pill. Control participants completed the same clinical ratings as patients on the study day, 1 week after completing a pre-screen AMRS and BDI.
For all participants, historic and current substance use was assessed using DSM–IV criteria and a detailed inventory was derived from the major DSM–IV substance classifications. To exclude people with current alcohol misuse, participants had to have a current alcohol intake of less than 28 units per week for men and 21 units per week for women. The Modified Mini-Mental State Examination (Reference Teng and ChuiTeng & Chui, 1987) was administered on the study day to screen for dementia. The local ethics committee approved the investigation.
Neuropsychological measures
Participants completed a comprehensive battery of neurocognitive tests spanning four broad cognitive domains. To control for the possible effects of diurnal variation on performance, cognitive testing commenced at 14.00 h. Tests were administered according to standard instructions and took about 2 h to complete. The tasks were given in the same order to the whole sample. The instruments administered for each domain were as follows:
-
(a) Psychomotor performance: the Vigil test (response latency) (Reference Cegalis and BowlinCegalis & Bowlin, 1991), Digit Symbol Substitution Test from the Wechsler Adult Intelligence Scale – Revised (WAIS–R; Reference WechslerWechsler, 1981) and the Trail Making Test part A (Reference ReitenReiten, 1958).
-
(b) Attention and executive function: Trail Making Test part B, Vigil (errors of omission and commission), Stroop Neuropsychological Screening Test (Reference Trenerry, Crosson and DeboeTrenerry et al, 1989), the Tower of London task from the Cambridge Neuropsychological Test Automated Battery (CANTAB, Cambridge Cognition Ltd, Cambridge, UK), the Controlled Oral Word Association Test (Reference Benton and HamsherBenton & Hamsher, 1976), the Digits Backward sub-test from the WAIS–R, a computerised version of the Abstract Designs Self-Ordered Pointing Task (SOPT; Reference Petrides and MilnerPetrides & Milner, 1982) and the CANTAB Spatial Working Memory test.
-
(c) Immediate memory: the Digits Forward sub-test from the WAIS–R and the CANTAB Spatial Span.
-
(d) Declarative memory (visual and verbal): the CANTAB Pattern Recognition Memory and Spatial Recognition Memory tasks, CANTAB Simultaneous and Delayed Matching to Sample, CANTAB Paired Associates Learning test and the Rey Auditory Verbal Learning Test (RAVLT; Reference ReyRey, 1964).
The SOPT and CANTAB tasks were presented on a 486 microcomputer fitted with a high-resolution 38 cm touch-screen monitor. Detailed descriptions of the CANTAB tasks are provided in Robbins et al (Reference Robbins, James, Owen and Rabbit1997) and further details regarding the pen-and-paper measures in Lezak (Reference Lezak1995).
Statistical analyses
Analyses were conducted using the Statistical Package for the Social Sciences, version 9 (SPSS, 1998). Data were first examined to see whether they fulfilled the assumptions for parametric analyses. Variables fulfilling these assumptions were analysed by independent samples t-test or analysis of variance (ANOVA), with group (patient or control) as the between-subject factor. For tests with more than one level and the cortisol data, an additional within-subject factor of ‘time’ or ‘problem level’ was added. Where sphericity was violated, within-subject degrees of freedom were adjusted using Greenhouse–Geisser or Huynh–Feldt corrections as appropriate. Adjusted P values are reported, although the original degrees of freedom are also reported for clarity. Data not fulfilling the assumptions of parametric analyses were either subjected to an appropriate transformation or analysed non-parametrically (Reference HowellHowell, 1997).
To calculate clinically significant performance impairments, the proportion of patients scoring on or below the fifth percentile was determined (i.e. – 1.64 standard deviations from the mean of the control sample). Estimates of effect size were calculated for untransformed data using the formula (μpatients–μcontrols)/σpooled (Reference HowellHowell, 1999); the first part of this equation was reversed for tasks where a high score indicates poorer performance (i.e. μcontrols–μpatients) to standardise the scoring schemes across tasks. All reported P values are two-tailed. To examine the impact of illness severity on neurocognitive performance, correlations between illness characteristics and neurocognitive test variables were calculated using Spearman's method.
RESULTS
Demographic and mood data
There was no significant between-group difference across the demographic variables. On the clinical rating scales patients exhibited few symptoms during the euthymia verification period, although their scores were still significantly higher than the controls on most of the measures completed by both groups (Table 1).
Basal salivary cortisol measures
Basal salivary cortisol samples were collected from 54 people in the control group and 56 patients. Comparison between patients and controls illustrated the expected main effect of time (F (3,324)=99.18, P<0.0001) but no main effect of group (F (1,108)=1.13, P=0.29) or group×time interaction (F (3,324)=0.54, P=0.56). Overall cortisol output did not differ between the groups (P>0.2).
Cognitive measures
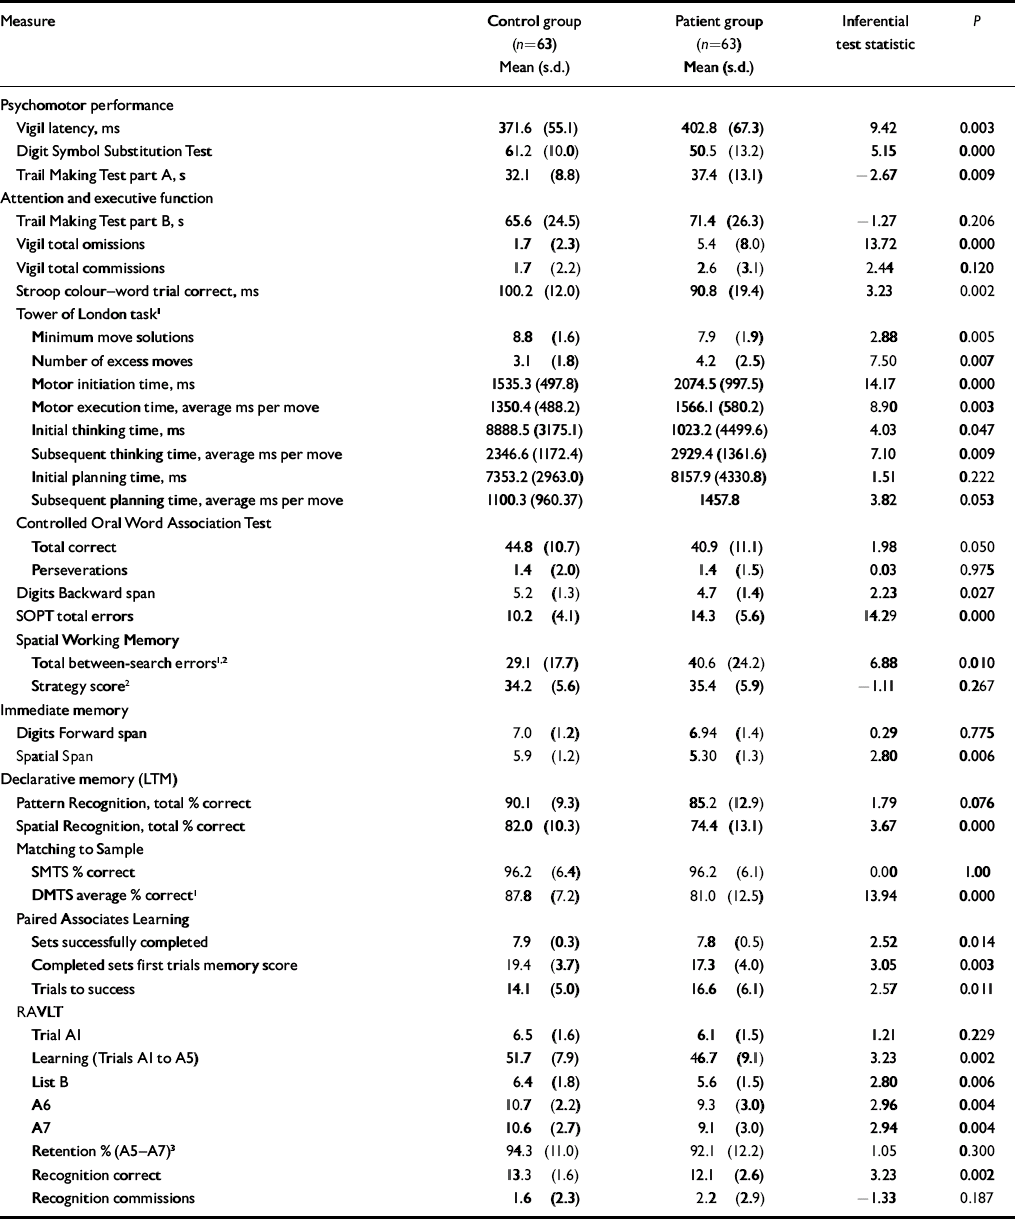
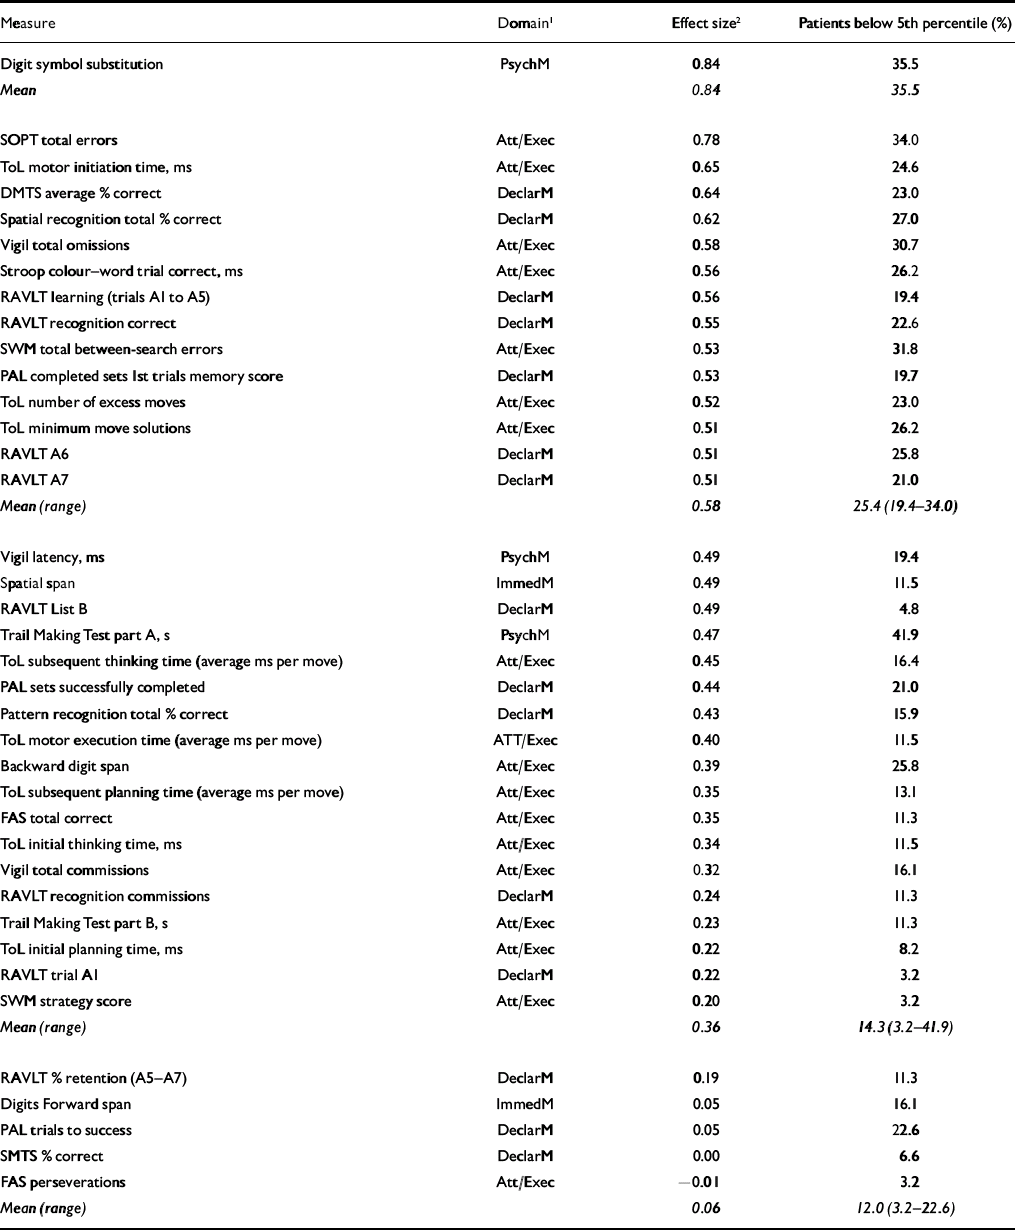
Group mean performance and statistical comparisons for all cognitive measures are summarised in Table 2. In tests comprising a delay or difficulty level variable, only main effects and interactions involving group variables are reported below: main effects of delay or difficulty level were significant in all cases (excluding Vigil latency and omissions) but are not presented here. In Table 3, outcome measures from each test are sorted by effect size, with Cohen's conventions used to indicate small, medium and large effects (Reference CohenCohen, 1988). The proportion of patients scoring at or below the fifth percentile of the control group is also presented.
Table 2 Cognitive performance comparisons (untransformed means are reported for clarity)
| Measure | Control group (n=63) Mean (s.d.) | Patient group (n=63) Mean (s.d.) | Inferential test statistic | P |
|---|---|---|---|---|
| Psychomotor performance | ||||
| Vigil latency, ms | 371.6 (55.1) | 402.8 (67.3) | 9.42 | 0.003 |
| Digit Symbol Substitution Test | 61.2 (10.0) | 50.5 (13.2) | 5.15 | 0.000 |
| Trail Making Test part A, s | 32.1 (8.8) | 37.4 (13.1) | -2.67 | 0.009 |
| Attention and executive function | ||||
| Trail Making Test part B, s | 65.6 (24.5) | 71.4 (26.3) | -1.27 | 0.206 |
| Vigil total omissions | 1.7 (2.3) | 5.4 (8.0) | 13.72 | 0.000 |
| Vigil total commissions | 1.7 (2.2) | 2.6 (3.1) | 2.44 | 0.120 |
| Stroop colour-word trial correct, ms | 100.2 (12.0) | 90.8 (19.4) | 3.23 | 0.002 |
| Tower of London task1 | ||||
| Minimum move solutions | 8.8 (1.6) | 7.9 (1.9) | 2.88 | 0.005 |
| Number of excess moves | 3.1 (1.8) | 4.2 (2.5) | 7.50 | 0.007 |
| Motor initiation time, ms | 1535.3 (497.8) | 2074.5 (997.5) | 14.17 | 0.000 |
| Motor execution time, average ms per move | 1350.4 (488.2) | 1566.1 (580.2) | 8.90 | 0.003 |
| Initial thinking time, ms | 8888.5 (3175.1) | 1023.2 (4499.6) | 4.03 | 0.047 |
| Subsequent thinking time, average ms per move | 2346.6 (1172.4) | 2929.4 (1361.6) | 7.10 | 0.009 |
| Initial planning time, ms | 7353.2 (2963.0) | 8157.9 (4330.8) | 1.51 | 0.222 |
| Subsequent planning time, average ms per move | 1100.3 (960.37) | 1457.8 | 3.82 | 0.053 |
| Controlled Oral Word Association Test | ||||
| Total correct | 44.8 (10.7) | 40.9 (11.1) | 1.98 | 0.050 |
| Perseverations | 1.4 (2.0) | 1.4 (1.5) | 0.03 | 0.975 |
| Digits Backward span | 5.2 (1.3) | 4.7 (1.4) | 2.23 | 0.027 |
| SOPT total errors | 10.2 (4.1) | 14.3 (5.6) | 14.29 | 0.000 |
| Spatial Working Memory | ||||
| Total between-search errors1,2 | 29.1 (17.7) | 40.6 (24.2) | 6.88 | 0.010 |
| Strategy score2 | 34.2 (5.6) | 35.4 (5.9) | -1.11 | 0.267 |
| Immediate memory | ||||
| Digits Forward span | 7.0 (1.2) | 6.94 (1.4) | 0.29 | 0.775 |
| Spatial Span | 5.9 (1.2) | 5.30 (1.3) | 2.80 | 0.006 |
| Declarative memory (LTM) | ||||
| Pattern Recognition, total % correct | 90.1 (9.3) | 85.2 (12.9) | 1.79 | 0.076 |
| Spatial Recognition, total % correct | 82.0 (10.3) | 74.4 (13.1) | 3.67 | 0.000 |
| Matching to Sample | ||||
| SMTS % correct | 96.2 (6.4) | 96.2 (6.1) | 0.00 | 1.00 |
| DMTS average % correct1 | 87.8 (7.2) | 81.0 (12.5) | 13.94 | 0.000 |
| Paired Associates Learning | ||||
| Sets successfully completed | 7.9 (0.3) | 7.8 (0.5) | 2.52 | 0.014 |
| Completed sets first trials memory score | 19.4 (3.7) | 17.3 (4.0) | 3.05 | 0.003 |
| Trials to success | 14.1 (5.0) | 16.6 (6.1) | 2.57 | 0.011 |
| RAVLT | ||||
| Trial A1 | 6.5 (1.6) | 6.1 (1.5) | 1.21 | 0.229 |
| Learning (Trials A1 to A5) | 51.7 (7.9) | 46.7 (9.1) | 3.23 | 0.002 |
| List B | 6.4 (1.8) | 5.6 (1.5) | 2.80 | 0.006 |
| A6 | 10.7 (2.2) | 9.3 (3.0) | 2.96 | 0.004 |
| A7 | 10.6 (2.7) | 9.1 (3.0) | 2.94 | 0.004 |
| Retention % (A5-A7)3 | 94.3 (11.0) | 92.1 (12.2) | 1.05 | 0.300 |
| Recognition correct | 13.3 (1.6) | 12.1 (2.6) | 3.23 | 0.002 |
| Recognition commissions | 1.6 (2.3) | 2.2 (2.9) | -1.33 | 0.187 |
Table 3 Cognitive performance: effect sizes and percentage of patients scoring below the fifth percentile of the control group
| Measure | Domain1 | Effect size2 | Patients below 5th percentile (%) |
|---|---|---|---|
| Digit symbol substitution | PsychM | 0.84 | 35.5 |
| Mean | 0.84 | 35.5 | |
| SOPT total errors | Att/Exec | 0.78 | 34.0 |
| ToL motor initiation time, ms | Att/Exec | 0.65 | 24.6 |
| DMTS average % correct | DeclarM | 0.64 | 23.0 |
| Spatial recognition total % correct | DeclarM | 0.62 | 27.0 |
| Vigil total omissions | Att/Exec | 0.58 | 30.7 |
| Stroop colour-word trial correct, ms | Att/Exec | 0.56 | 26.2 |
| RAVLT learning (trials A1 to A5) | DeclarM | 0.56 | 19.4 |
| RAVLT recognition correct | DeclarM | 0.55 | 22.6 |
| SWM total between-search errors | Att/Exec | 0.53 | 31.8 |
| PAL completed sets 1st trials memory score | DeclarM | 0.53 | 19.7 |
| ToL number of excess moves | Att/Exec | 0.52 | 23.0 |
| ToL minimum move solutions | Att/Exec | 0.51 | 26.2 |
| RAVLT A6 | DeclarM | 0.51 | 25.8 |
| RAVLT A7 | DeclarM | 0.51 | 21.0 |
| Mean (range) | 0.58 | 25.4 (19.4-34.0) | |
| Vigil latency, ms | PsychM | 0.49 | 19.4 |
| Spatial span | ImmedM | 0.49 | 11.5 |
| RAVLT List B | DeclarM | 0.49 | 4.8 |
| Trail Making Test part A, s | PsychM | 0.47 | 41.9 |
| ToL subsequent thinking time (average ms per move) | Att/Exec | 0.45 | 16.4 |
| PAL sets successfully completed | DeclarM | 0.44 | 21.0 |
| Pattern recognition total % correct | DeclarM | 0.43 | 15.9 |
| ToL motor execution time (average ms per move) | ATT/Exec | 0.40 | 11.5 |
| Backward digit span | Att/Exec | 0.39 | 25.8 |
| ToL subsequent planning time (average ms per move) | Att/Exec | 0.35 | 13.1 |
| FAS total correct | Att/Exec | 0.35 | 11.3 |
| ToL initial thinking time, ms | Att/Exec | 0.34 | 11.5 |
| Vigil total commissions | Att/Exec | 0.32 | 16.1 |
| RAVLT recognition commissions | DeclarM | 0.24 | 11.3 |
| Trail Making Test part B, s | Att/Exec | 0.23 | 11.3 |
| ToL initial planning time, ms | Att/Exec | 0.22 | 8.2 |
| RAVLT trial A1 | DeclarM | 0.22 | 3.2 |
| SWM strategy score | Att/Exec | 0.20 | 3.2 |
| Mean (range) | 0.36 | 14.3 (3.2-41.9) | |
| RAVLT % retention (A5-A7) | DeclarM | 0.19 | 11.3 |
| Digits Forward span | ImmedM | 0.05 | 16.1 |
| PAL trials to success | DeclarM | 0.05 | 22.6 |
| SMTS % correct | DeclarM | 0.00 | 6.6 |
| FAS perseverations | Att/Exec | -0.01 | 3.2 |
| Mean (range) | 0.06 | 12.0 (3.2-22.6) |
Psychomotor performance
Patients’ response times were significantly slower than the control group on the Vigil task. There was no group×time interaction (F (3,369)=0.438, P=0.67), suggesting that patients were impaired throughout the task. Patients were also significantly slower than controls to complete part A of the Trail Making Test and produced significantly fewer correct responses on the Digit Symbol Substitution Test.
Attention and executive function
In contrast to the performance deficit on part A of the Trail Making Test, patients and controls did not significantly differ on part B of this task. On the Vigil task, patients made significantly more errors of omission than controls; however, commission errors did not differ between groups. Analysis of omission errors across time revealed that patients were impaired throughout this task, indicated by the absence of a significant group×time interaction (F (3,369)=0.833, P=0.471). Patients’ performance was also significantly poorer than that of the control group on the Stroop task and their response accuracy on the Tower of London task was impaired. On the latter task's latency measures, patients’ motor initiation and motor execution times were significantly greater than those of the controls, as were their overall initial and subsequent thinking times. However, when the motor times were subtracted from the thinking times to provide indices of planning times per se, patients’ initial and subsequent response times did not differ significantly from controls. No group×level interaction was present across any Tower of London index (P≥0.169). On the Controlled Oral Word Association Test, patients generated significantly fewer correct responses than controls, but made no more perseverative responses, and they recalled significantly fewer digits on the Digits Backward test. On the SOPT, there was a significant main effect of group, as patients made significantly more errors than controls, but no group×set-size interaction (F (3,309)=0.632, P=0.586). For Spatial Working Memory between-search errors there was a significant main effect of group, with patients making significantly more errors than controls, but again no group×level interaction (F (2,248)=0.931, P=0.387); however, on this test's strategy index, patients’ scores were no different from controls.
Immediate memory
Unlike their performance on the Digits Forward task, patients’ CANTAB Spatial Span scores were significantly below those of the controls.
Declarative memory
Patients’ performance was no different from that of controls on the CANTAB Pattern Recognition Memory task, but they showed significant impairment on the Spatial Recognition Memory task. On the CANTAB Matching to Sample tasks there was no between-group difference when the stimuli were presented simultaneously. On the delayed trials, however, patients’ performance was significantly poorer than controls’. The absence of a group×delay interaction (F (2,240)=0.867, P=0.422) suggests that the deficit is not delay-dependent. On the Paired Associates Learning test patients required significantly more trials than controls to complete the task. Patients also completed fewer sets successfully and located fewer patterns correctly after a single presentation.
Patients’ verbal learning was significantly poorer than that of controls (RAVLT trials A1–A5). Patients’ performance was also impaired on the RAVLT distracter word list recall trial (list B), post-interference recall (trial A6), number of targets correctly identified on the recognition trial, and on the standard index of delayed recall (A7). However, when the delayed recall index was modified to control for the confounding effects of patients’ reduced encoding (see footnote 3 in Table 2), patients’ performance did not differ from controls, suggesting that retention in long-term memory per se is intact. Also, patients committed no more errors of commission than did controls on the RAVLT recognition trial and their immediate span (trial A1) was intact.
Post hoc multivariate analysis by neurocognitive domain
Studies of neurocognitive function are frequently at risk of type I error because of the number of comparisons conducted in the analysis. Multiple comparisons are a product of the need to use several tasks to profile the range of different neurocognitive processes. One approach that has been suggested to overcome this problem is to group together tests and outcome measures that have some degree of theoretical overlap (Reference StevensStevens, 2002), i.e. apply to a specific neurocognitive domain. This method was therefore adopted and it confirmed that a significant multivariate statistic (Hotelling's trace) was present in each of the four domains (from Table 2): psychomotor performance (MANOVA=0.244, F=9.86, P<0.001), attention and executive function (MANOVA=0.492, F=3.33, P<0.001), immediate memory (MANOVA=0.061, F=3.63, P=0.029) and declarative memory (MANOVA=0.2389, F=2.17, P=0.014).
Effects of residual mood symptoms
Residual mood symptoms have been found to impair cognition in affective disorders (Reference Ferrier, Stanton and KellyFerrier et al, 1999; Reference Clark, Iversen and GoodwinClark et al, 2002). As patients’ mood scores on many of the clinical rating scales used in this study were significantly higher than those of controls, a series of analyses were performed to rule out this potential confound on the observed deficits. Correlations between the clinical rating scales and neurocognitive tests illustrating between-group differences were first calculated, to establish which deficits might have been influenced by mood. Partial correlations were subsequently performed on any cognitive index that significantly correlated with the mood ratings, to examine whether the previously observed between-group differences on these indices remained when the effect of mood on performance was partialled out. These analyses illustrated that 11 cognitive indices correlated significantly with the rating scales. However, when the effects of mood on these variables were controlled, all between-group effects remained significant (apart from subsequent thinking time on the Tower of London task) when the BDI scores on the day of test and at week 4 were partialled out (P=0.066).
Relationship between illness characteristics and neurocognitive function
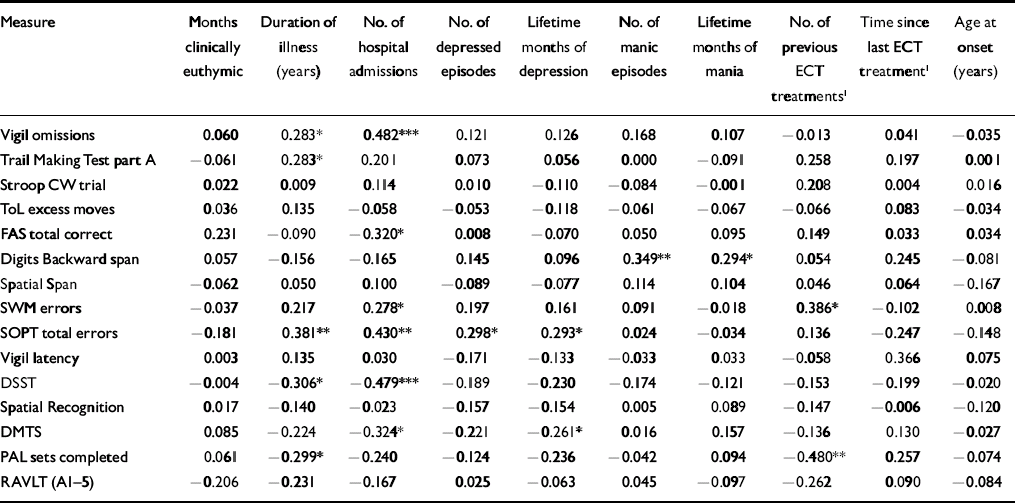
To restrict the number of correlations computed between the illness characteristics and the neurocognitive test variables, only those indices illustrating between-group differences were examined. In addition, only the most representative variable from each of the cognitive tasks was included. The results of these analyses are presented in Table 4.
Table 4 Correlations between illness characteristics and impaired neurocognitive performance in patients with bipolar disorder
| Measure | Months clinically euthymic | Duration of illness (years) | No. of hospital admissions | No. of depressed episodes | Lifetime months of depression | No. of manic episodes | Lifetime months of mania | No. of previous ECT treatments1 | Time since last ECT treatment1 | Age at onset (years) |
|---|---|---|---|---|---|---|---|---|---|---|
| Vigil omissions | 0.060 | 0.283* | 0.482*** | 0.121 | 0.126 | 0.168 | 0.107 | -0.013 | 0.041 | -0.035 |
| Trail Making Test part A | -0.061 | 0.283* | 0.201 | 0.073 | 0.056 | 0.000 | -0.091 | 0.258 | 0.197 | 0.001 |
| Stroop CW trial | 0.022 | 0.009 | 0.114 | 0.010 | -0.110 | -0.084 | -0.001 | 0.208 | 0.004 | 0.016 |
| ToL excess moves | 0.036 | 0.135 | -0.058 | -0.053 | -0.118 | -0.061 | -0.067 | -0.066 | 0.083 | -0.034 |
| FAS total correct | 0.231 | -0.090 | -0.320* | 0.008 | -0.070 | 0.050 | 0.095 | 0.149 | 0.033 | 0.034 |
| Digits Backward span | 0.057 | -0.156 | -0.165 | 0.145 | 0.096 | 0.349** | 0.294* | 0.054 | 0.245 | -0.081 |
| Spatial Span | -0.062 | 0.050 | 0.100 | -0.089 | -0.077 | 0.114 | 0.104 | 0.046 | 0.064 | -0.167 |
| SWM errors | -0.037 | 0.217 | 0.278* | 0.197 | 0.161 | 0.091 | -0.018 | 0.386* | -0.102 | 0.008 |
| SOPT total errors | -0.181 | 0.381** | 0.430** | 0.298* | 0.293* | 0.024 | -0.034 | 0.136 | -0.247 | -0.148 |
| Vigil latency | 0.003 | 0.135 | 0.030 | -0.171 | -0.133 | -0.033 | 0.033 | -0.058 | 0.366 | 0.075 |
| DSST | -0.004 | -0.306* | -0.479*** | -0.189 | -0.230 | -0.174 | -0.121 | -0.153 | -0.199 | -0.020 |
| Spatial Recognition | 0.017 | -0.140 | -0.023 | -0.157 | -0.154 | 0.005 | 0.089 | -0.147 | -0.006 | -0.120 |
| DMTS | 0.085 | -0.224 | -0.324* | -0.221 | -0.261* | 0.016 | 0.157 | -0.136 | 0.130 | -0.027 |
| PAL sets completed | 0.061 | -0.299* | -0.240 | -0.124 | -0.236 | -0.042 | 0.094 | -0.480** | 0.257 | -0.074 |
| RAVLT (A1-5) | -0.206 | -0.231 | -0.167 | 0.025 | -0.063 | 0.045 | -0.097 | -0.262 | 0.090 | -0.084 |
Relationship between basal cortisol levels and neurocognitive function
Correlations between cortisol area under the curve and neurocognitive indices were also examined for patients and controls separately. In patients, the only significant correlations observed were for the Stroop colour–word latency (rs =-0.330, P=0.015), Tower of London excess moves (rs =-0.312, P=0.022) and verbal fluency on the Controlled Oral Word Association Test (rs =0.303, P=0.025). In controls, no significant correlation was observed (data not shown).
DISCUSSION
Our study demonstrates significant neurocognitive impairment in a prospectively verified sample of euthymic patients with bipolar disorder, compared with a well-matched control group. Patients were impaired across a range of cognitive domains, including attention and executive function, immediate (spatial) memory and verbal and visuospatial declarative memory. Significant psychomotor retardation was also evident. These impairments were not attributable to hypercortisolism, because basal salivary cortisol profiling revealed no difference between patients and controls. Also, dysfunction was still evident after controlling for the effects of residual mood symptoms post hoc using a partial correlational analysis.
Previous neuropsychological findings in bipolar disorder
Our findings are consistent with a growing body of evidence that people with bipolar disorder experience a range of cognitive deficits during disease remission (Reference van Gorp, Altshuler and Thebergevan Gorp et al, 1998; Reference Ferrier, Stanton and KellyFerrier et al, 1999; Reference Rubinsztein, Michael and PaykelRubinsztein et al, 2000; Reference Clark, Iversen and GoodwinClark et al, 2002; Reference Martinez-Aran, Vieta and ColomMartinez-Aran et al, 2004). Many studies have used structured interviews and standardised rating scales to demonstrate the euthymic status of patients, but generally their sample sizes were smaller than ours and prospective follow-up or cortisol measurements were not recorded. The majority of studies to date have typically defined patients as impaired on the basis of a between-group difference (from controls) on an arbitrarily selected significance level. However, although a result might be statistically significant, this says nothing about the size of the effect, nor does it guarantee that it is clinically important. Few studies have provided data on the number of patients falling within the clinically impaired range on particular tasks, despite normative data being readily available to do so (but see Reference Rubinsztein, Michael and PaykelRubinsztein et al, 2000). We sought to address this by providing effect sizes alongside statistical significance tests and by calculating the percentage of patients falling below the fifth percentile on the measures employed.
Magnitude of the impairment: statistical v. clinical significance
Previous studies have reported deficits in up to 32% of people with bipolar disorder (Reference Astrup, Fossum and HolmboeAstrup et al, 1959; Reference Bratfos and HaugBratfos & Haug, 1968; Reference Dhingra and RabinsDhingra & Rabins, 1991; Reference Martinez-Aran, Vieta and ColomMartinez-Aran et al, 2000). Our results demonstrate that the proportion affected is extremely variable and is dependent upon the particular task employed. For example, for tasks within a medium to large effect size, on average 25% of patients scored at or below the fifth percentile, although on some tasks (such as the Digit Symbol Substitution Test) the proportion was over 33%. This figure averaged almost 15% for tasks falling in the small to medium effect size range. Even for tasks with little or no between-group difference (i.e. d<0.2), clinically significant deficits were still evident in some individuals. This is of particular clinical importance because these deficits were observed in a cohort of patients who had been euthymic for an average of 27.3 months (median 14 months), suggesting that neurocognitive impairment persists long beyond the point of symptomatic recovery. The enduring nature of this impairment is also highlighted by the absence of association between the length of time patients had been in remission and the extent of neurocognitive impairment.
Factors affecting neurocognitive impairment in bipolar disorder
All but three of the patients in this study were receiving medication at the time of testing, therefore the effects of psychotropic drugs on neurocognitive functioning cannot be excluded. Lithium use, for example, has been shown to have subtle but definite effects on several domains, including psychomotor speed and possibly verbal memory. Similarly, antidepressants have been shown to have cognitive effects, particularly those with anticholinergic properties (Reference Amado-Boccara, Gougoulis and LittreAmado-Boccara et al, 1995). However, in their review, Bearden et al (Reference Bearden, Hoffman and Cannon2001) suggest that the cognitive impairments in bipolar illness are unlikely to be a primary effect of medication. In a comparison study of euthymic patients with bipolar disorder and controls, neurocognitive impairment was observed not only in patients receiving mood-stabiliser monotherapy but also in those who were drug-free (Reference Goswami, Gulrajani and MooreGoswami et al, 2002). None the less, many patients with this disorder take several psychotropic medications at varying doses, and it is unknown what the effects of combined therapy might be, particularly over time. Similarly, although ECT may affect neurocognitive function in some patients, only half the patients in our study had ever received ECT and a negative effect of the number of previous treatments on performance was observed on a small number of tests.
Different rates of neurobiological abnormalities among patients with bipolar disorder may also affect the pattern and magnitude of neurocognitive impairment. Elevated cortisol levels have been shown to impair specific domains of neurocognitive functioning, both in studies in which synthetic glucocorticoids were administered exogenously and in patient groups with chronically elevated endogenous cortisol levels (e.g. Cushing's disease). As hypothalamic–pituitary–adrenal axis dysfunction in bipolar disorder may also persist in a proportion of euthymic patients (Reference Watson, Gallagher and RitchieWatson et al, 2004), in our study saliva samples were collected on the day prior to testing to provide a simple, non-invasive assessment of basal cortisol secretion. No difference between patients and controls was observed, potentially excluding this confound. However, basal cortisol profiling is relatively insensitive compared with ‘activating’ challenges such as the dexamethasone/corticotrophin releasing hormone test, which might be more informative in future studies (Reference Watson, Gallagher and RitchieWatson et al, 2004).
Several studies have reported that residual mood symptoms may affect the degree of neurocognitive dysfunction observed in euthymic patients with bipolar disorder (Reference Ferrier, Stanton and KellyFerrier et al, 1999; Reference Clark, Iversen and GoodwinClark et al, 2002). When residual mood symptoms were statistically controlled in our study, all between-group differences remained with the exception of one. As we recruited a larger cohort than in the earlier studies, residual symptoms may exert only subtle effects on performance and are less problematic when the statistical power of the study is increased. The observed impairment is therefore unlikely to be an epiphenomenon of mood.
Clinico-cognitive correlations: disease process or trait deficit?
Several studies have reported that patients with a more severe course of prior illness and greater number of episodes suffer greater neurocognitive decline (Reference KessingKessing, 1998; Reference van Gorp, Altshuler and Thebergevan Gorp et al, 1998; Reference Denicoff, Ali and MirskyDenicoff et al, 1999). In our study, examination of the correlation between illness history characteristics and neurocognitive functioning revealed an effect of several factors, particularly lifetime duration of illness and number of hospitalisations, consistent with several previous reports (Reference Tham, Engelbrektson and MatheTham et al, 1997; Reference Denicoff, Ali and MirskyDenicoff et al, 1999; Reference Rubinsztein, Michael and PaykelRubinsztein et al, 2000). Such associations have typically been interpreted as indicating a progressive disease process. However, the direction of causality cannot be determined from correlational analyses. These results may equally indicate that patients with neurocognitive impairments are more vulnerable to developing a severe and recurrent bipolar disorder. Preliminary evidence indicates subtle neurocognitive impairments in ‘high-risk’ groups, i.e. first-degree relatives of patients with bipolar disorder (Reference Keri, Kelemen and BenedekKeri et al, 2001; Reference Chowdhury, Thompson and WatsonChowdhury et al, 2002; Reference Sobczak, Riedel and BooijSobczak et al, 2002). Therefore, although some deficits might be the result of disease progression, evidence that impairments occur both in euthymic patients with bipolar disorder and their healthy first-degree relatives may represent an endophenotypic marker of genetic vulnerability.
Implications and future research
Neurocognitive deficits are evident in euthymic patients with bipolar disorder. These deficits are often a cause of considerable distress and can lead to impairment of psychosocial and occupational functioning (e.g. Reference Martinez-Aran, Vieta and ColomMartinez-Aran et al, 2004). Our study confirms that these deficits are of both statistical and clinical significance, and persist independently of mood symptoms. Early intervention may be particularly important in order to ameliorate such impairments, as several studies – including this one – indicate that the degree of dysfunction may increase with disease progression. One of the most important aims of future research should therefore be the identification of the underlying neurobiology of neurocognitive impairment in euthymic patients, thereby providing a target for therapeutic intervention. Cognitive and psychoeducational rehabilitation programmes may be warranted to improve the long-term outcome for some patients.
Clinical Implications and Limitations
CLINICAL IMPLICATIONS
-
▪ Patients with bipolar disorder are impaired across a range of neurocognitive domains. This is evident in terms of both statistical and clinical significance.
-
▪ These deficits persist in the euthymic state and suggest that neurocognitive impairment persists long beyond the point of symptomatic recovery.
-
▪ These deficits are not simply related to basal hypercortisolaemia.
LIMITATIONS
-
▪ The patients in the study were stable on medication, but were not drug-free.
-
▪ The study design was cross-sectional and the longitudinal course of these deficits remains to be fully demonstrated.
-
▪ Basal cortisol levels do not fully characterise hypothalamic–pituitary–adrenal dysfunction.
Acknowledgements
This project was made possible by the generous support of the Stanley. Medical Research Institute and the Mental Health Foundation. We thank Mr M. Leitch, Ms S. Dodds, Mrs M. Smith and Ms M. Watson for technical assistance. and Dr B. S. Wilkinson and Mrs C. L. Harrison for assistance with data. collection.


eLetters
No eLetters have been published for this article.