


Pressure to use outcome measures in routine clinical practice is increasing (Department of Health and Aged Care, 1999). However, the majority of psychiatrists in the UK do not routinely measure patients' care needs and outcomes in a standardised way (Reference Gilbody, House and SheldonGilbody et al, 2002). Concern about the psychometric properties of available outcome measures has been one reason; however, in recent years outcome measures subjected to adequate psychometric evaluation and explicitly intended for routine use have emerged (Reference Stedman, Yellowlees and MellsopStedman et al, 1997; Reference Thornicroft, Becker and KnappThornicroft et al, 2005). This study compared the results from four staff-rated measures recommended for routine clinical use. We had two goals: to identify the extent to which there is overlap in the information provided by these outcome measures; and to make recommendations about which outcome measures provide the most clinically relevant information for adult mental health services.
METHOD
Sample
Ten mental health teams (eight community mental health teams, one day service team and one older adults team) throughout London participated in the study between 1999 and 2000 (Reference Slade, Cahill and KelseySlade et al, 2002). The teams' catchment areas were chosen to maximise generalisability and consisted of three inner-city, five outer-city and two suburban sites. These areas had levels of deprivation measured by the Mental Illness Needs Index (mean 100; higher scores indicate greater deprivation) varying from 98 to 124 (Reference Glover, Robin and EmamiGlover et al, 1998).
Measures
The Health of the Nation Outcome Scales (HoNOS; Reference Wing, Beevor and CurtisWing et al, 1998) assess social disability in 12 domains (see Table 3); each is scored from 0 (no problem) to 4 (severe to very severe problem), and the HoNOS total score is the sum of the 12 domains (Reference Wing, Beevor and CurtisWing et al, 1998).
Table 3 Factor analysis of TAG, HoNOS and CANSAS unmet need items (weight > 0.35 shown)
| Factor | |||||||
|---|---|---|---|---|---|---|---|
| 1 | 2 | 3 | 4 | 5 | 6 | 7 | |
| Percentage of variance explained (total 50%) | 10 | 9 | 7 | 7 | 7 | 6 | 6 |
| TAG items | |||||||
| T1 Intentional self-harm | 0.76 | ||||||
| T2 Unintentional self-harm | 0.41 | 0.36 | |||||
| T3 Risk from others | 0.36 | ||||||
| T4 Risk to others | 0.62 | 0.46 | |||||
| T5 Survival | 0.44 | 0.46 | 0.44 | ||||
| T6 Psychological | 0.53 | 0.36 | |||||
| T7 Social | 0.43 | 0.37 | |||||
| HoNOS items | |||||||
| H1 Overactive, aggressive, disruptive or agitated behaviour | 0.53 | 0.45 | |||||
| H2 Non-accidental self-injury | 0.71 | ||||||
| H3 Problem drinking or drug-taking | 0.83 | ||||||
| H4 Cognitive problems | 0.64 | ||||||
| H5 Physical illness or disability problems | 0.62 | ||||||
| H6 Problems associated with hallucinations and delusions | 0.78 | ||||||
| H7 Problems with depressed mood | 0.80 | ||||||
| H8 Other mental and behavioural problems | 0.50 | ||||||
| H9 Problems with relationships | 0.48 | 0.50 | |||||
| H10 Problems with activities of daily living | 0.53 | 0.47 | |||||
| H11 Problems with living conditions | 0.82 | ||||||
| H12 Problems with occupation and activities | 0.40 | 0.37 | |||||
| CANSAS unmet need items | |||||||
| U1 Accommodation | 0.76 | ||||||
| U2 Food | 0.52 | ||||||
| U3 Looking after the home | 0.54 | ||||||
| U4 Self-care | 0.69 | ||||||
| U5 Daytime activities | 0.51 | ||||||
| U6 Physical health | |||||||
| U7 Psychotic symptoms | 0.56 | 0.82 | |||||
| U8 Information on condition and treatment | 0.37 | 0.35 | |||||
| U9 Psychological distress | 0.63 | ||||||
| U10 Safety to self | 0.63 | ||||||
| U11 Safety to others | 0.46 | 0.46 | |||||
| U12 Alcohol | 0.76 | ||||||
| U13 Drugs | 0.57 | ||||||
| U14 Company | 0.70 | ||||||
| U15 Intimate relationships | 0.75 | ||||||
| U16 Sexual expression | 0.75 | ||||||
| U17 Childcare | |||||||
| U18 Basic education | 0.38 | ||||||
| U19 Telephone | 0.69 | ||||||
| U20 Transport | 0.42 | ||||||
| U21 Money | 0.49 | 0.42 | |||||
| U22 Benefits | 0.48 | ||||||
| Interpretation | Non-psychotic symptoms and social support | Independent living skills | Social life and meaningful daytime activities | Social functioning | Risky behaviour | Personal Resources | Psychotic symptoms |
The Camberwell Assessment of Need Short Appraisal Schedule (CANSAS) assesses health and social needs across 22 domains (see Table 3), scored 0 (no need), 1 (met need), 2 (unmet need) or 9 (not known) (Reference Phelan, Slade and ThornicroftPhelan et al, 1995). The CANSAS produces two subtotal scores: ‘total unmet needs’ is the number of domains rated as an unmet need, and ‘total met needs’ is the number of domains rated as a met need (Reference Andreasen, Caputi and OadesAndreasen et al, 2001). The sum of met and unmet needs is the total need (maximum 22).
Global Assessment of Functioning (GAF; Reference Jones, Thornicroft and CoffeyJones et al, 1995) rates symptoms and social functioning on a scale ranging from 10 to 100, with anchor points for each 10-point band. In the version used in this study the two dimensions are disaggregated and the mean score is used for the GAF total (Reference Jones, Thornicroft and CoffeyJones et al, 1995).
The Threshold Assessment Grid (TAG; Reference Slade, Powell and RosenSlade et al, 2000) assesses the severity of a person's mental health problems across seven domains (see Table 3): items 2, 3, 6 and 7 are scored from 0 (none) to 3 (severe), and the remaining three items can also be scored as 4 (very severe), when immediate action is needed.
All four measures used in this study are staff-rated, and have been recommended for routine clinical use (Reference Jones, Thornicroft and CoffeyJones et al, 1995; Reference Wing, Beevor and CurtisWing et al, 1998; Reference Slade, Powell and RosenSlade et al, 2000; Reference Andreasen, Caputi and OadesAndreasen et al, 2001). The GAF, CANSAS and HoNOS have been translated into many foreign languages and are widely used internationally (Reference Thornicroft, Leese and TansellaThornicroft et al, 2002).
Procedure
Recent referrals to each mental health team were retrospectively audited to identify the most frequent referrers. Letters were sent to these referrers and other local non-statutory sector organisations describing the study and asking for their participation. The sample comprised 60 consecutive referrals from professionals for each service, plus self-referrals or informal carers' referrals. The total number of referred patients was 605, of whom 483 patients were offered an assessment by the mental health teams and 350 patients were actually seen by them.
Socio-demographic and clinical information was recorded for each referral. Training in the use of all four standardised measures (CANSAS, GAF, HoNOS and TAG) was provided for mental health service staff; this comprised one session, lasting 60-90 min, during which the four measures were described and their use demonstrated with two vignettes (Reference Slade, Cahill and KelseySlade et al, 2002). When each patient was seen by the service, the assessing clinicians completed CANSAS, GAF, HoNOS and TAG at or immediately after their first clinical contact.
Analysis
Representativeness of the sample for whom full data were available was tested using Mann-Whitney and chi-squared statistics. Correlations between total scores were analysed using graphical modelling, Procrustes analysis was used to compare multidimensional structures, and the overlap between individual items was investigated using factor and cluster analyses. A ‘graphical model’ is a particular type of graph based on a model of conditional independence (Reference EdwardsEdwards, 2000). For multivariate normal data, conditional independence between a pair of variables implies a zero partial correlation, and is indicated by the lack of a link between variables in the diagram. A link with an intermediate variable implies an indirect association. In this study a backwards, stepwise procedure for model selection, with a stringent P value (0.0001, equivalent to partial correlations above about 0.1), was used in order to focus on clinically significant levels of association.
A preliminary factor analysis of the correlation matrix based on principal components (Reference Munro and PageMunro & Page, 1993) was performed on all items. A subsequent varimax rotation was performed (excluding the single-item GAF score, since the focus was on the overlap of individual items of the TAG, HoNOS and CANSAS). The number of factors chosen was based on a scree plot, the requirement for a minimum number of items per factor and interpretability.
Procrustes analysis (Reference GowerGower, 1975) was then used to compare the multidimensional structures represented by the factor scores with those represented by each of the three scales. This technique rotates, translates and reflects a pair of multidimensional representations so as to optimise fit between them. The lack of fit (the percentage residual error) is a measure of the dissimilarity of the two multidimensional representations under consideration. The analysis was aimed at indicating how far any one scale can replicate the information in all the scales combined.
Cluster analysis (Reference Everitt, Landau and LeesEveritt et al, 2001) was used to group together items having similar values across cases. Ward's method was used for the primary analysis, based on Euclidean distance after z-scoring the data to mean 0 and standard deviation 1. A dendrogram (a diagram of the levels at which clusters join during clustering) was used to decide on the number of clusters in addition to considerations of interpretability. Checks for robustness were made by rerunning the analyses on random halves of the data, on data standardised to have a range 0-1, and by using average and complete linkage methods.
For other examples of the factor and cluster analysis used in similar applications see Shiori et al (Reference Shiori, Someya and Murashita1996) and Cordingley et al (Reference Cordingley, Wearden and Appleby2001). Krzanowski (Reference Krzanowski1987) gives an application of Procrustes analysis for identifying subsets of variables preserving multivariate structure. All analyses were carried out using the Statistical Package for the Social Sciences version 11.0, MIM 3.1 (Reference EdwardsEdwards, 2000) and Genstat 5.
RESULTS
The mental health teams saw 350 newly referred patients between June 1999 and September 2000. Three-quarters of the patients (n=264) had a complete assessment and their socio-demographic and clinical characteristics are shown in Table 1. Over half of these patients had a neurotic disorder, including depression, and 14% had schizophrenia. Eighty-six patients did not have a full assessment; their mean age was 44.3 years (s.d.=18.4), 47% were female and 42% had a clinical diagnosis of depression. There was no significant difference on these variables between those with complete and incomplete assessments.
Table 1 Socio-demographic and clinical characteristics of the sample (n=264)
| Characteristic | |
|---|---|
| Gender: female, n (%) | 147 (56) |
| Age, years: mean (s.d.) | 44.7 (18.6) |
| Primary clinical diagnosis, n (%) | |
| Depression | 102 (39) |
| Schizophrenia | 37 (14) |
| Other neurosis | 36 (14) |
| Substance misuse | 9 (3) |
| Personality disorder | 4 (2) |
| Other unspecified diagnosis | 57 (22) |
| Not known | 19 (7) |
| CANSAS score: mean (s.d.) | |
| Total needs | 7.1 (3.6) |
| Met needs | 3.1 (2.6) |
| Unmet needs | 4.0 (3.0) |
| HoNOS score: mean (s.d.) | 9.7 (5.1) |
| TAG score: mean (s.d.) | 5.1 (3.1) |
| GAF score: mean (s.d.) | 59.0 (13.7) |
| CANSAS total needs score | |
| Possible range | 0-22 |
| Observed range | 0-18 |
| CANSAS total met needs score | |
| Possible range | 0-22 |
| Observed range | 0-11 |
| CANSAS total unmet needs score | |
| Possible range | 0-22 |
| Observed range | 0-16 |
| HoNOS score | |
| Possible range | 0-48 |
| Observed range | 0-25 |
| TAG score | |
| Possible range | 0-24 |
| Observed range | 0-14 |
| GAF score | |
| Possible range | 0-100 |
| Observed range | 16-90 |
Assessments that were incorrectly completed or blank were ignored, comprising 34 HoNOS (11%), 25 (8%) GAF, 23 (7%) CANSAS and 4 (1%) TAG. Missing TAG data were either pro-rated (where five or six domains were completed) or assumed to be 0 for missing domains.
Bivariate and partial correlations between the total scores (all at best moderate) are given in Table 2; Figure 1 shows the strongest partial correlations remaining after the stepwise elimination and refitting procedure of graphical modelling. Both bivariate and partial correlations indicate that all variables are associated in the expected direction and that the CANSAS ‘total met needs’ score is relatively independent of the other measures, except for ‘unmet needs’. The CANSAS ‘total met needs’ score was therefore omitted from subsequent item-level analysis.
Table 2 Correlations between total scores for the four measures
| GAF | TAG | HoNOS | Met needs | |
|---|---|---|---|---|
| Bivariate | ||||
| TAG total | − 0.659 | |||
| HoNOS total | − 0.610 | 0.717 | ||
| Met needs | − 0.026 | 0.079 | 0.035 | |
| Unmet needs | − 0.492 | 0.553 | 0.675 | − 0.165 |
| Partial | ||||
| TAG total | − 0.388 | |||
| HoNOS total | − 0.191 | 0.414 | ||
| Met needs | 0.003 | 0.109 | 0.104 | |
| Unmet needs | − 0.088 | 0.113 | 0.460 | − 0.268 |
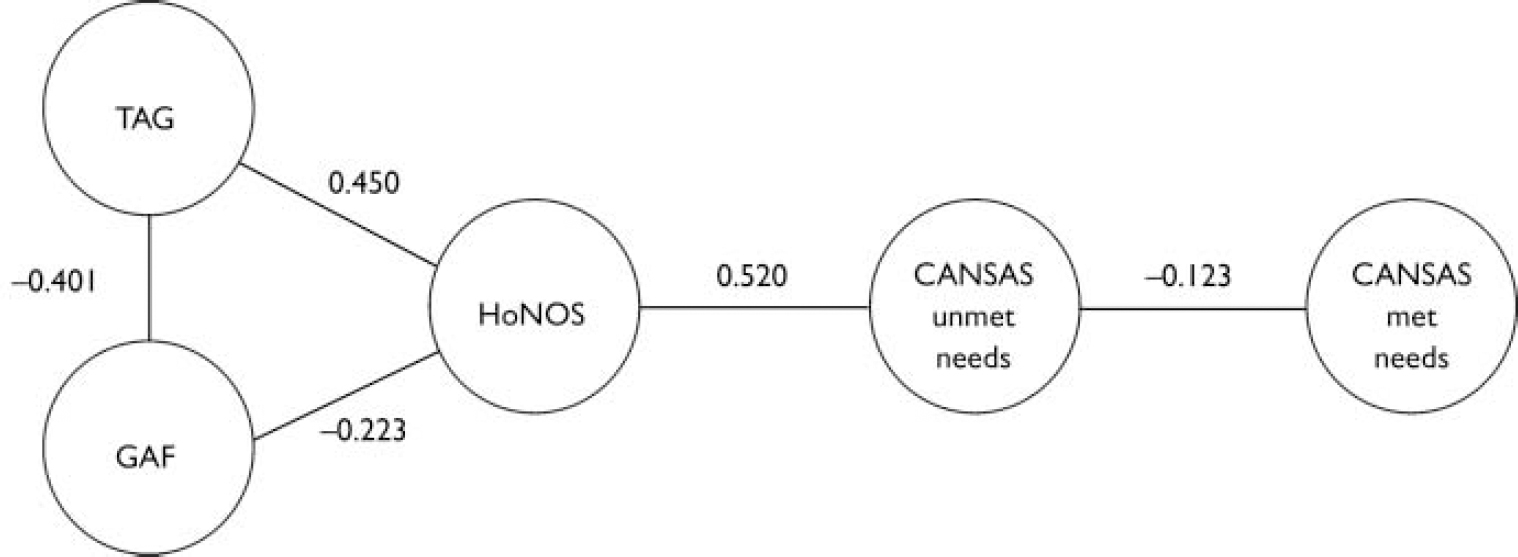
Fig. 1 Graphical model showing strongest partial correlations between total scores for the four measures after stepwise elimination of least significant links (CANSAS, Camberwell Assessment of Need Short Appraisal Schedule; GAF, Global Assessment of Functioning; HoNOS, Health of the Nation Outcome Scales; TAG, Threshold Assessment Grid).
A preliminary principal component analysis (not shown) showed a first component (accounting for 16% of the variance) with loadings on most items, including all the TAG items. Since all the items are scored in the same direction, and since there tend to be small to moderate correlations between the items, this is as expected. The strongest item loading for this general ‘severity’ factor, as it is interpreted, was for GAF total score with which it was correlated at -0.37. The correlation between this factor and total score of TAG was 0.40, with HoNOS it was 0.35 and with CANSAS ‘total unmet needs’ it was 0.28.
Unrotated and rotated principal component analyses were performed using TAG, HoNOS and CANSAS items. Twelve unrotated components had eigenvalues greater than 1.0 and a scree plot suggested an ‘elbow’ between four and eight components. Seven components, interpreted as factors, were chosen since this solution retained a reasonable degree of detail while ensuring that at least three items were present in each factor. The Procrustes fit of the structure based on each individual scale to the structure based on these seven factors was 38% for TAG, 48% for HoNOS and 43% for CANSAS.
The rotated seven-factor solution, which accounted for 50% of the variance, is shown in Table 3. All HoNOS items load (at the level of 0.35) on at least one factor with overlap in three items. Similarly, all CANSAS items (except ‘childcare’) load on at least one factor, and there is overlap on two factors for three items. Most importantly, both CANSAS and HoNOS have at least one item in every factor. No TAG item appears in one of the factors (five), and all TAG items appear in at least two factors, except for the items ‘intentional self-harm’ and ‘risk to others’, which are associated with only one factor each.
Two solutions from Ward's method of cluster analysis are presented in Table 4, with interpretations for the clusters. A large jump in the dendrogram was evident at four clusters (termed the ‘broad’ solution). A ‘narrow’ solution is also tabulated, since this has a strong resemblance to the factors shown in Table 3, at least in terms of overall interpretation. The membership of each narrow or broad cluster is listed under each heading. At least two items from the HoNOS and two items from the CANSAS contributed to each broad cluster, and to all but one of the factors. Both HoNOS and CANSAS had items appearing in all eight narrow clusters, but TAG did not add any information to four of these clusters (‘psychotic symptoms’, ‘substance misuse’, ‘company and activities’ and ‘accommodation’). Even in the broad cluster solution, TAG missed information for one of the four clusters (‘company and activities’/‘accommodation’).
Table 4 Cluster membership of HoNOS, TAG and CANSAS unmet needs items in broad (four-cluster) and narrow (eight-cluster) solutions1
| Broad cluster 1 | Broad cluster 2 | Broad cluster 3 | Broad cluster 4 | |||||
|---|---|---|---|---|---|---|---|---|
| Narrow cluster 1 | Narrow cluster 2 | Narrow cluster 3 | Narrow cluster 4 | Narrow cluster 5 | Narrow cluster 6 | Narrow cluster 7 | Narrow cluster 8 | |
| Interpretation | Physical health and disabilities, activities of daily living, childcare | Independent living skills | Psychotic symptoms | Substance misuse | Violence | Non-psychotic symptoms and relationships | Company and activities | Accommodation |
| TAG | T2 | T3 | T4 | T1 | ||||
| T5 | T6 | |||||||
| T7 | ||||||||
| HoNOS | H5 | H4 | H6 | H3 | H1 | H2 | H12 | H11 |
| H10 | H7 | |||||||
| H8 | ||||||||
| H9 | ||||||||
| CANSAS | U2 | U8 | U7 | U12 | U11 | U9 | U5 | U1 |
| U3 | U18 | U13 | U10 | U14 | ||||
| U4 | U19 | U15 | ||||||
| U6 | U20 | U16 | ||||||
| U17 | U21 | |||||||
DISCUSSION
Four measures intended for routine clinical use were tested on a sample of patients from mental health services. The relationship between the total scores of the four measures was examined first and this indicated that the CANSAS ‘total met needs’ score showed low association with the other measures, apart from the CANSAS ‘total unmet needs’ score with which it was moderately correlated. However, there was some degree of dependence between GAF, TAG, HoNOS and CANSAS ‘total unmet needs’ score. Factor and cluster analyses were then applied to the individual items in the item-based measures. The goal was to investigate whether one measure could adequately describe patients (at some level) or whether, conversely, meaningful and comprehensive clinical information could only be provided by a combination of measures. Before considering this, it is worth commenting on the measurement of overall severity.
Overall severity factor
A weak first factor, which can be interpreted as ‘severity’, was found in the preliminary factor analysis. The proportion of variance accounted for (16%) was low compared with the 50-69% found using patient-rated measures (Reference Fakhoury, Kaiser and Roeder-WannerFakhoury et al, 2002). This may reflect the fact that there are many variables (and hence sources of measurement error) or that there are underlying factors that do not relate directly to severity, or both. Many items from each of the four measures loaded on this factor and any of the separate scale totals could be used as a proxy for it. Strongest correlations were with TAG total (0.40) and GAF (-0.37). The GAF would be the briefest proxy measure for this severity factor, but TAG had all seven items loading above the threshold on this factor and so provides the more meaningful measure.
Choice of scale
Turning to the subsequent analyses of the items, the rotated factor analysis found seven interpretable factors, whereas the narrow cluster analysis revealed eight interpretable clusters; these two groupings of items were similar. The Procrustes analyses comparing the overall structure represented by the factors with the individual scales indicated that HoNOS and CANSAS matched the factor structure better than TAG. This finding indicates that differences between patients (as reflected in the factors) are best replicated by HoNOS or CANSAS. However the percentages of variation explained suggest that no single scale is entirely adequate for this.
As Table 2 shows, at least two items from the HoNOS and two items from the CANSAS contributed to each broad cluster, and to all but one of the factors. Even at the more detailed eight-cluster level, both HoNOS and CANSAS contributed at least one item to each cluster. In an epidemiological study one could thus use either HoNOS or CANSAS to represent discrete categories of patients' problems. In a clinical situation this might also be the case, depending on the particular focus of the evaluation; for example, one could decide whether the particular item or pair of items could be considered a reasonable proxy for the domain or area under consideration or - in the case of the TAG - whether the missing information was relevant. The information in Table 4 can be used to make choices between the scales if this is required.
The CANSAS has the advantage of also providing information about met needs. Needs can be met through the efforts of the mental health team, through the patient's efforts, or through help from informal sources such as friends or family. Therefore the interpretation of met needs is complex. Nevertheless, it may be important to consider met needs when evaluating case-loads (Reference Phelan, Slade and ThornicroftPhelan et al, 1995). Thus CANSAS might be the single measure of preference, if only one were to be chosen. The TAG did not have any item in four narrow clusters out of eight, and when a broader solution with four clusters only was considered, TAG missed information in one out of the four broad clusters. The results of the factor and cluster analyses at both broad and detailed levels agree therefore on a higher meaningfulness for HoNOS and CANSAS than for TAG in this sample.
Limitations
Several methodological limitations can be identified. For the purpose of this study, the reliability of each of the four measures was assumed to be adequate on the basis of their published psychometric properties. However, no study has yet compared their relative reliability when used in the same setting. Furthermore, there is some evidence that HoNOS ratings are less reliable when completed by clinical staff (as in this study) rather than by research staff (Reference Bebbington, Brugha and HillBebbington et al, 1999). Similarly, the interrater reliability for staff-rated CANSAS ‘total unmet needs’ score (0.80) has been found to be higher than that for ‘total met needs’ (0.53) (Reference Andreasen, Caputi and OadesAndreasen et al, 2001). However, the results for the individual scales are similar to those of other studies involving equivalent mental health service populations (e.g. Reference Slade, Beck and BindmanSlade et al, 1999; Reference Ruggeri, Leese and ThornicroftRuggeri et al, 2000).
Data were collected in routine clinical settings, so only clinical diagnosis and easily available socio-demographic characteristics were recorded. The strength of this approach is that the study sample is representative of patients referred to adult and elderly mental health teams, but the study sample is not comprehensively characterised (Reference Harrison and EatonHarrison & Eaton, 1999). Also, the data collected regarded new referrals, and these patients are unlikely to be representative of patients receiving continuing care from community mental health teams.
This study used exploratory techniques to investigate the relationship between the four measures. The factor analysis was at the limit of acceptability in terms of the number of cases per variable (about six). The use of methods based on the correlation matrix may be questionable when the data are binary or ordinal, although according to Joliffe & Morgan (Reference Joliffe and Morgan1992) this is a relatively minor problem when the aim is exploratory, as it is here. The cluster analysis entailed subjective choices of standardisation and method. Nevertheless, these two sets of results, although not necessarily definitive summaries of the data, were consistent with each other and interpretable.
Future work
Future work will need to confirm the existence of a global severity factor, the independence of the CANSAS ‘total met needs’ score, and the comprehensiveness of CANSAS and HoNOS using confirmatory analysis. This could involve systematic comparison of the four routine outcome measures used in this study with psychometrically validated research measures (such as the Needs for Care Assessment Schedule; Reference Brewin, Wing and MangenBrewin et al, 1987) or triangulation using qualitative approaches to investigate whether both CANSAS and HoNOS span the full range of domains relevant to providing and evaluating mental health care. Overall, a more analytical approach to investigating the data could usefully include consideration of the extent to which the psychometric properties of these measures are preserved in routine use.
Rather than choosing a specific scale, a possible approach would be to choose items from all three scales that would span these domains, thus effectively designing a new scale. The Procrustes analysis suggests that this could be worthwhile, and the methods described by Krzanowski (Reference Krzanowski1987) could be employed. These would entail finding the best subset from the complete pool of items from all three scales, rather than accepting pre-existing sets of items.
Despite the limitations noted above, several conclusions can be drawn. In relation to the first goal of the study, a global severity factor was identified which accounted for some of the variance in each staff-rated measure, but there was no evidence of substantial overlap between the four measures. They do not all measure the same underlying construct. For the second goal, this study allows some recommendations to be made regarding which outcome measures to use routinely. When a detailed characterisation of clinical and social needs of the patient and outcomes is required, HoNOS and CANSAS should be used. When a meaningful but more limited characterisation of the patient is required, either CANSAS or HoNOS could be used, but CANSAS has the advantage of providing extra information about met needs. Finally, when the goal is to evaluate severity only, this can be measured using either TAG or GAF: TAG provides the most meaningful assessment and GAF provides the briefest assessment.
Clinical Implications and Limitations
CLINICAL IMPLICATIONS
-
▪ A global severity measure accounts for only a small amount of the variance in ratings, and can be assessed using either the Threshold Assessment Grid or the Global Assessment of Functioning.
-
▪ Either the Health of the Nation Outcome Scales (HoNOS) or the Camberwell Assessment of Need Short Appraisal Schedule (CANSAS) can be used to obtain a detailed characterisation of clinical and social needs of the patient.
-
▪ Compared with HoNOS, the CANSAS provides extra information about met needs.
LIMITATIONS
-
▪ The study used exploratory techniques that entailed subjective choices of standardisation and method.
-
▪ Patients were described by clinical diagnosis and easily available socio-demographic characteristics only.
-
▪ Previous evidence suggests that the reliability of HoNOS is reduced when it is completed by clinical staff.
Acknowledgements
The other lead investigators of the Threshold Assessment Grid study were. Drs Sharon Cahill, Wendy Kelsey, Robin Powell and Geraldine Strathdee. We. thank Professor Graham Thornicroft of the Institute of Psychiatry for his. helpful comments and Professor Mike Baxter of Nottingham Trent University and. an anonymous referee for their valuable statistical advice. The study was. funded by North Thames Responsive Funding Programme (RFG549). The views in. this publication are those of the authors and not necessarily those of the. National Health Service Executive or the Department of Health.


eLetters
No eLetters have been published for this article.