There is evidence that recruiting adequate numbers of psychiatrists in the UK has been difficult for many years (Royal College of Psychiatrists, 1995, 1998, 2001). The most recent information available suggests that 11% of consultant posts and 7% of National Training Numbers in psychiatry are vacant (Royal College of Psychiatrists, 2002). Moreover, psychiatry accounted for 29% of all consultant vacancies in all specialties in England (364 out of 1264; Department of Health, 2003b ). Brockington & Mumford (Reference Brockington and Mumford2002) discussed strategies that might improve recruitment, and concluded with a call for work to examine trends in, and factors that might influence, career choices for psychiatry. In this paper we aim to inform discussion about recruitment to psychiatry by summarising and expanding our findings on early career choices obtained from surveys of all medical qualifiers from all UK medical schools in selected years since 1974.
METHOD
Surveys have been undertaken by the UK Medical Careers Research Group of the graduates of 1974, 1977, 1980, 1983, 1993, 1996, 1999 and 2000. Our methods have been described in detail elsewhere (Reference Parkhouse, Campbell and ParkhouseParkhouse et al, 1983; Reference Ellin, Parkhouse and ParkhouseEllin et al, 1986; Lambert et al, Reference Lambert, Goldacre and Edwards1996a ,Reference Lambert, Goldacre and Parkhouse b , Reference Lambert, Goldacre and Turner2003; Reference Goldacre, Davidson and LambertGoldacre et al, 1999). In brief, towards the end of the first and third years after qualification, and at longer time intervals after that, we send postal questionnaires to all medical graduates from each medical school. Up to four reminders are sent to non-respondents. In 1974 the graduates of all medical schools in England, Wales and Scotland were surveyed. From the cohort of 1977 onwards, the surveys covered the whole of the UK, including Northern Ireland. The doctors mailed in the first survey of each cohort comprise the whole cohort, as it was at the time of qualification. Subsequent surveys of a cohort exclude only those doctors who had indicated previously that they did not wish to participate, or who were untraceable after exhaustive searching, or who were known to have died.
One of the questions asked is ‘What is your choice of long-term career?’ We ask the doctors to be as general or specific as they wish and, if they have more than one choice, to list up to three in order of preference. We also ask recipients whether they have ‘definitely’, ‘probably’ or ‘not really’ made up their mind about their choice of long-term career. Additionally, we invited those graduating in 1993 and 1996 to signify which factors, from a list of 11 possible factors specified in the questionnaire, had influenced their choice of career ‘a great deal’, ‘a little’ or ‘not at all’.
A variable percentage of doctors, generally between 10% and 15%, give two first choices with equal weight (which we term ‘tied choices’) and a much smaller percentage give three tied choices. In this paper, for simplicity, we have counted each individual who gave psychiatry as a tied first choice as a doctor choosing psychiatry. In some previous analyses, we have counted those who gave a tied choice as a ‘0.5 equivalent’ (or ‘0.3 equivalent’ as appropriate) doctor choosing the specialty (Lambert et al, Reference Lambert, Goldacre and Edwards1996a ,Reference Lambert, Goldacre and Parkhouse b , Reference Lambert, Goldacre and Turner2003). As a consequence, the percentages quoted in this paper may exceed the ‘whole time equivalent’ percentages choosing psychiatry, and may exceed those published previously as such for each cohort by a few tenths of a percentage point but always by less than 1%. Comparisons of responses between groups of doctors and tests of their statistical significance were made using χ2 statistics, binary logistic regression and correlation analysis.
RESULTS
The survey questionnaires were sent to 28 980 doctors covering all eight cohorts in the pre-registration year; 21 845 (75.4%) replied. Three years after qualification the survey questionnaire was sent to 24 044 doctors covering the first seven cohorts; 17 741 (73.8%) replied. The graduates of 2000 have been surveyed recently at the end of their third year after qualification and their results are not yet available.
Early career choices for psychiatry
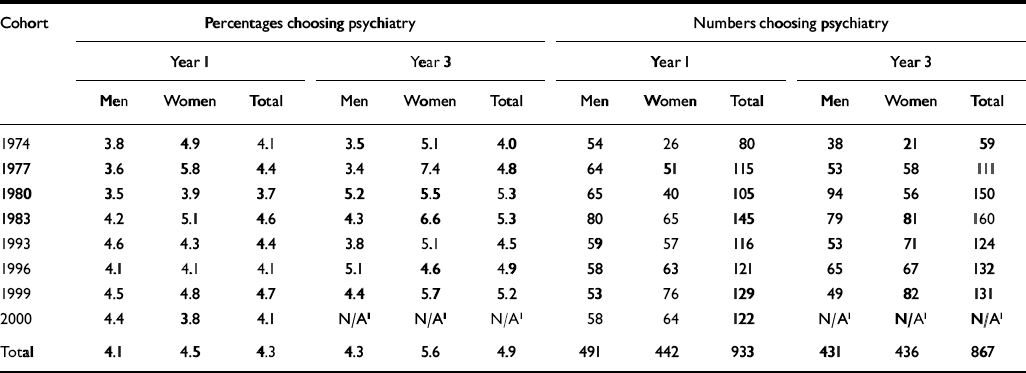
In the first year after qualification, 4.1% of men, 4.5% of women and 4.3% of all respondents signified that psychiatry was their first choice of long-term career (Table 1; χ2 1=2.7, P>0.05, comparing men and women). At the end of the third year after qualification, psychiatry was the first choice of 4.3% of men, 5.6% of women and 4.9% overall (χ2 1=16.6, P<0.001, comparing men and women). There are some small differences from year to year in whether a higher percentage of women than men chose psychiatry. As reported previously (Reference ParkhouseParkhouse, 1991), a slightly higher percentage of women than men in the early cohorts signified psychiatry as their first choice of long-term career in year 1 and year 3. However, this was not consistently the case in later cohorts (Table 1). There was no significant linear trend in the level of first- or third-year choices for psychiatry for men, women or total (all P values >0.05 using χ2 test for trend).
Table 1 Percentages and numbers of respondents who specified psychiatry as their first choice of eventual career at one and three years after graduation, 1974-2000
| Cohort | Percentages choosing psychiatry | Numbers choosing psychiatry | ||||||||||
|---|---|---|---|---|---|---|---|---|---|---|---|---|
| Year 1 | Year 3 | Year 1 | Year 3 | |||||||||
| Men | Women | Total | Men | Women | Total | Men | Women | Total | Men | Women | Total | |
| 1974 | 3.8 | 4.9 | 4.1 | 3.5 | 5.1 | 4.0 | 54 | 26 | 80 | 38 | 21 | 59 |
| 1977 | 3.6 | 5.8 | 4.4 | 3.4 | 7.4 | 4.8 | 64 | 51 | 115 | 53 | 58 | 111 |
| 1980 | 3.5 | 3.9 | 3.7 | 5.2 | 5.5 | 5.3 | 65 | 40 | 105 | 94 | 56 | 150 |
| 1983 | 4.2 | 5.1 | 4.6 | 4.3 | 6.6 | 5.3 | 80 | 65 | 145 | 79 | 81 | 160 |
| 1993 | 4.6 | 4.3 | 4.4 | 3.8 | 5.1 | 4.5 | 59 | 57 | 116 | 53 | 71 | 124 |
| 1996 | 4.1 | 4.1 | 4.1 | 5.1 | 4.6 | 4.9 | 58 | 63 | 121 | 65 | 67 | 132 |
| 1999 | 4.5 | 4.8 | 4.7 | 4.4 | 5.7 | 5.2 | 53 | 76 | 129 | 49 | 82 | 131 |
| 2000 | 4.4 | 3.8 | 4.1 | N/A1 | N/A1 | N/A1 | 58 | 64 | 122 | N/A1 | N/A1 | N/A1 |
| Total | 4.1 | 4.5 | 4.3 | 4.3 | 5.6 | 4.9 | 491 | 442 | 933 | 431 | 436 | 867 |
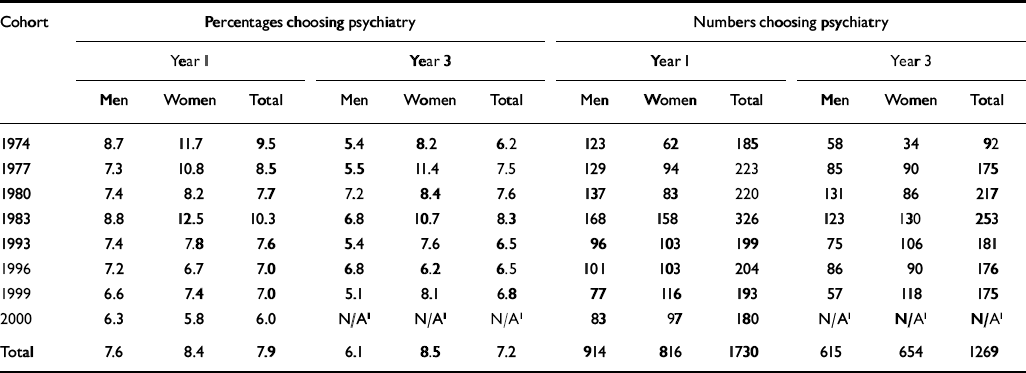
Considering all career choices - first, second and third choices - psychiatry was chosen by 7.6% of men, 8.4% of women and 7.9% overall in year 1 and by 6.1% of men, 8.5% of women and 7.2% overall in year 3 (Table 2). In response to the question of whether the respondents had ‘definitely’, ‘probably’ or ‘not really’ made up their minds about their specified first choice of career, the levels of certainty of choice for psychiatry were similar to those expressed by those choosing other careers in the first year after qualification (Table 3; χ2 1=1.3, P>0.05). At the third year after qualification, 52.8% of those choosing psychiatry regarded their career choice as definite, compared with 46.9% of those choosing other careers (χ2 1=11.2, P=0.001).
Table 2 Percentages and numbers of respondents who specified psychiatry as their first, second or third choice of eventual career at one and three years after graduation, 1974-2000
| Cohort | Percentages choosing psychiatry | Numbers choosing psychiatry | ||||||||||
|---|---|---|---|---|---|---|---|---|---|---|---|---|
| Year 1 | Year 3 | Year 1 | Year 3 | |||||||||
| Men | Women | Total | Men | Women | Total | Men | Women | Total | Men | Women | Total | |
| 1974 | 8.7 | 11.7 | 9.5 | 5.4 | 8.2 | 6.2 | 123 | 62 | 185 | 58 | 34 | 92 |
| 1977 | 7.3 | 10.8 | 8.5 | 5.5 | 11.4 | 7.5 | 129 | 94 | 223 | 85 | 90 | 175 |
| 1980 | 7.4 | 8.2 | 7.7 | 7.2 | 8.4 | 7.6 | 137 | 83 | 220 | 131 | 86 | 217 |
| 1983 | 8.8 | 12.5 | 10.3 | 6.8 | 10.7 | 8.3 | 168 | 158 | 326 | 123 | 130 | 253 |
| 1993 | 7.4 | 7.8 | 7.6 | 5.4 | 7.6 | 6.5 | 96 | 103 | 199 | 75 | 106 | 181 |
| 1996 | 7.2 | 6.7 | 7.0 | 6.8 | 6.2 | 6.5 | 101 | 103 | 204 | 86 | 90 | 176 |
| 1999 | 6.6 | 7.4 | 7.0 | 5.1 | 8.1 | 6.8 | 77 | 116 | 193 | 57 | 118 | 175 |
| 2000 | 6.3 | 5.8 | 6.0 | N/A1 | N/A1 | N/A1 | 83 | 97 | 180 | N/A1 | N/A1 | N/A1 |
| Total | 7.6 | 8.4 | 7.9 | 6.1 | 8.5 | 7.2 | 914 | 816 | 1730 | 615 | 654 | 1269 |
Table 3 Comparing those who chose psychiatry with those who chose other careers: percentages and numbers of doctors who specified whether they had definitely, probably or not really made up their minds about their first choice of long-term career at one and three years after graduation, 1974-2000

| Firmness of choice | Percentages | Numbers | ||||||
|---|---|---|---|---|---|---|---|---|
| Year 1 | Year 3 | Year 1 | Year 3 | |||||
| Psychiatry | Other careers | Psychiatry | Other careers | Psychiatry | Other careers | Psychiatry | Other careers | |
| Definitely | 30.0 | 28.2 | 52.8*** | 46.9 | 278 | 5846 | 455 | 7695 |
| Probably | 48.3 | 49.0 | 37.8 | 41.2 | 448 | 10 154 | 326 | 6760 |
| Not really | 21.7 | 22.8 | 9.4 | 11.9 | 201 | 4738 | 81 | 1959 |
| Total | 100.0 | 100.0 | 100.0 | 100.0 | 927 | 20 738 | 862 | 16 414 |
Women choosing psychiatry
Women comprised 27.3% (530 out of 1940) of the total cohort of respondents of 1974 and 56.1% (1669 out of 2975) of those of 2000. Of the doctors who chose psychiatry as their first choice of career in year 1, women comprised 32.5% (26 out of 80) of the 1974 qualifiers and 52.5% (64 out of 122) of the 2000 qualifiers. In the cohorts of 1974 and 1999, 35.6% (21 out of 59) and 62.6% (82 out of 131) of those who chose psychiatry in year 3 were women. The figures were broadly similar when considering all choices - first, second and third - for psychiatry: in year 1, of the doctors who specified the choice of psychiatry, 33.5% (62 out of 185) of the 1974 qualifiers were women compared with 53.9% (97 out of 180) of the 2000 qualifiers. In the cohorts of 1974 and 1999, 37.0% (34 out of 92) and 67.4% (118 out of 175) of those who chose psychiatry in year 3 were women.
Choices by medical school
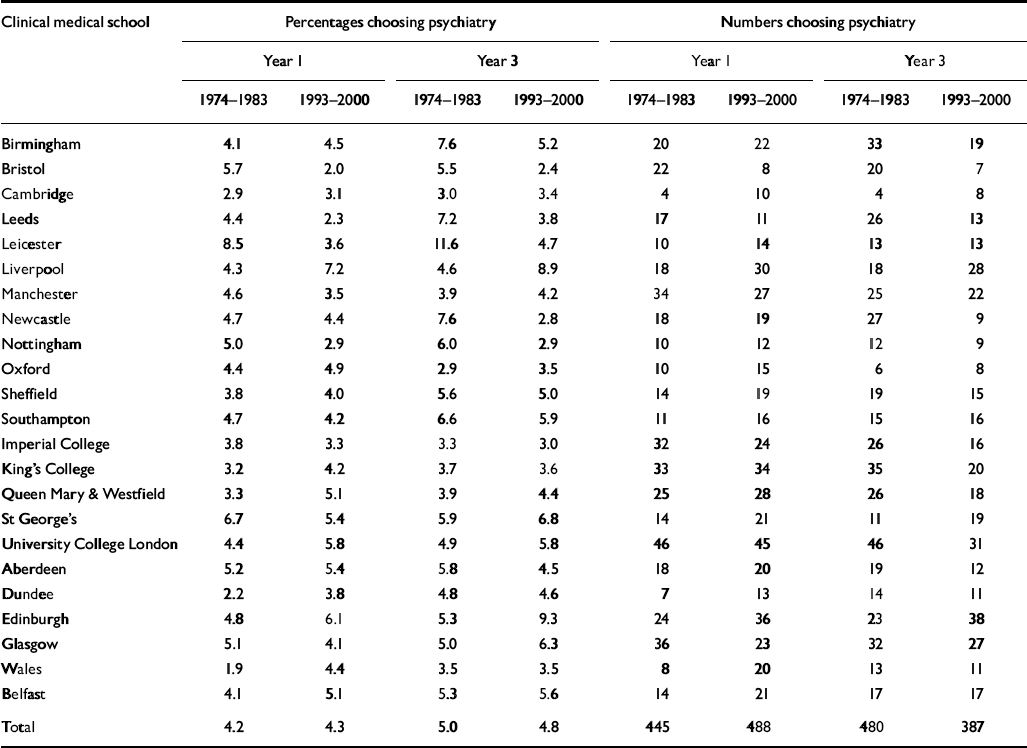
Table 4 shows first choices from each medical school. There is variation between medical schools in the percentages of their graduates who signified psychiatry as a first choice of career. To determine the significance of these observed differences, we fitted a binary logistic regression model with the choice of psychiatry as the dependent variable and gender, the year of graduation (1974-1983 or 1993-2000) and the medical school attended as categorical predictors. In year 1, there were no differences in the level of first choices for psychiatry by gender, by year of graduation or by medical school (χ2 1=2.3, χ2 1=0.4, χ2 22=31.5; P>0.05 in each case). Therefore, compared with the average of 43% across all medical schools, no school was significantly higher or lower than the national average. In year 3, fitting the same model, differences in the level of first choices for psychiatry were not significant by year of graduation (χ2 1=2.1, P>0.05) but were significant by gender (χ2 1=16.1, P<0.001), with a higher percentage of women than men choosing psychiatry, as noted above, and by medical school (χ2 22=50.8, P<0.001). In interpreting comparisons between medical schools in the model, we used a significance level of P=0.01 to take account of the fact that we made multiple comparisons across the schools. On this criterion, comparing the percentage of doctors from each medical school who chose psychiatry with the overall average of 4.9%, a significantly higher percentage of graduates from Edinburgh (7.2%) and a significantly lower percentage from Imperial College London (3.2%) chose psychiatry. Correlation analysis between the two broad time periods of 1974-1983 and 1993-2000 shows that there was no consistency across time in the percentages of graduates choosing psychiatry at each school, either in year 1 or in year 3 (r=-0.02 for year 1; r=0.09 for year 3; P>0.05 for a test of zero correlation in each case).
Table 4 Percentages and numbers of doctors from each medical school who specified psychiatry as their first choice of career at the end of the first and third years after graduation
| Clinical medical school | Percentages choosing psychiatry | Numbers choosing psychiatry | ||||||
|---|---|---|---|---|---|---|---|---|
| Year 1 | Year 3 | Year 1 | Year 3 | |||||
| 1974-1983 | 1993-2000 | 1974-1983 | 1993-2000 | 1974-1983 | 1993-2000 | 1974-1983 | 1993-2000 | |
| Birmingham | 4.1 | 4.5 | 7.6 | 5.2 | 20 | 22 | 33 | 19 |
| Bristol | 5.7 | 2.0 | 5.5 | 2.4 | 22 | 8 | 20 | 7 |
| Cambridge | 2.9 | 3.1 | 3.0 | 3.4 | 4 | 10 | 4 | 8 |
| Leeds | 4.4 | 2.3 | 7.2 | 3.8 | 17 | 11 | 26 | 13 |
| Leicester | 8.5 | 3.6 | 11.6 | 4.7 | 10 | 14 | 13 | 13 |
| Liverpool | 4.3 | 7.2 | 4.6 | 8.9 | 18 | 30 | 18 | 28 |
| Manchester | 4.6 | 3.5 | 3.9 | 4.2 | 34 | 27 | 25 | 22 |
| Newcastle | 4.7 | 4.4 | 7.6 | 2.8 | 18 | 19 | 27 | 9 |
| Nottingham | 5.0 | 2.9 | 6.0 | 2.9 | 10 | 12 | 12 | 9 |
| Oxford | 4.4 | 4.9 | 2.9 | 3.5 | 10 | 15 | 6 | 8 |
| Sheffield | 3.8 | 4.0 | 5.6 | 5.0 | 14 | 19 | 19 | 15 |
| Southampton | 4.7 | 4.2 | 6.6 | 5.9 | 11 | 16 | 15 | 16 |
| Imperial College | 3.8 | 3.3 | 3.3 | 3.0 | 32 | 24 | 26 | 16 |
| King's College | 3.2 | 4.2 | 3.7 | 3.6 | 33 | 34 | 35 | 20 |
| Queen Mary & Westfield | 3.3 | 5.1 | 3.9 | 4.4 | 25 | 28 | 26 | 18 |
| St George's | 6.7 | 5.4 | 5.9 | 6.8 | 14 | 21 | 11 | 19 |
| University College London | 4.4 | 5.8 | 4.9 | 5.8 | 46 | 45 | 46 | 31 |
| Aberdeen | 5.2 | 5.4 | 5.8 | 4.5 | 18 | 20 | 19 | 12 |
| Dundee | 2.2 | 3.8 | 4.8 | 4.6 | 7 | 13 | 14 | 11 |
| Edinburgh | 4.8 | 6.1 | 5.3 | 9.3 | 24 | 36 | 23 | 38 |
| Glasgow | 5.1 | 4.1 | 5.0 | 6.3 | 36 | 23 | 32 | 27 |
| Wales | 1.9 | 4.4 | 3.5 | 3.5 | 8 | 20 | 13 | 11 |
| Belfast | 4.1 | 5.1 | 5.3 | 5.6 | 14 | 21 | 17 | 17 |
| Total | 4.2 | 4.3 | 5.0 | 4.8 | 445 | 488 | 480 | 387 |
Factors influencing career choice
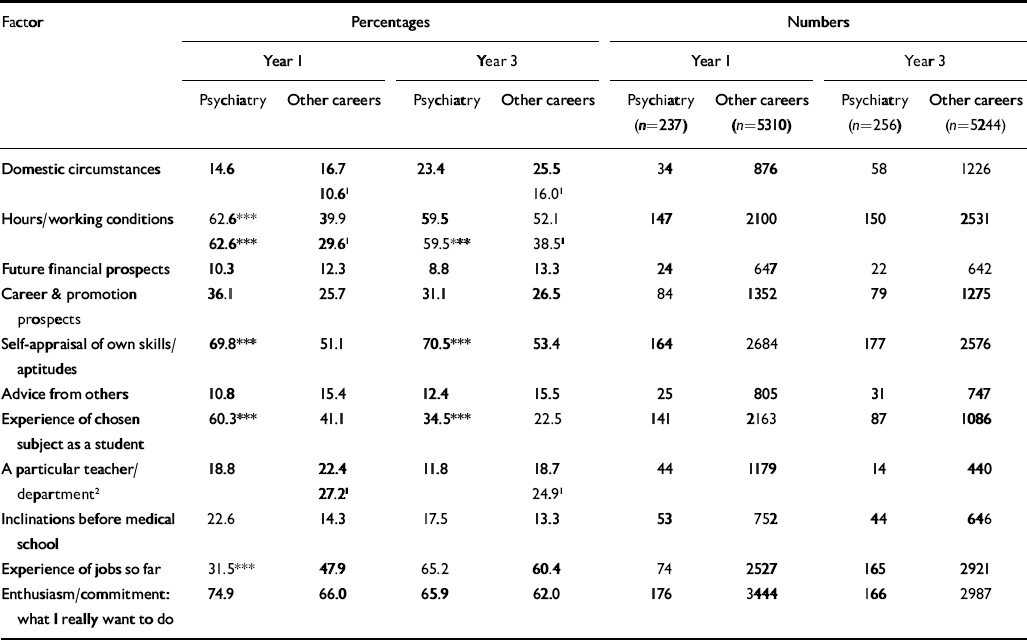
One and three years after graduation, the graduates of 1993 and 1996 were asked to rate the importance of 11 factors that may have influenced their career choices. One year after graduation, ‘enthusiasm/commitment: what I really want to do’ was rated as having influenced career choice ‘a great deal’ by 75% of respondents choosing psychiatry; a majority of those choosing psychiatry also rated as influential ‘hours and working conditions’, ‘selfappraisal of own skills/aptitudes’ and ‘experience of chosen subject as a student’ (Table 5). Each of these four factors was rated as influential by a higher percentage of those choosing psychiatry than of those choosing other careers, although the difference for ‘enthusiasm/commitment: what I really want to do’ did not attain statistical significance.
Table 5 Percentages and numbers of doctors who specified each factor as influencing greatly their choice of long-term career: graduates of 1993 and 1996
| Factor | Percentages | Numbers | ||||||
|---|---|---|---|---|---|---|---|---|
| Year 1 | Year 3 | Year 1 | Year 3 | |||||
| Psychiatry | Other careers | Psychiatry | Other careers | Psychiatry (n=237) | Other careers (n=5310) | Psychiatry (n=256) | Other careers (n=5244) | |
| Domestic circumstances | 14.6 | 16.7 | 23.4 | 25.5 | 34 | 876 | 58 | 1226 |
| 10.61 | 16.01 | |||||||
| Hours/working conditions | 62.6*** | 39.9 | 59.5 | 52.1 | 147 | 2100 | 150 | 2531 |
| 62.6*** | 29.61 | 59.5*** | 38.51 | |||||
| Future financial prospects | 10.3 | 12.3 | 8.8 | 13.3 | 24 | 647 | 22 | 642 |
| Career & promotion prospects | 36.1 | 25.7 | 31.1 | 26.5 | 84 | 1352 | 79 | 1275 |
| Self-appraisal of own skills/aptitudes | 69.8*** | 51.1 | 70.5*** | 53.4 | 164 | 2684 | 177 | 2576 |
| Advice from others | 10.8 | 15.4 | 12.4 | 15.5 | 25 | 805 | 31 | 747 |
| Experience of chosen subject as a student | 60.3*** | 41.1 | 34.5*** | 22.5 | 141 | 2163 | 87 | 1086 |
| A particular teacher/department2 | 18.8 | 22.4 | 11.8 | 18.7 | 44 | 1179 | 14 | 440 |
| 27.21 | 24.91 | |||||||
| Inclinations before medical school | 22.6 | 14.3 | 17.5 | 13.3 | 53 | 752 | 44 | 646 |
| Experience of jobs so far | 31.5*** | 47.9 | 65.2 | 60.4 | 74 | 2527 | 165 | 2921 |
| Enthusiasm/commitment: what I really want to do | 74.9 | 66.0 | 65.9 | 62.0 | 176 | 3444 | 166 | 2987 |
Experience of jobs in psychiatry became an increasingly important influence on choices made in year 3. In year 1, 23% specified that their inclinations prior to medical school had a great deal of influence on their career choice of psychiatry (Table 5). This was a higher percentage, but not significantly so, than for those who chose other careers.
We re-analysed the data on factors that influenced choice, excluding doctors whose first choice was general practice. We did so because the influences on choices for general practice tend to be different from those for hospital specialties (Reference Lambert, Goldacre and EdwardsLambert et al, 1996a ). The differences between the proportions of those choosing psychiatry and those choosing other careers who were influenced ‘a great deal’ changed substantially for three factors (Table 5). Compared with those choosing psychiatry, ‘domestic circumstances’ and ‘hours and working conditions’ were rated as influential by a smaller percentage of those choosing other careers. The influence of a particular teacher or department was rated as influential by more of those choosing other careers than those choosing psychiatry.
Ten years after graduation
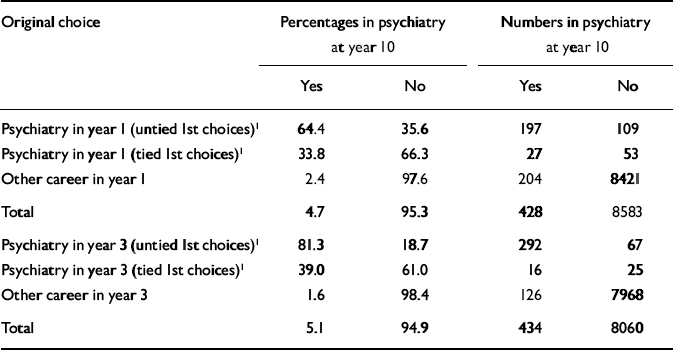
Ten years after graduation, 64% of those whose sole first choice was psychiatry in year 1 and 81% of those whose sole first choice was psychiatry in year 3 were working in psychiatry (Table 6). Graduates who specified an equal preference for a career in either psychiatry or another specialty (see Method for explanation) were half as likely as those whose sole first choice was psychiatry to be working in psychiatry ten years after graduation. Of those who were working in psychiatry ten years after graduation, 52% (224 out of 428) had chosen it in year 1 and 71% (308 out of 434) had chosen it in year 3.
Table 6 Percentages and numbers of doctors who originally chose psychiatry as a first choice (tied or untied) and were working in psychiatry ten years after qualification: 1974, 1977, 1983 and 1993 cohorts
| Original choice | Percentages in psychiatry at year 10 | Numbers in psychiatry at year 10 | ||
|---|---|---|---|---|
| Yes | No | Yes | No | |
| Psychiatry in year 1 (untied 1st choices)1 | 64.4 | 35.6 | 197 | 109 |
| Psychiatry in year 1 (tied 1st choices)1 | 33.8 | 66.3 | 27 | 53 |
| Other career in year 1 | 2.4 | 97.6 | 204 | 8421 |
| Total | 4.7 | 95.3 | 428 | 8583 |
| Psychiatry in year 3 (untied 1st choices)1 | 81.3 | 18.7 | 292 | 67 |
| Psychiatry in year 3 (tied 1st choices)1 | 39.0 | 61.0 | 16 | 25 |
| Other career in year 3 | 1.6 | 98.4 | 126 | 7968 |
| Total | 5.1 | 94.9 | 434 | 8060 |
DISCUSSION
Early career choices for psychiatry
In this study of eight graduation years of UK medical graduates between 1974 and 2000, there was little evidence of change in the percentages of medical graduates who chose careers in psychiatry. The percentage of doctors choosing psychiatry who are women has increased substantially over time: from 32% of the 1974 qualifiers to 59% of the 1999 qualifiers. This largely reflects the increasing proportion of women among entrants to medical schools. However, by year 3 a slightly but significantly higher percentage of women doctors than men expressed a choice for psychiatry as their long-term career.
In 1995 ‘Mental Health Officer’ status, which allowed psychiatrists to retire early on full pensions, was abolished. Although this may have potentially affected recruitment, we found no evidence for this: there was little difference between the percentages choosing psychiatry in 1993 and 2000.
Factors influencing career choice
Three factors had a greater influence on choices for psychiatry than on choices for other careers in both one and three years after graduation: experience of the chosen subject as a student, their own assessment of their skills and aptitudes and the anticipated hours and working conditions. The doctor's enthusiasm and commitment to the specialty was also a more influential factor for those who chose psychiatry than those making other career choices, particularly in the first year after graduation, although this difference did not reach statistical significance.
Experience of jobs undertaken ‘so far’ was less influential in year 1 for those choosing psychiatry than for those choosing other careers. This no doubt reflects the very limited exposure to the work of psychiatry in the pre-registration year. By year 3, experience of jobs undertaken so far became as important for those choosing psychiatry as it was for those making other career choices. The fact that, in responses at the end of the pre-registration year, work experience is a more important determinant of career choice for other careers than psychiatry suggests that an increase in early opportunities to work in psychiatry may have a beneficial effect on recruitment to the specialty. The new ‘foundation years’ programme (NHS Executive, 2002; Department of Health, 2003a ) in UK medicine could be an opportunity to offer experience in psychiatry to doctors at an early stage in their working careers.
The doctors' responses on their high level of enthusiasm for psychiatry, and assessment of their own skills and aptitudes, suggest that these are important motivating factors in choosing a career in psychiatry. The responses on hours and conditions of work suggest that these, too, have some influence. As new ways of working in clinical practice are implemented, including the mandatory upper limits on numbers of working hours (Department of Health, 2001), psychiatry may lose some of its perceived advantage over other medical careers in these respects. The responses on experience of the chosen subject as a student suggest that this can be an important determinant for some doctors' career choice for psychiatry.
Only one in five of those wanting a career in psychiatry cited inclinations prior to medical school as a strong influence on their choice. This was a higher percentage than for other career choices, albeit not significantly so. It is evident that specialty preferences before medical school entry are not a major determinant, generally, of doctors' eventual choice.
Ten years after graduation
It is sometimes argued that early choices of long-term career are a poor predictor of eventual career choice. However, two-thirds of those whose sole first choice was psychiatry in their pre-registration house officer year and four-fifths of those whose sole first choice was psychiatry in their third year after graduation were working in the specialty ten years after graduation. It is an interesting observation on the good predictive characteristics of early career choices that, of those who gave an early tied choice for psychiatry and a different specialty, about half as many eventually pursued psychiatry as those who specified psychiatry as their sole first choice.
Thus, a clear early choice for psychiatry was a strong indication of a subsequent career in the specialty. Concerns that the reform to the training grades, and perhaps particularly to the senior house officer grade (NHS Executive, 2002; Department of Health, 2003a ) will force young doctors into specialist schemes too soon or prematurely may be unfounded with respect to psychiatry, as many of those who became psychiatrists chose to do so within three years after graduation. Equally, however, flexibility needs to remain for the minority, still reasonably large in number, who decide to pursue psychiatry later in their junior years.
Future prospects
Responses on career influences indicate the importance of a real wish to practise psychiatry. They also suggest that exposures to positive experiences of psychiatry as a medical student and in the early postgraduate years are important. The number of new medical graduates who choose psychiatry has been lower than that needed to make the UK self-sufficient in the training of psychiatrists. In general, the UK has trained too few doctors for its own requirements for decades (Reference GoldacreGoldacre, 1998) and a number of specialties, including psychiatry, have experienced a shortfall of home-trained consultants as a consequence. The percentage of UK qualifiers who specified an early career choice for a long-term career in psychiatry has been almost stable over the past 25 years. Given a stable percentage of newly qualified doctors who want a career in psychiatry, an expansion of the number of UK-trained recruits to psychiatry can only come from the expansion of medical student intake. Efforts to increase the percentage of newly qualified doctors who enter psychiatry would probably require a specific, focused and concerted recruitment strategy.
Clinical Implications and Limitations
CLINICAL IMPLICATIONS
-
▪ There have been no significant changes between 1974 and 2000 in the proportion of newly qualified doctors who specify that psychiatry is their long-term career choice.
-
▪ Any major increase in the number of UK-trained doctors entering psychiatry is more likely to come from the expansion of medical school intake than from a major increase in the percentage of doctors who choose psychiatry.
-
▪ None the less, improving the experience of psychiatry at medical school, and giving junior doctors good experiences of working in psychiatry in their early years, may improve recruitment into psychiatry.
LIMITATIONS
-
▪ The study is restricted to doctors who trained as medical students in the UK in particular years of graduation.
-
▪ As with all questionnaire surveys, non-responder bias is a possibility.
-
▪ Postal questionnaire surveys may not capture some of the subtleties of views about psychiatry and we did not ask those who did not choose psychiatry whether
Acknowledgements
We are very grateful to all the doctors who participated in the surveys. We. thank Karen Hollick for administering the surveys, Janet Justice and Alison. Stockford for data preparation and Jean Davidson for programming support. The. UK Medical Careers Research Group, and the Unit of Health-Care Epidemiology, are funded by the UK Department of Health.


eLetters
No eLetters have been published for this article.