


Over the past two decades, quality of life has become increasingly important in psychiatric research and is now considered a key outcome measure. However, several core issues remain unresolved, thereby limiting the practical application of its measurement.
Lower levels of quality of life among those with serious mental illness compared with the general population have been demonstrated. Most studies have investigated subjective quality of life and have suggested a minor predictive role of socio- demographic variables (Reference Lam and RosenheckLam & Rosenheck, 2000; Reference Ruggeri, Bisoffi and FontecedroRuggeri et al, 2001). Depressive symptoms, whether rated by the clinician or by the individual (Reference Lam and RosenheckLam & Rosenheck, 2000; Reference Bonicatto, Dew and ZaratieguiBonicatto et al, 2001; Reference Huppert, Weiss and LimHuppert et al, 2001; Reference Kolvumaa-Honkanen, Honkanen and AntikainenKolvumaa-Honkanen et al, 2001), anxiety and negative symptoms (Reference Ho, Nopoulos and FlaumHo et al, 1998; Reference Bow-Thomas, Velligan and MillerBow-Thomas et al, 1999) are fairly good predictors of poorer quality of life over time, whereas positive affective balance and higher self-esteem are predictors of higher quality of life (Reference Ruggeri, Bisoffi and FontecedroRuggeri et al, 2001). To date there are few studies of objective quality of life, few longitudinal studies (Reference SkantzeSkantze, 1998; Reference Taylor, Leese and ClarksonTaylor et al, 1998; Reference Priebe, Roeder-Wanner and KaiserPriebe et al, 2000; Reference Huxley, Evans and BurnsHuxley et al, 2001; Reference Lam and RosenheckLam & Rosenheck, 2000), and no studies of the relative effect of these indicators and their role in predicting objective and subjective quality of life in the various life domains. Most studies have major limitations because of small sample size, short time intervals and assessment of subjective quality of life only.
The aim of this study was to identify the factors that clinicians, evaluators and service planners should focus on to improve the quality of life of those with mental illness. Changes in objective and subjective quality of life were investigated at two follow-up assessments (after 2 and 6 years) to identify predictors of change in each individual life domain, using a multiwave follow-up design and a comprehensive set of variables as putative predictors. The predictive power of baseline characteristics (variability between subjects) was differentiated from that owing to changes occurring over time (variability within subject across time) in an attempt to identify important targets for interventions.
METHOD
Setting
This study was conducted in South Verona, Italy (approximately 100 000 inhabitants), an area that includes part of the city of Verona and two neighbouring small towns. The main agency providing psychiatric care for the adult population of this region is the South Verona community mental health service, which is run by the Section of Psychiatry and Clinical Psychology, Department of Medicine and Public Health of the University of Verona. The South Verona community mental health service provides a comprehensive and well-integrated service, which includes in-patient care, day care, rehabilitation, out-patient care, home visits, a 24-h emergency service and residential facilities (three apartments and one hostel) for long-term patients. This range of services ensures continuity of care through the different phases of treatment and across the various components of the service. The South Verona Psychiatric Case Register covers the same geographic area and collects demographic, diagnostic and service utilisation data on all patients seen by the service (Reference Tansella, Amaddeo, Burti, Goldberg and ThornicroftTansella et al, 1998).
Design
Data were collected as part of a study assessing the outcome of care provided by the community-based service of South Verona: the South Verona Outcome Project. The design, methodology and other results of the study have been reported elsewhere (Ruggeri et al, Reference Ruggeri, Biggeri and Rucci1998, Reference Ruggeri, Bisoffi and Fontecedro2001, Reference Ruggeri, Goldberg and Pacati2003a ; Lasalvia et al, Reference Lasalvia, Ruggeri and Mazzi2000, Reference Lasalvia, Ruggeri and Santolini2002). Briefly, the study included all individuals over 15 years of age who were seen by a psychiatrist or a psychologist in a 3-month period (1 October to 31 December 1994). Those seen only in the accident and emergency department, on a medical ward with no other psychiatric follow-up, those not suitable for administration of standardised instruments, and those with a severe cognitive deficit were excluded from the study. Individuals were assessed at baseline (T0) and after 2 (T1) and 6 years (T2); assessments included those no longer receiving treatment. Information was obtained from the key professional (assessment of psychopathology, disability, functioning), from the individuals themselves (assessment of quality of life, self-esteem, affect balance and satisfaction with service), and from the Psychiatric Case Register.
Measures
Quality of life was measured using the Lancashire Quality of Life Profile (LQoLP), developed from Lehman's scale (Reference OliverOliver, 1991). This is an interviewer-administered questionnaire inquiring about objective life circumstances and subjective life satisfaction. It consists of 164 items which cover nine domains-work/education, leisure, religion, finances, living situation, legal/safety, family relations, social relations and health - and includes subjective ratings of overall well-being. Each section assesses objective and subjective quality of life separately: the former items are rated on a varying scale; the latter are rated on a seven-point Likert scale (1=my life could not be worse; 7=my life could not be better). The LQoLP includes the Affect Balance Scale (Reference BradburnBradburn, 1969), which investigates psychological well-being by assessing the presence of negative and positive feelings, and the Self-Esteem Scale (Reference RosenbergRosenberg, 1965), which investigates individuals' views about themselves. Each scale comprises ten items, with categorical yes/no responses. Construct, content and criterion validity, test-retest reliability and internal consistency of the LQoLP are satisfactory (Reference Oliver, Huxley and PriebeOliver et al, 1997; Reference Gaite, Vázquez-Barquero and ArrizabalagaGaite et al, 2000).
Assessments of psychopathology, disability and functioning were performed by a professional, a psychiatrist or psychologist, using the Brief Psychiatric Rating Scale (BPRS) expanded version (Reference Ventura, Green and ShanerVentura et al, 1993), eight items from the social roles section of the Disability Assessment Schedule (DAS-II; World Health Organization, 1988), and the Global Assessment of Functioning scale (GAF; Reference Endicott, Spitzer and FleissEndicott et al, 1976). In addition to the LQoLP, patients were asked to complete the Verona Service Satisfaction Scale (VSSS; Reference Ruggeri, Dall'Agnola and AgostiniRuggeri et al, 1994). All scales were the official, validated Italian versions. Primary clinicians were trained in the use of the observer-rated scales and achieved interrater reliability of at least 0.70 (intraclass correlation coefficient) (Reference Ruggeri, Bisoffi and FontecedroRuggeri et al, 2001). For self-administered scales, test-retest was performed in a subsample and showed good levels of stability. A research worker assisted in the completion of the questionnaires when necessary. Individuals were only interviewed after informed consent had been gained. Research staff explained the purpose of the study, gave full details in writing and made it clear that participation was entirely voluntary. Potential participants were told that they could choose whether to participate or not, or to participate and withdraw, without any detriment to their clinical care. Confidentiality was preserved.
Demographic characteristics, time since the first contact with the service, and diagnostic and service utilisation data for the previous year were extracted from the Psychiatric Case Register. Diagnoses were based on ICD-10 (World Health Organization, 1993) and grouped in six categories as follows: schizophrenia and other functional psychoses; severe affective disorders; depression without psychotic symptoms; neurotic and somatoform disorders; personality disorder; and other diagnoses. The clinicians making the diagnoses were formally trained in ICD coding. An exercise performed with the staff of four European case registers demonstrated this grouping system to be reliable across centres (Reference Sytema, Giel and ten HorneSytema et al, 1989). Service utilisation data included the number of out-patient contacts, in-patient admissions, sheltered living and day-hospital contacts.
Statistical analyses
In order to reduce the number of LQoLP objective variables, an exploratory factor analysis using principal component extraction was first conducted on 13 objective items and 4 scales (obtained by combining objective items in the domains of leisure, personal relations, problems with physical illness and problems with mental illness) for the cohort at T0 (n=261). The full sample was used to maximise the possibility of detecting latent quality of life constructs, as in a previous study (Reference Ruggeri, Bisoffi and FontecedroRuggeri et al, 2001). Because objective variables were measured with different scales, they were first transformed into Z-scores. The number of factors retained was determined by a scree plot of eigenvalues in conjunction with the criterion of interpretability of the factor solution. At T0 five factors were found with relatively high eigenvalues; with Varimax rotation, three interpretable objective quality of life factors were obtained. We retained only items loading with absolute values greater than 0.4. An identical factor analysis was conducted on T1 and T2 samples, using all individuals with complete evaluations at each follow-up to maximise the possibility of detecting latent dimensions, while maintaining an adequate balance of test items to subjects.
To explore longitudinal predictors in objective and subjective quality of life domains, we used a series of random-effects models in which trends of quality of life over time are modelled by linear regression equations, with different possible intercepts for different individuals (Reference Everitt and DunnEveritt & Dunn, 1991; Reference Brown and PrescottBrown & Prescott, 1999; Reference Leyland and GoldesteinLeyland & Goldestein, 2003). Each domain was, in turn, the dependent variable. Independent variables were: the assessment occasion at which the quality of life domain was measured; time-invariant covariates, i.e. personal ‘intrinsic’ characteristics assessed at baseline which do not change with time (demographics and diagnosis); and time-varying covariates, i.e. individual characteristics which may change in time (years since the first contact with the service, being in contact with the community mental health service, total mean BPRS score, total mean DAS score, GAF score, typology of service utilisation, total mean VSSS score, affect balance, self-esteem). Cross-sectional bivariate correlations between each quality of life domain and the independent variables were explored in order to verify that they were negligible with respect to longitudinal variables (data available from the authors). Interactions with time were explored for those predictors with significant effects in the estimated models.
Since each individual was assessed on three occasions, the observations form a hierarchical structure, with repeated measurements nested within subjects. This structure generated a correlation pattern among the repeated measures from each individual (variance within subjects across time). The sample included participants with a wide range of personal characteristics at baseline (variance between subjects). The random-effects models take into consideration both the within- and the between-subject variability and discriminate their respective roles. They comprise both a fixed and a random part: the fixed part, by estimating regression coefficients, shows which personal characteristics (predictors) affect quality of life over time; the random part identifies the proportion of variance explained by the within-subject across-time and between-subject variations, respectively. The total variability of quality of life scores explained by the predictors is estimated by R 2 overall.
Different patterns of correlation among the LQoLP repeated measures from each individual were explored by estimating models with different correlational patterns: the simplest was ‘independence’ (all correlations are zero), the most complex was ‘unstructured’ (all correlations are different). As a compromise between the unrealistic situation of independent data and that in which all parameters must be estimated, we assumed an ‘exchangeable’ structure, i.e. all correlations are equal. Final models reported in this paper were estimated using the Stata 7 ‘xtreg,re’ command.
Random-effects models were also applied to analyse linear trends in LQoLP objective and subjective continuous domains over time, with time as the only fixed effect (Stata 7 ‘xtreg,re’ command). Linear trends in LQoLP objective and subjective dichotomous domains over time were explored by means of the Cuzick test (Reference CuzickCuzick, 1985) (Stata 7 ‘nptrend’ command).
All analyses were carried out using Intercooled Stata 7 for Windows.
RESULTS
Characteristics of the sample
The characteristics of the 261 participants who completed the entire set of instruments at baseline are presented in Table 1.
Table 1 Characteristics of the sample at baseline (n=261) with regard to the independent variables (demographics, diagnosis, psychopathology, disability, functioning, affect balance, self-esteem, service utilisation and service satisfaction) which have been entered in the random-effects models
| Characteristic | |
|---|---|
| Gender: female (%) | 64.8 |
| Age, years: mean (s.d.) | 45.7 (15.6) |
| Higher education (%) | 22.9 |
| ICD-10 diagnostic groups (%) | |
| Schizophrenia1 | 18.8 |
| Affective disorder2 | 8.4 |
| Depression without psychotic symptoms3 | 30.7 |
| Other neurosis4 | 18.8 |
| Personality disorder5 | 10.7 |
| Other | 12.6 |
| Time since first contact with service, years: mean (s.d.) | 6.0 (5.9) |
| BPRS total score (1=no symptoms, 7=very severe symptoms): mean (s.d.) | 1.5 (0.4) |
| DAS total score (0=no disability, 5=maximum disability): mean (s.d.) | 0.7 (0.8) |
| GAF score (0=very severe dysfunction, 90=very good functioning): mean (s.d.) | 61.6 (16.1) |
| Admitted to psychiatric hospital (%) | 11.5 |
| Attending day hospital (%) | 17.2 |
| Out-patient contacts: mean (s.d.) | 20.3 (28.6) |
| VSSS total score (1=terrible, 5=excellent): mean (s.d.) | 3.9 (0.5) |
| Affect balance (minimum=0, maximum=10): mean (s.d.) | 5.0 (2.6) |
| Self-esteem (minimum=0, maximum=10): mean (s.d.) | 5.8 (3.0) |
Figure 1 is a flow diagram of follow-up assessments. Responders at the 2-year follow-up were older than non-responders (46.9 v. 42.6 years, P<0.05, Mann-Whitney U-test), more likely to be single (43.2% v. 12.7%, P<0.05, χ2-test) and had a longer average time since first contact with the service (6.5 v. 4.8 years, P<0.01, Mann-Whitney U-test). Responders at the 6-year follow-up were more likely to be single than non-responders (1.7% v. 24.3%, P<0.05, χ2-test) and had a lower number of voluntary admissions in the previous year (0.24 v. 0.98, P<0.05, Mann-Whitney U-test).
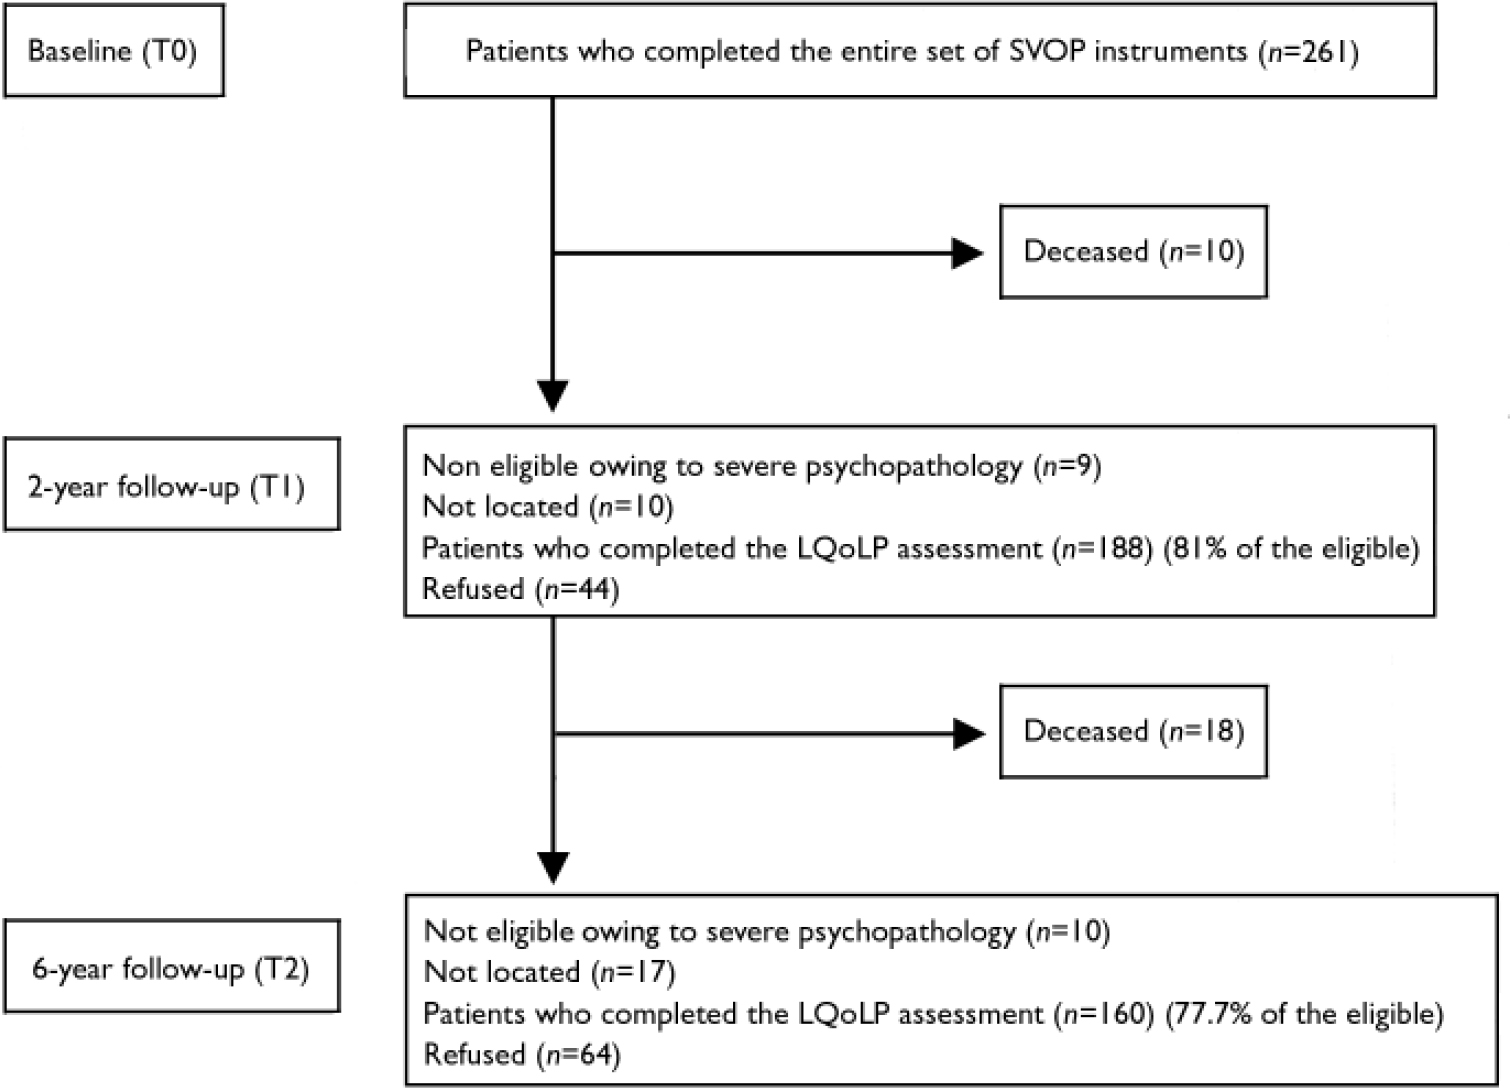
Fig. 1 Patient flow diagram; SVOP, South Verona Outcome Project; LQoLP, Lancashire Quality of Life Profile.
Thirty-six per cent of the participants had not been in contact with the service in the previous 6 months (the 2-year follow-up assessment) and were considered to be no longer in contact. At 6 years, a further 29.5% had ceased contact. Finally, 7.4% of those who had stopped attending after 2 years had re-attended the service.
There were 135 participants that completed all instruments at baseline and both follow-up assessments. They differed from the rest of the original cohort in terms of a longer time since first contact with psychiatric services (6.6 v. 5.3 years, P<0.01, Mann-Whitney U-test) and had a higher rate of attendance at day hospital (33.3% v. 30.3%, P<0.05, χ2-test).
Objective quality of life
At baseline, 35% of our sample was employed, working for a mean of 29 h/week (range 4-55), with an average salary of €671/month (range 7.75-774.70); 50.6% were housewives or retired; 14.7% were unemployed and 33.3% of these received a disability pension. Of our sample, 5% lived in sheltered accommodation; 73% were living with their family, on average living with two relatives; 44.4% were married; 77% had daily contacts with their relatives. Four per cent had been accused of a crime and 10.5% had been victims of violence during the previous year, with similar percentages for individuals with and without psychosis. With regard to health, 58.6% of those in our sample had a physical illness. Twenty-four per cent had been admitted to hospital in the previous year for this problem and in 14.6% of these the illness had resulted in a physical disability. With regard to social relations, 58% reported having a close friend who, in 60% of cases, had provided some help when needed.
Objective quality of life in the cohort tended to be stable over the two follow-up assessments. Of the objective quality of life domains assessed, a clear-cut and progressive improvement with time was found only in the domains related to working hours, earnings, and problems with mental illness. Conversely, the quality of life as assessed by leisure activities, meeting friends and the proportion accused of a crime tended to fluctuate.
In the factor analysis of the T0 sample (n=261), three interpretable factors were responsible for 31% of the total variance. Factor 1 denoted the construct work/income and had significant loadings for hours of work per week, earnings per month, and family income per month. Factor 2 represented leisure/social relations and had significant loadings for leisure activities, personal relations and meeting a friend in the past week. Finally, factor 3 included items related to relationship with relatives such as frequency of contacts with relatives and living with the family of origin. No items loaded more than one factor. The same three latent constructs were identified at T1 (n=188) and T2 (n=160), with minor changes in factor loading structures (see Table 3). Items such as months in current accommodation, being a victim of violence or accused of a crime in the past year, physical disability, problems with physical or mental illness, and frequency of religious service attendance did not significantly load any factor.
Table 2 Trends in subjective and objective quality of life domains in the cohort with complete assessment at all three points (n=135). Mean values (s.d.) or percentages are reported, together with P values for linear trend in time (continuous variables: random-effects models with time as the only fixed effect, Stata 7 ‘xtreg,re’ command; dichotomous variables: Cuzick test, Stata 7 ‘nptrend’ command)
| Domains | Time point | P | ||
|---|---|---|---|---|
| T0 | T1 | T2 | ||
| LQoLP objective items/scales | ||||
| Hours of work/week: mean (s.d.) | 25.0 (16.4) | 28.5 (15.8) | 34.1 (12.6) | 0.01 |
| Earnings/month, €: mean (s.d.) | 554.0 (455.0) | 624.0 (401.0) | 726.0 (359.0) | <0.01 |
| Family income, €: mean (s.d.) | 622.0 (431.0) | 615.0 (410.0) | 668.0 (547.0) | 0.82 |
| Leisure activities/2 weeks: mean (s.d.) | 2.9 (0.7) | 2.8 (0.8) | 2.8 (0.8) | 0.25 |
| Personal relations: mean (s.d.) | 1.6 (1.2) | 1.5 (1.1) | 1.5 (1.1) | 0.80 |
| Met friend in past week (%) | 63.6 | 57.7 | 51.2 | 0.04 |
| Unsheltered living (%) | 90.4 | 92.4 | 92.4 | 0.58 |
| Victim of violence in past year (%) | 6.7 | 9.1 | 7.0 | 0.01 |
| Accused of a crime in past year (%) | 3.7 | 1.5 | 8.5 | 0.83 |
| Physical disability (%) | 17.5 | 21.4 | 19.7 | 0.60 |
| Problems with physical illness: mean (s.d.) | 1.3 (0.9) | 1.3 (1.1) | 1.3 (1.1) | 0.80 |
| Problems with mental illness: mean (s.d.) | 1.9 (0.8) | 1.6 (0.9) | 1.6 (0.9) | <0.01 |
| LQoLP subjective domains | ||||
| General well-being: mean (s.d.) | 4.2 (1.6) | 4.3 (1.7) | 4.4. (1.6) | <0.01 |
| Work/study: mean (s.d.) | 4.0 (1.7) | 4.1 (1.7) | 4.4 (1.6) | <0.01 |
| Leisure: mean (s.d.) | 4.4 (1.2) | 4.5 (1.2) | 4.6 (1.1) | 0.01 |
| Religion: mean (s.d.) | 4.8 (1.3) | 4.9 (1.3) | 4.9 (1.3) | 0.63 |
| Finances: mean (s.d.) | 3.9 (1.6) | 4.0 (1.1) | 4.2 (1.5) | 0.01 |
| Living situation: mean (s.d.) | 4.6 (1.2) | 4.8 (1.1) | 4.9 (1.0) | <0.01 |
| Legal situation: mean (s.d.) | 4.7 (1.3) | 4.7 (1.4) | 4.6 (1.4) | 0.20 |
| Family relations: mean (s.d.) | 4.7 (1.4) | 4.8 (1.4) | 5.1 (1.2) | <0.01 |
| Social relations: mean (s.d.) | 4.5 (1.6) | 4.6 (1.5) | 4.8 (1.4) | 0.01 |
| Health: mean (s.d.) | 4.6 (1.2) | 4.6 (1.2) | 4.9 (0.9) | <0.01 |
Table 3 Objective LQoLP: factor loading matrix for 13 items and 4 scales in the cross-sectional samples at T0 (n=261), T1 (n=188) and T2 (n=160). Only item loadings with absolute values greater than 0.4 are reported
| LQoLP objective items/scales | T0 | T1 | T2 | ||||||
|---|---|---|---|---|---|---|---|---|---|
| Factor 1 Work/income | Factor 2 Leisure/social relations | Factor 3 Relationship with relatives | Factor 1 Work/income | Factor 2 Leisure/social relations | Factor 3 Relationship with relatives | Factor 1 Work/income | Factor 2 Leisure/social relations | Factor 3 Relationship with relatives | |
| Hours of work/week | 0.4 | 0.8 | 0.7 | ||||||
| Earnings/month (€) | 0.9 | 0.9 | 0.8 | ||||||
| Family income (€) | 0.9 | 0.7 | 0.6 | ||||||
| Leisure activities/2 weeks | 0.4 | 0.4 | 0.4 | ||||||
| Personal relations | 0.7 | 0.7 | 0.7 | ||||||
| Met friend in past week | 0.8 | 0.8 | 0.8 | ||||||
| Living with family | 0.6 | 0.8 | 0.6 | ||||||
| Frequency of family contacts | — | 0.6 | 0.8 | 0.7 | |||||
| Unsheltered living | 0.6 | ||||||||
| Number of people living in home | 0.4 | ||||||||
| Percentage of variance | 12% | 9% | 10% | 15% | 7% | 9% | 13% | 9% | 9% |
Subjective quality of life
The mean scores of the subjective domains at baseline ranged from 3.90 to 4.80. Satisfaction with personal financial situation was the domain with the lowest score and satisfaction with religion was the domain with the highest score. In six domains out of ten, a mean score higher than 4.50 was found, indicating substantial life satisfaction at baseline.
As shown in Table 2, a linear trend towards an improvement was detected in the majority of domains, and reached significance in eight domains out of ten (well-being, work, leisure, finances, living situation, family relations, social relations, health), with a more clear-cut improvement in satisfaction with life at 6 years follow-up.
Predictors of quality of life change
Objective quality of life
Table 4 presents a series of random-effects models, with each objective quality of life factor treated as a dependent variable.
Table 4 Objective LQoLP: random-effects models. Only fixed-effect coefficients (s.e.) significant at 0.05 for predictors are reported (n=261)
| Dependent variables | |||
|---|---|---|---|
| Factor 1 Work/income | Factor 2 Leisure/social relations | Factor 3 Relationship with relatives | |
| R 2 overall | 15.7% | 14.7% | 15.7% |
| Predictors | |||
| Fixed part | |||
| Intercept | 1.26 (0.62) | −0.67 (0.65) | −1.55 (0.60) |
| Gender (female) | −0.53 (0.13) | −0.30 (0.12) | |
| Age (older) | −0.01 (0.00) | ||
| Marital status (married) | 0.33 (0.13) | −0.54 (0.12) | |
| Educational level (higher) | 0.54 (0.15) | ||
| Being in contact with CMHS | −0.41 (0.13) | ||
| BPRS total score | 0.40 (0.15) | ||
| DAS total score | −0.28 (0.08) | ||
| Affective balance | 0.07 (0.02) | ||
| Random part | |||
| Within-subject across-time variance | 0.63 | 0.84 | 0.56 |
| Between-subject variance | 0.78 | 0.39 | 0.64 |
| Percentage of variance owing to random intercept1 | 55% | 32% | 53% |
The variance explained by factor 1, assessing work/income, factor 2, assessing leisure/social relations, factor 3, assessing contacts with relatives (mainly the family of origin) was low (15%-16%).
Being female, unmarried, having a lower educational level, and being in contact with psychiatric services during follow-up predicted a lower quality of life with respect to work and income over time. Being female and older, and having a higher level of disability and negative affect balance predicted a worse organisation of leisure time and social relations. Being married and having less severe psychopathology predicted a lower number of contacts with the family of origin, indicating greater autonomy. The between-subject variance at baseline for factors 1 and 3 explained about 50% of the total variance; this figure was 32% for factor 2. Diagnosis per se had no impact on quality of life with respect to both factors 1 and 3.
Subjective quality of life
As shown in Table 5, the variance explained by our models for well-being, leisure activities and health satisfaction was 40% or more, 29% for social relations, 26% for work/study and around 20% in the other domains.
Table 5 Subjective LQoLP: random-effects models. Only fixed-effect coefficients (s.e.) significant at 0.05 for predictors are reported (n=261)
| Dependent variables | ||||||||||
|---|---|---|---|---|---|---|---|---|---|---|
| Well-being | Work/study | Leisure | Religion | Finances | Living situation | Legal situation | Family relations | Social relations | Health | |
| R 2 overall | 45.6% | 25.7% | 40.8% | 17.8% | 19.8% | 22.2% | 18.6% | 19.9% | 29.0% | 44.1% |
| Predictors | ||||||||||
| Fixed part | ||||||||||
| Intercept | 2.23 (0.62) | 1.73 (0.04) | 1.94 (0.53) | 2.24 (0.72) | 0.61 (0.83) | 2.98 (0.58) | 3.95 (0.72) | 3.62 (0.71) | 1.78 (0.71) | 2.07 (0.51) |
| Age (older) | 0.02 (0.00) | 0.01 (0.00) | ||||||||
| Gender (female) | 0.23 (0.01) | |||||||||
| Unemployment (v. others) | −1.07 (0.21) | −0.68 (0.21) | ||||||||
| Retired | 0.37 (0.15) | |||||||||
| Educational level | −0.28 (0.12) | −0.39 (0.15) | ||||||||
| (higher education) | ||||||||||
| Duration of illness | −0.03 (0.01) | |||||||||
| BPRS total score | −0.35 (0.16) | −0.47 (0.18) | −0.43 (0.13) | |||||||
| GAF total score | −0.01 (0.00) | −0.01 (0.00) | ||||||||
| VSSS total score | 0.30 (0.10) | 0.43 (0.14) | 0.48 (0.08) | 0.51 (0.11) | 0.43 (0.13) | 0.46 (0.09) | 0.32 (0.01) | 0.33 (0.11) | 0.54 (0.11) | 0.60 (0.08) |
| Affect-balance scale | 0.20 (0.02) | 0.10 (0.03) | 0.11 (0.02) | 0.05 (0.02) | 0.14 (0.03) | 0.06 (0.02) | 0.07 (0.02) | 0.10 (0.02) | 0.10 (0.01) | |
| Self-esteem scale | 0.13 (0.02) | 0.07 (0.03) | 0.11 (0.01) | 0.05 (0.02) | 0.07 (0.02) | 0.13 (0.02) | 0.08 (0.02) | 0.11 (0.02) | 0.09 (0.01) | |
| Random part | ||||||||||
| Within-subject across-time | 0.87 | 1.67 | 0.59 | 1.02 | 1.31 | 0.71 | 0.95 | 0.90 | 0.90 | 0.51 |
| variance | ||||||||||
| Between-subject variance | 0.23 | 0.36 | 0.23 | 0.45 | 0.78 | 0.29 | 0.60 | 0.71 | 0.59 | 0.26 |
| Percentage of variance | 21% | 18% | 28% | 30% | 37% | 30% | 39% | 44% | 39% | 34% |
| owing to random intercept1 | ||||||||||
Measures of psychological status such as affect balance and self-esteem were important predictors in almost all subjective domains, together with satisfaction with the service. For individual VSSS domains, satisfaction with the intervention received and with service efficacy had the highest predictive power. Specifically, lower satisfaction with interventions predicted lower life satisfaction in the areas of work/study, leisure activities and social life. Lower satisfaction with service efficacy predicted a lower quality of life in social relations and health (data available from the authors).
Among the socio-demographic characteristics, being male had a negative effect on satisfaction with leisure activities. Being unemployed predicted lower satisfaction with work and financial situation, while being retired, a student or housewife had a positive influence on satisfaction with family relations. Finally, having a higher educational level was a negative predictor of general well-being and satisfaction with religion. Diagnosis per se had no impact on satisfaction with life, but higher psychopathology predicted a lower satisfaction with general well-being, legal situation and health. The BPRS individual sub-scales showed that higher anxiety and depressive symptoms were related to worse quality of life in all domains, whereas more positive symptoms predicted greater dissatisfaction with legal situation (data available from the authors). Duration of illness had no impact on quality of life, other than a longer duration being associated with a poorer legal situation.
The variability owing to between-subject variance at baseline ranged from 17% to 44%. This demonstrates that, in contrast to objective quality of life, the majority of the variability of subjective domains was owing to variance within patients across time.
DISCUSSION
This prospective follow-up study incorporated advanced methodological recommendations (Reference Gibbons, Hedeker and ElkinGibbons et al, 1993) and therefore has several advantages over previous studies on quality of life. These may be summarised as follows: (a) it was a multi-wave follow-up design; (b) it was conducted with an epidemiological representative cohort of patients treated in a ‘real world’ and well-established community-based mental health service; (c) it differentiated between objective and subjective quality of life; (d) it included a wide set of predictors rated by clinicians and participants and assessed at the same time, including demographic, clinical and social variables, as well as psychological measures and satisfaction with the service; (e) it used a statistical methodology suitable for the analysis of longitudinal data, which permits an estimate of the amount of variance explained by ‘intrinsic’ individual characteristics (between subjects) and by ‘changing’ individual characteristics (within subject across time). Moreover, random models are more robust than traditional regression models when data are missing on one or more of the assessment occasions (Reference Crowder and HandCrowder & Hand, 1990). To our knowledge this is one of the few longitudinal studies in psychiatry to use this statistical technique.
Objective and subjective quality of life status and changes over time
Participants rarely experienced adverse events such as legal and safety problems or physical disability; only a few were living in sheltered accommodation. In these areas, the quality of life remained stable over time. The condition of the overall cohort in the other objective domains, such as leisure activities and personal relations, tended to fluctuate. Subjective quality of life was fairly good across most domains in the cohort, with the exception of work and finances, where less satisfactory conditions were detected at baseline. Changes occurring over time in the whole cohort suggest improvement in key areas of life, such as health, social and family relations, leisure activities and finances, as well as stability in the other areas.
When exploring changes occurring at the individual patient level a very complex picture was found, with substantial proportions experiencing some change in objective and even more frequently in subjective quality of life (data available from the authors).
However, these findings indicate no overall deterioration of objective quality of life in a prevalent sample of treated psychiatric patients. Interpretation of these results would, however, benefit from a comparison with the general population and those with a mental disorder but without comprehensive, community-based treatment. At present these data are not available.
Predictors of objective and subjective quality of life
Overall, our data showed a completely different prediction pattern for objective and subjective quality of life; this emphasises the need for assessing both aspects. It is noteworthy that, after adjustment for other variables, diagnosis had no effect on either objective or subjective quality of life. This confirms previous results that, at variance with the pessimistic prognostic view predominating in the past, the quality of life in severe mental disorders such as schizophrenia can be heterogeneous (Reference Ruggeri, Lasalvia and TansellaRuggeri et al, 2003b ). A comparison with findings obtained with other systems of care could help to determine to what extent this is related to the characteristics of service provision.
Objective quality of life
Our comprehensive model did not explain much variance of objective quality of life scores. Two main reasons for this are: (a) an unsatisfactory conceptualisation reflected in flaws and ambiguities in the way the LQoLP explores objective quality of life; (b) the high variability in the impact of mental disorders on individuals' objective life condition. Another limitation of our findings is that the factorial structure has been tested in a single dataset and should be replicated in other databases.
However, our model has identified a series of characteristics which, even if not good predictors, can be considered vulnerability factors (i.e. factors that affect risk only in the presence of another provoking factor) for a worse objective quality of life over time, especially in the areas of work, income, independence from family, number of leisure activities and social relations. Specifically, socio-demographic variables such as being female, unmarried, having a lower educational level and older age are the major vulnerability factors, but have differential effects depending on the life domain assessed. Other vulnerability factors indicated that those who continued to attend the psychiatric service were more likely to be on a low income; those with greater disability and a more negative affect balance had fewer leisure and social activities; and those who did not have their own family and who had greater psychopathology tended to be more dependent on their family of origin.
The important influence of variance between individuals at baseline on the future objective quality of life is indicated by our results.
What are the possible reasons for the high variability found in the predictive models for objective quality of life? Given the wide set of indicators of medical problems used as independent variables in this study, it might be hypothesised that this variability results from non-medical variables which were not included in our model (e.g. socio-economic status, cultural level, characteristics of patients' social network, and tolerance of the environment). As exemplified in Fig. 2, the real impact on objective quality of life of the vulnerability factors identified in this study could depend on the presence or absence of these resources: if good resources are available, these vulnerability factors are likely to have a lesser impact than if resources are lacking. The practical implications of our findings are that when the vulnerability factors are present clinicians should: (a) be aware of the higher risk for a worsening of objective quality of life over time; and (b) plan early interventions to preserve or improve resources in the wider context of the patient's life.

Fig. 2 Schematic representation of the predictive pattern for objective and subjective quality of Life (QoL) and guidelines for therapeutic strategies aimed at improving quality of life.
Subjective quality of life
The model had different predictive power in the various LQoLP domains of subjective quality of life. We obtained a good predictive model for general well-being, satisfaction with health, leisure activities, social relations and work, which appear to be the areas of life most affected by mental illness.
Socio-demographic characteristics play a different role in the different life domains. Higher psychopathology, as rated by the clinicians, and especially anxiety and depressive symptoms, had, as expected, a negative effect on satisfaction with health and general well-being.
However, the major predictors of subjective quality of life represent different aspects of the individual's perception of their mental illness. Satisfaction with the service received was an important predictor in all domains. A similar finding has been obtained in previous cross-sectional studies (Ruggeri et al, Reference Ruggeri, Bisoffi and Fontecedro2001, Reference Ruggeri, Gater and Bisoffi2002), and was found to be relatively independent of personality traits (Reference Ruggeri, Lasalvia and TansellaRuggeri et al, 2003b ). This has been confirmed for the first time on a longitudinal basis. The random regression models, including the VSSS sub-domains, showed that satisfaction with the interventions provided and with their efficacy play a major role in predicting subjective quality of life. This allows us to hypothesise that service satisfaction is a proxy for self-perceived outcome, and thus those who consider that they have received more effective care are also more satisfied with their own life. An important role was also played by affect balance and self-esteem, which are strictly related to the individuals' perceptions of their overall mental health condition. This suggests that indicators of self-perceived outcome are more important predictors of subjective quality of life than those related to clinical condition. Taking into account the individual's perspectives on outcome can therefore strengthen the therapeutic alliance and improve adherence to treatment regimens and general well-being (Reference ChamberlinChamberlin, 2005). Our findings may have important implications for clinical practice, in particular they may help clinicians to provide interventions that have a positive impact on the everyday lives of those with mental illness. However, these findings should be interpreted with caution, as conflicting results have been obtained on possible confounders. One study found that self-rated symptoms, subjective quality of life, self-rated needs and patient's assessment of treatments were all substantially correlated (Reference Priebe, Kaiser and HuxleyPriebe et al, 1998). Another study found that mood interferes with ratings of quality of life, but has a small influence on satisfaction with care (Reference Atkinson and CaldwellAtkinson & Caldwell, 1997). Follow-up studies of quality of life and satisfaction with care might greatly contribute to a better understanding of this issue. Finally, this should be further explored in randomised clinical trials that test the effect of treatment strategies specifically designed to improve quality of life.
The fraction of variance due to between-subject variability at baseline ranged from 17% to 44%, being thus lower than within-subject variability over time. Thus subjective quality of life tends to be influenced mostly by changes in key clinical variables across time. This suggests that if clinicians regularly monitor the subjective perspective of those in their care, and provide care targeted at improving emotional well-being and self-esteem, then a positive effect on satisfaction with life can be expected (Fig. 2).
Conclusions
This study identified variables that play a major role in predicting objective and subjective quality of life over time (up to 6 years). It provides important new information for clinicians to use when making early prognostic judgements about how quality of life may develop and change over time. Moreover, this study suggests some general guidelines for planning effective therapeutic strategies aimed at improving quality of life.
Clinical Implications and Limitations
CLINICAL IMPLICATIONS
-
▪ Having a mental disorder has a major impact on general well-being, satisfaction with health, participation in and satisfaction with leisure activities and social life, and work/income.
-
▪ Clinicians should be aware that female, unmarried, older and less educated people with mental disorders have a worse prognosis with regard to their objective quality of life over time; preserving or improving economic and cultural factors and relationships might lessen the impact of these factors on quality of life.
-
▪ A positive effect on subjective quality of life can be obtained if clinicians regularly monitor the individual's perceived outcome and satisfaction, and provide care targeted to improve emotional well-being and self-esteem.
LIMITATIONS
-
▪ The concept of objective quality of life is not yet satisfactorily operationalised.
-
▪ This is a treated prevalence cohort study and no comparison has been made with the general population and with those who have a mental disorder but do not receive treatment.
-
▪ The study was conducted in a community-based setting, and no comparison with services offering a different type of care is provided, thus generalisability is limited.
Acknowledgements
We thank those who participated in the follow-up study and the staff of the South Verona Community Psychiatric Service for their collaboration. We thank Drs Rosa Dall'Agnola, Giovanni Salvi, Alberto Parabiaghi, Liliana Allevi, Paola Ognibene, Antonella Miletti, Antonio Lasalvia and Rosa Dall'Agnola for their help in data collection. We thank Professor Scott Patten, Dr Julia Jones, Professor Graham Dunn and Dr Anthony Shakeshaft for their stimulating comments and revision of the paper. This study was funded by the Ministry of Health, Ricerca Sanitaria Finalizzata 2001, with a grant to M.T.


eLetters
No eLetters have been published for this article.