


Atypical hand preference in people with schizophrenia has been described by numerous investigators. However, considering that most neurobehavioural and neurocognitive markers in schizophrenia are of modest effect size (Reference HeinrichsHeinrichs, 2001), reliance on hand dominance may restrict the power of studies to detect consistent relationships among laterality measures, cognition and familial risks. The assumption that handedness is sufficiently representative of all other asymmetries is present in genetic models of handedness (Reference AnnettAnnett, 1985; Reference McManusMcManus, 1985). This approach has recently been criticised on the basis that assessment of various asymmetries is necessary for complex genetic modelling (Reference McManusMcManus, 1999). In this study we employed a novel approach by integrating various behavioural asymmetries and familial indices. The model was tested in patients with schizophrenia, their siblings and a control group – first in the pooled sample of all three groups, and then separately in patients, siblings and controls. In each group we examined the relationship between the obtained laterality phenotypes and a range of neurocognitive measures, personality traits and (for the schizophrenia group only) clinical variables.
METHOD
Participants
Participants were drawn from the Western Australian Family Study of Schizophrenia (Reference Hallmayer, Jablensky and MichieHallmayer et al, 2003; Reference JablenskyJablensky, 2004). The patient group comprised 157 biologically unrelated individuals (34 women) aged 17–69 years who met both ICD–10 (World Health Organization, 1992) and DSM–IV (American Psychiatric Association, 1994) criteria for a lifetime diagnosis of schizophrenia disorder and had been recruited from consecutive admissions to a psychiatric hospital. Patients with comorbid organic brain disease or substance use disorder that could account for the psychotic symptoms, or with language difficulties, were excluded. The comparison sample consisted of 74 (50 women) clinically unaffected siblings of patients with schizophrenia (14–63 years old) and a control group of 77 (34 women) unrelated community residents (19–84 years old). Controls were excluded if they had a history of a psychotic disorder, organic brain disease or substance use disorder. Written informed consent was obtained from all participants. The study was approved by the Committee for Human Rights at the University of Western Australia and the Graylands Hospital Ethics Committee.
Clinical assessment
All patients, siblings and controls were interviewed by a psychiatrist or other trained mental health professional using the Schedules for Clinical Assessment in Neuropsychiatry (SCAN; Reference Wing, Babor and BrughaWing et al, 1990). In addition, all participants filled in the self-administered Schizotypal Personality Questionnaire (SPQ; Reference RaineRaine, 1991). The World Health Organization Psychiatric and Personal History Schedule (PPHS; Reference Jablensky, Sartorius and ErnbergJablensky et al, 1992) was used to collect information on the patients from key family members. Case notes were consulted to extract data on number and duration of hospitalisations, and dosage of antipsychotic medication prescribed.
Laterality measures
The Edinburgh Handedness Inventory (EHI; Reference OldfieldOldfield, 1971) was used to assess hand preference in the study participants and to record the reported handedness of their parents. Eye and foot preferences were included as independent items in the analysis. On the basis of the EHI, participants were classified into handedness categories before statistical analysis: individuals with laterality quotients ranging from 7100 to 771 were classified as left-handers, those with laterality quotients from +70 to +100 as right-handers and the remaining individuals (score from 770 to +70) as mixed-handers. These cut-off scores for the EHI, determined on the basis of statistical criteria, were found to be in good agreement with handedness categorisation based on hand demonstration tasks (Reference DragovicDragovic, 2004). Writing hand and familial sinistrality variables were also extracted from the EHI responses.
Motor proficiency of each hand was assessed by the finger-tapping task (Reference ReitanReitan, 1969) with tapping speed and inter-tap interval variability as measures yielding a tapping laterality quotient. On the basis of this quotient, all participants were assigned to one of three motor skill lateralisation categories: left dominant, mixed (no clear dominance) and right dominant.
Neurocognitive assessment
Each participant was assessed with a neurocognitive battery administered by a trained research psychologist. Current intellectual functioning was assessed by the Shipley Institute of Living Scale (SILS; Reference ZacharyZachary, 1986) which comprises two sub-tests (a vocabulary and an abstraction sub-test) and yields a reliable estimation of the Wechsler Adult Intelligence Scale–Revised Full-Scale IQ (Reference Zachary, Crumpton and SpiegelZachary et al, 1985; Reference PhayPhay, 1990). Premorbid intellectual functioning was estimated using the revised National Adult Reading Test (Reference Nelson and WillisonNelson & Willison, 1991). Sustained attention was assessed with two forms of the Continuous Performance Test – the identical pairs version (Reference Cornblatt, Risch and FarisCornblatt et al, 1988), which measures the effects of an increased processing load on working memory, and the degraded stimuli version (Reference Rosvold, Mirsky and SarasonRosvold et al, 1956), which measures the effects of an increased processing load on visual encoding. For each version of the Continuous Performance Test we used the discrimination index, d L (Reference Snodgrass and CorwinSnodgrass & Corwin, 1988), which indicates ability to discriminate signal from noise as a measure of processing sensitivity. Verbal learning was assessed with the Rey Auditory Verbal Learning Test (RAVLT; Reference ReyRey, 1964). Speed of information processing was assessed by the Inspection Time task (Reference Stough, Brebner and NettlebeckStough et al, 1996; Reference WhiteWhite, 1996), which produces a more accurate assessment of an individual's speed of processing than traditional reaction time measures. Verbal Fluency, FAS version (Reference Benton, Hamsher, De and SivanBenton et al, 1994) was used as a measure of executive lexical retrieval.
Statistical analyses
To identify complex patterns of laterality and their distribution within the study population, we used a version of latent class analysis known as grade of membership (Reference Woodbury, Clive and GarsonWoodbury et al, 1978; Reference Woodbury and MantonWoodbury & Manton, 1982; Reference Manton, Woodbury and TolleyManton et al, 1994). It estimates multivariate regression relationships between sets of discrete or continuous variables, and partitions the data into several analytically derived latent classes or ‘pure types’, identified by conditional maximum likelihood. The number of pure types providing optimal partitioning of the data is determined by a formal criterion, based on changes in the significance of the likelihood ratio χ2 in successive iterations of the model with increasing (or decreasing) numbers of pure types. Pure types estimate the probabilities of joint occurrence of variables and are described by profiles of attributes where the probability (λ kj ) is estimated of each attribute being manifested by an individual (j) belonging entirely to a given pure type (k). Simultaneously, grade of membership quantifies the degree (grade of membership score, gik ) to which an individual belongs to any of the identified (k) pure types (gik values are constrained to add up to 1, so that a person may belong exclusively to one pure type or partially to several). Grade of membership represents the set of attributes characterising an individual as a weighted linear combination of pure type coefficients (λ kj ) and grade of membership scores (gik ), where all individual heterogeneity of the data is accounted for by the gik scores. The input data for grade of membership include both internal variables, used to identify pure types, and external variables, estimated conditional on the identified pure types and placing the latter in a context, without affecting their definition. The level of correspondence of each variable to the final pure type definition is assessed by the information content statistic (H), which can be interpreted as effect size indicating the level of contribution of each variable to the model likelihood (values of H less than 0.10 suggest a non-significant contribution). Grade of membership operates with both continuous and categorical data, and requires no assumptions about the distributions of the dependent variables. It has been used in both psychiatry research (Reference Manton, Woodbury and TolleyManton et al, 1994; Reference Jablensky and WoodburyJablensky & Woodbury, 1995; Reference Nurnberg, Woodbury and BogenschutzNurnberg et al, 1999; Reference Cassidy, Pieper and CarrollCassidy et al, 2001; Reference Szadoczky, Rozsa and PattenSzádóczky et al, 2003) and genetic studies (Reference Corder and WoodburyCorder & Woodbury, 1993; Reference Corder, Woodbury and MantonCorder et al, 2001; Reference Hallmayer, Jablensky and MichieHallmayer et al, 2003), including a new multivariate test for genetic linkage (Reference Kaabi and ElstonKaabi & Elston, 2003).
The pure types in this analysis were derived from two sets of internal variables: behavioural lateralities (writing hand, handedness category, motor proficiency, and foot and eye dominance) and familial indices (parents’ and sibling's handedness, and familial sinistrality). As each individual may approximate to varying degrees (quantified by grade of membership scores) to more than one pure type, grade of membership allows individuals to be uniquely assigned to discrete groups, based on the pure type for which they exhibited the highest gik . Further characterisation of such groups can then be obtained by conventional statistical analyses for relevant external variables, including, in this study, neurocognitive performance (scores on each neurocognitive task), personality traits (three schizotypy factors derived from the SPQ (Reference Raine, Reynolds and LenczRaine et al, 1994)), and several clinical measures (for the schizophrenia group only).
RESULTS
Several behavioural asymmetries (writing hand, handedness, footedness, eyedness and motor lateralisation) and familial co-factors (familial sinistrality and parents’ handedness) were used as internal variables to delineate latent laterality subtypes in the three samples. The first stage of grade of membership analysis, which explored the data for latent patterns of lateralisation in the pooled sample of patients, siblings and controls, resulted in three ideal pure types (labelled ‘left’, ‘mixed’ and ‘right’, respectively) as the most parsimonious solution, integrating all of the measures into left, mixed and right composite patterns that were uncorrelated with one another. Each pure type was expressed, to a varying degree, in patients, siblings and controls, with a moderately increased probability (λ=64.9%) for an individual expressing fully the left pure type to be a patient.
In the second stage we investigated whether a comparable latent structure, using the identical set of internal variables, was present in separate samples. The results showed that the best grade of membership model for the schizophrenia group consisted of three composite pure types, whereas two pure types (‘left’ and ‘right’) provided the best description of the data in siblings of patients with schizophrenia and in the control group. After obtaining the three-pure-type solution in the schizophrenia group and the two-pure-type solution in the groups of siblings and controls, further modelling of the data failed to produce significant improvement in goodness-of-fit. In the schizophrenia group, a change in χ2 was significant for the two-type solution (P<0.0001), and for the three-type solution (P=0.005), but not for the four-type solution (P=0.920). In the samples of siblings and controls a change in χ2 was significant for the two-pure-type solution (siblings, P=0.001; controls, P=0.003), but not for the three-type solution (siblings, P=0.119; controls, P=0.117).
Laterality pure types and their expression in patients, siblings and controls
Table 1 describes the internal variables defining each laterality pure type in the three study groups in terms of probabilities (λ kj ).
Table 1 Pure types of lateralisation in the three samples, defined by lambda (λ kj ) probabilities (shown as percentages) of internal variables1
| H 2 | Schizophrenia group | H 2 | Siblings group | H 2 | Control group | |||||
|---|---|---|---|---|---|---|---|---|---|---|
| ‘Left’ | ‘Mixed’ | ‘Right’ | ‘Left’ | ‘Right’ | ‘Left’ | ‘Right’ | ||||
| λ kj (%) | λ kj (%) | λ kj (%) | λ kj (%) | λ kj (%) | λ kj (%) | λ kj (%) | ||||
| Internal variables | ||||||||||
| Writing hand | ||||||||||
| Left | 0.54 | 100.0 | 0.0 | 0.0 | 0.75 | 100.0 | 0.0 | 0.60 | 100.0 | 0.0 |
| Right | 0.0 | 100.0 | 100.0 | 0.0 | 100.0 | 0.0 | 100.0 | |||
| Handedness category (EHI)3 | ||||||||||
| Left | 0.48 | 25.5 | 0.0 | 0.0 | 0.64 | 20.0 | 0.0 | 0.52 | 33.3 | 0.0 |
| Mixed | 74.5 | 34.4 | 0.0 | 80.0 | 0.0 | 66.7 | 0.0 | |||
| Right | 0.0 | 65.6 | 100.0 | 0.0 | 100.0 | 0.0 | 100.0 | |||
| Footedness | ||||||||||
| Left | 0.58 | 77.9 | 0.0 | 0.0 | 0.22 | 28.2 | 0.0 | 0.51 | 50.0 | 0.0 |
| Mixed | 22.1 | 45.3 | 0.0 | 22.5 | 0.0 | 50.0 | 0.0 | |||
| Right | 0.0 | 54.7 | 100.0 | 49.3 | 100.0 | 0.0 | 100.0 | |||
| Eyedness | ||||||||||
| Left | 0.89 | 79.1 | 0.0 | 0.0 | 0.01 | 34.4 | 27.4 | 0.30 | 8.5 | 30.6 |
| Mixed | 0.0 | 100.0 | 0.0 | 24.1 | 18.6 | 67.6 | 0.0 | |||
| Right | 20.9 | 0.0 | 100.0 | 41.5 | 54.1 | 23.9 | 69.4 | |||
| Motor skill lateralisation | ||||||||||
| Left | 0.80 | 100.0 | 0.0 | 27.8 | 0.48 | 67.3 | 0.0 | 0.15 | 53.1 | 17.2 |
| Mixed | 0.0 | 100.0 | 0.0 | 32.7 | 47.5 | 46.9 | 26.2 | |||
| Right | 0.0 | 0.0 | 72.2 | 0.0 | 52.5 | 0.0 | 56.6 | |||
| Parental handedness (mother × father) | ||||||||||
| L × L | 0.35 | 12.4 | 0.0 | 0.0 | 0.23 | 5.1 | 2.4 | 0.54 | 0.0 | 0.0 |
| L × R | 37.2 | 0.0 | 0.0 | 15.2 | 0.0 | 44.4 | 0.0 | |||
| R × L | 0.0 | 42.5 | 0.0 | 35.6 | 0.0 | 55.6 | 0.0 | |||
| R × R | 50.4 | 57.5 | 100.0 | 44.1 | 97.6 | 0.0 | 100.0 | |||
| Familial sinistrality | ||||||||||
| Negative4 | 0.69 | 0.0 | 0.0 | 100.0 | 0.08 | 23.9 | 65.2 | 0.53 | 0.0 | 100.0 |
| Positive5 | 100.0 | 100.0 | 0.0 | 76.1 | 34.8 | 100.0 | 0.0 | |||
| Participants assigned to pure type by degree of similarity (grade of membership), n (%) | 33 (21) | 56 (36) | 68 (43) | 27 (36) | 47 (64) | 27 (35) | 50 (65) | |||
Pure type ‘left’
Pure type ‘left’ is characterised by a leftward lateralisation on the majority of behavioural and familial indices. Expressed in patients with schizophrenia, siblings and controls, it describes individuals with high probability of leftward (‘left’ or ‘mixed’) lateralisation on all behavioural indices. In contrast to other pure types, this type was characterised by preference of the left hand for writing, left- or mixed-footedness, and greater motor proficiency of the left hand. Individuals expressing fully this type are more likely to have at least one left-handed first-degree relative, compared with the ‘right’ pure type in patients, siblings and controls.
Pure type ‘mixed’
Pure type ‘mixed’ is identified in patients with schizophrenia but not in siblings or controls. Its main feature is lack of a clear preference in overall handedness, footedness, eye dominance and motor proficiency, despite a right-hand dominance for writing. This type was associated with positive familial sinistrality and parental left-handedness, in which the father was more likely to be left-handed. Although the distributions of handedness categories and foot dominance in this pure type were in a rightward direction, individuals fully expressing this type showed absence of clear eye and motor dominance.
Pure type ‘right’
Pure type ‘right’ is expressed in the majority of participants in all three samples. It is characterised by a rightward lateralisation in all domains (hand, foot, eye and motor proficiency) and matching right-handedness in the first-degree relatives.
External variables associated with pure types
The pure types described by λ kj probabilities represent extreme profiles, expressed in their entirety (gik =1.0) by only a minority of individuals in the sample, whereas the majority approximate any such profile to a varying, quantifiable degree. In order to compare the lateralisation patterns identified by grade of membership pure types in terms of conventional descriptive statistics, participants were grouped into discrete clusters, based on each individual's highest grade of membership for any laterality pure type. Within the schizophrenia group, 33 (21%) were classified as ‘left’, 56 (36%) as ‘mixed’ and 68 (43%) as ‘right’. Within the two comparison groups, 27 (36%) of the siblings group and 27 (35%) of the control group were classified as ‘left’, whereas 47 (64%) of the sibling group and 50 (65%) of the control group were assigned to the ‘right’ phenotype category.
Further characterisation of the pure types was achieved by performing analysis of variance and Kruskal–Wallis tests (for the schizophrenia group), using pure type assignments as the main factor, and Student t-tests (for the sibling and control group) for external variables that had not been used in the identification of laterality pure type (Table 2). Since the patients with schizophrenia assigned to the three pure types did not differ in age (F (2,154)=0.496, P=0.610) or education (F (2,153)=0.016, P=0.984), these variables were not used as covariates.
Table 2 External evaluation of pure types in the three samples: comparison of mean scores on the three sets of measures
| Schizophrenia group | Siblings group | Control group | ||||||||||||
|---|---|---|---|---|---|---|---|---|---|---|---|---|---|---|
| ‘Left’ | ‘Mixed’ | ‘Right’ | ‘Left’ | ‘Right’ | ‘Left’ | ‘Right’ | ||||||||
| Neurocognitive performance: mean (s.d.) | ||||||||||||||
| NART | 97.8 | (11.0) | 96.8 | (10.0) | 98.9 | (11.5) | 104.6 | (6.4) | 105.7 | (10.1) | 106.8 | (7.5) | 106.5 | (7.1) |
| Current IQ | 88.8 | (12.5) | 88.7 | (13.5) | 93.2 | (14.4) | 105.4 | (7.5) | 103.7 | (8.9) | 108.5 | (7.8) | 109.1 | (8.0) |
| Verbal fluency | 26.8 | (8.2) | 28.4 | (10.0) | 30.6 | (10.7) | 35.7 | (9.2) | 36.1 | (10.5) | 39.7 | (13.5) | 38.6 | (8.3) |
| CPT–DS, d L | 4.2 | (1.8) | 4.5 | (1.6) | 4.6 | (1.4) | 5.8 | (1.0) | 5.7 | (1.2) | 6.0 | (1.1) | 5.9 | (1.0) |
| CPT–IP, d L | 3.0 | (1.8) | 2.8 | (1.6) | 3.2 | (1.9) | 4.6 | (1.5) | 4.5 | (1.4) | 4.4 | (1.3) | 5.1 | (1.8) |
| Inspection time | 42.9 | (15.0) | 41.3 | (15.0) | 38.7 | (12.4) | 32.8 | (10.7) | 36.3 | (14.7) | 37.4 | (16.2) | 37.0 | (11.4) |
| RAVLT | ||||||||||||||
| Immediate recall | 21.3 | (7.1) | 20.3 | (6.2) | 20.5 | (6.5) | 27.8 | (6.3) | 28.9 | (5.6) | 28.7 | (6.1) | 28.7 | (5.9) |
| Delayed recall | 5.8 | (3.2) | 5.4 | (2.8) | 5.9 | (3.2) | 8.8 | (3.0) | 10.0 | (3.0) | 9.2 | (3.6) | 9.8 | (2.8) |
| Schizotypal personality: mean (s.d.) | ||||||||||||||
| Cognitive and perceptual dysfunction1 | 20.2 | (9.5) | 14.6 | (7.2) | 16.5 | (8.9) | 3.4 | (4.0) | 4.5 | (5.2) | 3.9 | (3.2) | 3.3 | (3.9) |
| Interpersonal deficit2 | 20.4 | (6.6) | 15.7 | (8.3) | 16.4 | (8.8) | 4.9 | (5.4) | 6.8 | (6.9) | 6.0 | (5.1) | 6.3 | (6.8) |
| Disorganisation | 8.7 | (3.9) | 7.3 | (4.1) | 7.9 | (3.9) | 2.2 | (3.3) | 2.9 | (3.0) | 3.4 | (3.1) | 2.7 | (3.0) |
| Clinical measures: median (interquartile range) | ||||||||||||||
| Total length of hospital stay, days | 354 | 235 | 243 | |||||||||||
| (207–874) | (90–450) | (103–758) | ||||||||||||
| Longest length of stay, days3 | 138 | 70 | 76 | |||||||||||
| (74–211) | (43–128) | (48–252) | ||||||||||||
| Number of hospitalisations | 12 | 10 | 11 | |||||||||||
| (12–32) | (10–22.5) | (11–21) | ||||||||||||
| Medication, mg/day | 600 | 375 | 675 | |||||||||||
| (300–625) | (250–600) | (375–1025) | ||||||||||||
| Age at onset, years4 | 20.5 | 21.0 | 23.0 | |||||||||||
| (17–25) | (18–24) | (18–27) | ||||||||||||
| Type of schizophrenia, n (%)5 | ||||||||||||||
| Paranoid | 9 (14.8) | 22 (36.1) | 30 (49.2) | |||||||||||
| Other | 24 (25.0) | 34 (35.4) | 38 (39.6) | |||||||||||
The comparison of clinical measures, schizotypy scores (based on the SPQ factors; Reference Raine, Reynolds and LenczRaine et al, 1994) and neurocognitive performance revealed that members of pure types – patients with schizophrenia in particular – differ on these measures. Within the schizophrenia group, a consistent (non-significant) trend of differences between the three pure types emerged on several clinical measures. The ‘left’ patients had the highest total number of hospitalisations, the longest total length of stay in psychiatric hospital, and the greatest duration of the single longest in-patient admission. There was a non-significant increase in the median number of hospitalisations in the ‘mixed’ and ‘left’ patients combined, relative to the group of ‘right’ patients. No difference was found across the three groups with regard to the median daily dosage of antipsychotic medication (converted into chlorpromazine equivalents). All the participants with schizophrenia had higher scores on the SPQ schizotypy traits than their siblings and the controls (the latter two groups did not differ consistently from one another on these measures). Within the schizophrenia group, patients assigned to the ‘left’ pure type displayed significantly higher scores (F (2,124)=3.66, P=0.029) on the cognitive-perceptual dysfunction factor (ideas of reference, magical thinking, unusual perceptual experiences and paranoid ideation) than patients assigned to the ‘right’ and ‘mixed’ pure types. There was a nearly significant (F (2,124)=2.89, P=0.059) increase on the SPQ interpersonal factor (social anxiety, no close friends, constricted affect). The three schizophrenia subgroups did not differ on the SPQ disorganisation factor (odd behaviour, odd speech).
In the schizophrenia group, patients assigned to the ‘left’ and ‘mixed’ pure types tended to have poorer performance than patients assigned to the ‘right’ type, on premorbid and current IQ, verbal fluency and the two versions of the Continuous Performance Test, and to be slower on the Inspection Time task. Although the differences in mean scores were not statistically significant, the trend of greater impairment in performance on tasks involving effortful lexical retrieval, sustained attention and working memory in patients assigned to the two ‘non-right’ types are consistent (Fig. 1). In the groups of siblings and controls, the tests for between-group differences revealed that members of the two laterality subtypes performed almost equally on all neurocognitive tasks. Finally, in the schizophrenia group we examined whether left-handedness of each parent was specifically associated with patient's assignment to a composite laterality subtype. Of the 19 patients with schizophrenia who reported having a left-handed mother, 14 were assigned by grade of membership to the ‘left’ laterality subtype, 1 to the ‘right’ and 4 to the ‘mixed’. In contrast, of 18 patients with left-handed fathers, 13 were assigned to the ‘mixed’ subtype, 1 to the ‘right’ and 3 to the ‘mixed’. The differential association between fathers’ or mothers’ left-handedness and patient's assignment to a laterality subtype was statistically significant (χ2=10.30, d.f.=2, P=0.006).
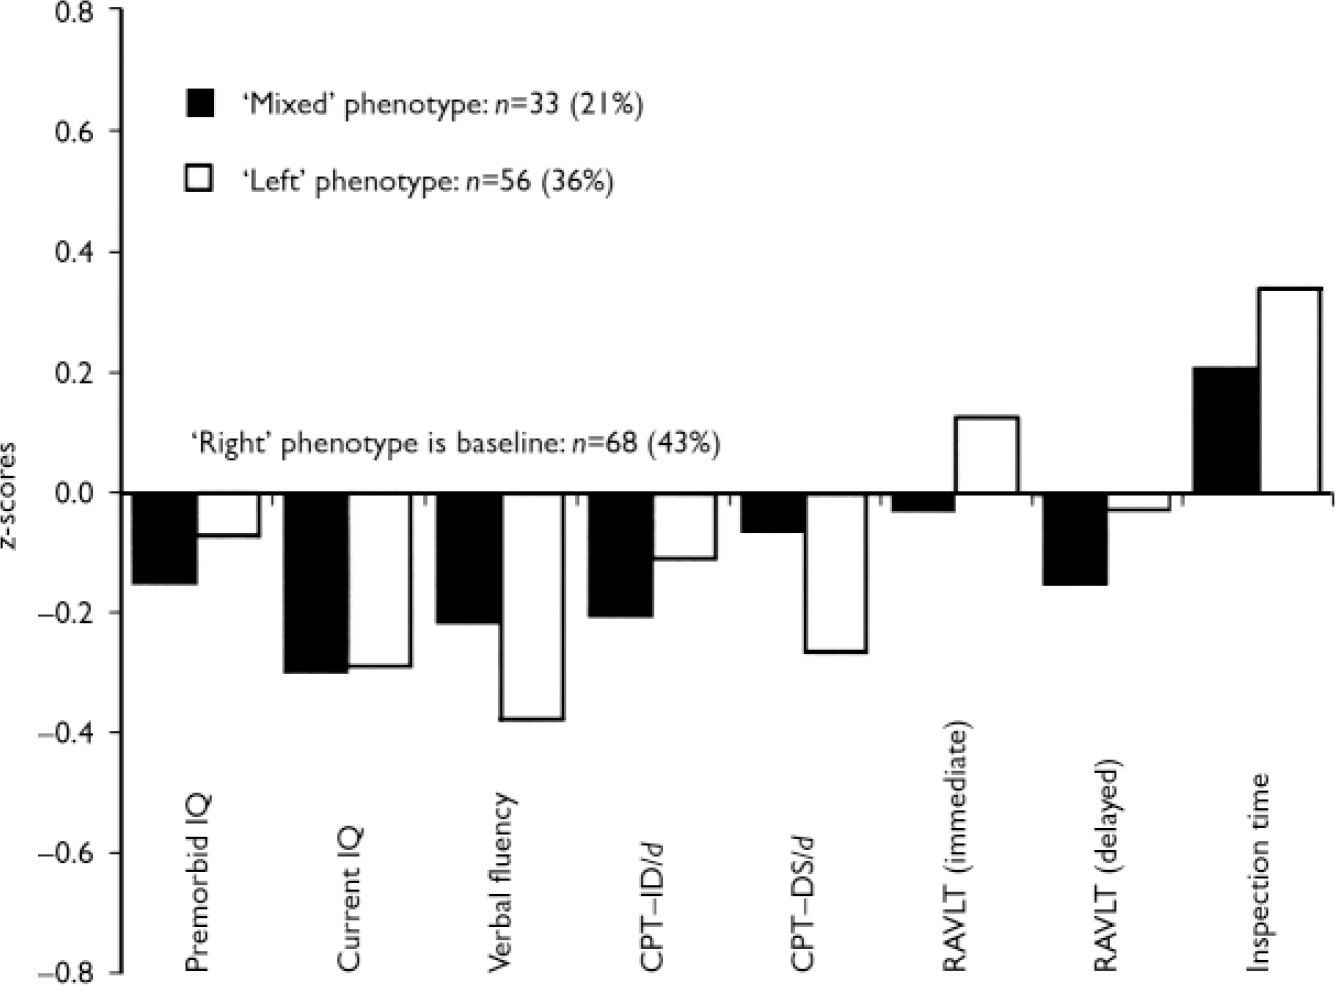
Fig. 1 Neurocognitive profiles of the three laterality subtypes in the schizophrenia patient group (performance of patients assigned to the‘right’ subtype provides the baseline). CPT–IP, Continuous Performance Test–Identical Pairs; CPT–DS, Continuous Performance Test–Degraded Stimuli; RAVLT, Rey Auditory Verbal Learning Test.
DISCUSSION
Our study explored the presence of latent, composite laterality phenotypes, defined by probabilities of joint occurrence of multiple measures of behavioural asymmetries in patients with schizophrenia, their unaffected siblings and healthy controls. Three composite subtypes (‘left’, ‘right’ and ‘mixed’ latent pure types) provided an optimal partitioning of the patient sample. In contrast, only two laterality subtypes characterised the sibling and control groups, where a ‘mixed’ subtype did not improve the fit of the model to the data. Although the majority of both sibling and control participants were assigned to the ‘right’ composite laterality type, over half of the participants with schizophrenia expressed atypical or attenuated behavioural lateralisation (21% with high grades of membership in the ‘left’ subtype and 36% with high grades of membership in the ‘mixed’ subtype). The frequencies of atypical composite laterality phenotypes in unaffected participants (36% in siblings and 35% in controls) are nearly identical to the proportion of individuals (approximately 35%) in the general population estimated by Geschwind & Galaburda (Reference Geschwind and Galaburda1985) as having ‘anomalous’ dominance. Similarly, Annett's ‘right shift’ theory (Reference AnnettAnnett, 1985) predicts that 37% of people should be classified as non-right-hand dominant. Notably, our latent class grade of membership model classified both left- and mixed-handedness among the siblings and controls as part of the composite ‘left’ pure type. The closeness of our empirical findings to those estimates and predictions provides indirect support for the validity of the grade of membership modelling of multiple laterality measures.
The lack of clear behavioural lateralisation in patients with schizophrenia is best illustrated by the ‘mixed’ subtype, which represents a close approximation to the ‘mixed-handedness’ construct. In contrast to previous studies, where reduced functional lateralisation has been restricted to hand preference (Reference Cannon, Byrne and CassidyCannon et al, 1995; Reference Malesu, Cannon and JonesMalesu et al, 1996; Reference Orr, Cannon and GilvarryOrr et al, 1999; Reference Collinson, Phillips and JamesCollinson et al, 2004), our model broadens this construct by including multiple measures of behavioural asymmetries. Furthermore, our finding of two ‘non-right’ patterns (‘left’ and ‘mixed’) of anomalous lateralisation in schizophrenia implicates both reductions of lateral preferences and increases in left-sidedness, rather than merely an increase of mixed-handedness (Reference Satz and GreenSatz & Green, 1999). This is consistent with a number of studies (Reference Katsanis and IaconoKatsanis & Iacono, 1989; Reference Clementz, Iacono and BeiserClementz et al, 1994; Reference Tyler, Diamond and LewisTyler et al, 1995) that have reported an excess of left-handedness in patients with schizophrenia compared with healthy controls.
Our finding that participants with schizophrenia assigned to the ‘left’ phenotype were more likely to have a left-handed mother (but not a left-handed father), whereas those assigned to the ‘mixed’ phenotype were more likely to have a left-handed father (but not a left-handed mother), suggests a familial effect that might be either genetic or environmental. However, the clear absence of an excess of atypical lateralisation in the unaffected siblings of patients with schizophrenia is in line with the findings of several other studies (Reference Clementz, Iacono and BeiserClementz et al, 1994; Toommey et al, Reference Toommey, Faraone and Seidman1998; Reference Byrne, Clafferty and CoswayByrne et al, 2004) and suggests that atypical lateralisation is unlikely to be a robust phenotypic marker of the genetic vulnerability to schizophrenia.
Neurocognitive and clinical correlates
The associations between the laterality phenotypes identified in this study and selected clinical and personality traits and neurocognitive variables implicated in the vulnerability to schizophrenia do not provide unequivocal support for the hypothesis (Reference Crow, Crow and DoneCrow et al, 1998; Reference Leask and CrowLeask & Crow, 2001; Reference NettleNettle, 2003) that cognitive performance increases with increasing lateralisation of hand preferences in either direction, and that cognitive abilities are lowest around the point of equal hand skills–‘point of interhemispheric indecision’ (Reference Crow, Crow and DoneCrow et al, 1998). In our sample of patients with schizophrenia, greater clinical severity (as reflected in more frequent and longer hospitalisations), earlier age at onset, and higher scores on self-assessed cognitive-perceptual dysfunction and interpersonal deficit, characterised the ‘left’ subgroup of patients showing a nearly complete reversal of lateralisation (assessed on multiple indices) and not the ‘mixed’ subgroup, which did not differ on these measures from the patients with complete ‘right’ lateralisation. On the other hand, the ‘left’ and ‘mixed’ subgroups combined showed a consistent trend of poorer cognitive performance than the ‘right’ subgroup, but did not differ from one another on these measures. Thus, our data suggest that some degree of cognitive deficit is associated with a leftward laterality shift, rather than with a mere reduction of behavioural asymmetry. However, since the effect size of this association is small (Cohen's d for neurocognitive measures in this data-set was in the range 0.08–0.16), it is likely that behavioural asymmetries explain only a small proportion of the variance in cognitive performance in the schizophrenia group.
Limitations
The study has several limitations. First, the sample of unaffected siblings was relatively small and may represent a biased proportion of the sibling population (it might have been the case that mainly ‘healthy’, high-functioning siblings participated). Inclusion of all siblings might reveal differences from the controls in both laterality subtypes and neurocognitive profiles. Second, several of the laterality measures (including parental handedness) are based on self-report, which may not be entirely reliable. However, the EHI is the most widely used questionnaire and is widely accepted as the standard in eliciting handedness data (Reference Ransil and SchachterRansil & Schachter, 1994).
Implications
Notwithstanding such caveats, our study demonstrates that the complexity of behavioural lateralisation can be effectively partitioned into distinct latent types using a multivariate analysis, such as grade of membership. An important finding is that, within individuals, the probabilities of association between different measures are not uniformly distributed; for example, left or right writing hand can be associated with varying probabilities for other behavioural preferences, suggesting that the writing hand is a poor predictor of other laterality measures. We suggest that the multivariate integration of laterality measures and other relevant co-factors into composite laterality traits might provide a more refined tool for further research into the genetic, developmental and environmental underpinnings of behavioural and cerebral lateralisation.
Clinical Implications and Limitations
CLINICAL IMPLICATIONS
-
▪ A leftward shift in behavioural lateralisation in patients with schizophrenia is associated with greater clinical severity, higher schizotypy factor scores and poorer cognitive performance.
-
▪ The integration of laterality measures into a multivariate composite trait provides a potential tool for clinical and genetic research into cerebral and behavioural lateralisation.
-
▪ Atypical lateralisation is unlikely to be a reliable marker of vulnerability to schizophrenia.
LIMITATIONS
-
▪ High-functioning, healthy individuals might have been overrepresented in the sample of unaffected siblings.
-
▪ Several of the laterality measures were based on self-report.
-
▪ The number of maternal reports of obstetric complications was small.
Acknowledgements
M.D. was supported by a postgraduate research award from the University of Western Australia. The work used data collected through the Western Australian Family Study of Schizophrenia, which is supported by research grants by the Australian National Health and Medical Research Council and the Department of Health of Western Australia. We thank all patients, their family members and the volunteers from the general community for participating in this study.


eLetters
No eLetters have been published for this article.