


Published economic evaluations suggest that atypical (second-generation) antipsychotics are cost-effective compared with the conventional (first-generation) antipsychotics), chlorpromazine and haloperidol (Reference Almond and O'DonnellAlmond & O'Donnell, 2000; Reference Gregor, Allicar and LilliuGregor et al, 2000; Reference Lewis, McCrone and FrangouLewis et al, 2001; Reference Lynch, Morrison and GravesLynch et al, 2001; Reference Martin, Miller and KotzanMartin et al, 2001; Reference Oh, Lanctot and MittmannOh et al, 2001; Reference Gianfrancesco, Durkin and MahmoudGianfrancesco et al, 2002; Reference Hosak and BahbouhHosak & Bahbouh, 2002; Reference Palmer, Brunner and Ruiz-FloresPalmer et al, 2002; Reference Tilden, Aristedes and MeddisTilden et al, 2002). However, the available economic and clinical evidence is limited in scale and methodology and the narrow range of antipsychotic drugs considered. Many economic evaluations are modelling studies (to synthesise data from several sources) where it is not possible to verify the source or quality of the data used. Thus, it is not clear that the clinical and economic evidence is sufficient for clinical decision-makers to make treatment choices between the first-generation and second-generation drugs currently available (Reference Davies and LewisDavies & Lewis, 2000; Reference Knapp, Ilson and DavidKnapp et al, 2002; Reference Bagnall, Jones and GinnellyBagnall et al, 2003). This is particularly pertinent for people who require a change of antipsychotic but are not eligible for treatment with clozapine.
The aim of our economic evaluation was to inform policy and treatment decisions about the relative costs and utility (or value) of switching treatment between first-generation and second-generation antipsychotics in people with schizophrenia. Specific research questions were, first, are there differences in the direct costs, health state and utility of treatment between first- and second-generation antipsychotics? Second, are first-generation antipsychotics likely to be more cost-effective than second-generation antipsychotics in a population responding poorly to – or intolerant of – current treatment?
METHOD
Economic data were collected prospectively for all patients randomised to treatment in an integrated clinical and economic multicentre, open (that is, both clinician and patient knew which drug was being prescribed), rater-blind, randomised controlled trial of alternative classes of antipsychotic drugs (first-generation v. second-generation) in routine National Health Service (NHS) practice in the UK (Reference Jones, Davies and BarnesJones et al, 2006). The patient population comprised people for whom a change in antipsychotic drug treatment was being considered because of intolerance or insufficient clinical improvement, and for whom a choice between a first-generation antipsychotic and a second-generation antipsychotic other than clozapine was relevant. Inclusion criteria were a DSM–IV diagnosis of schizophrenia, schizoaffective disorder or delusional disorder (American Psychiatric Association, 1994), age 18–65 years and an interval of at least 1 month since the first onset of positive psychotic symptoms. Exclusion criteria were substance misuse or a medical disorder considered clinically to be the major cause of positive psychotic symptoms, or a history of neuroleptic malignant syndrome.
Key characteristics of the trial included:
-
(a) concealed randomisation to the two treatment arms;
-
(b) masked independent assessments of outcome for 1 year following randomisation;
-
(c) intention-to-treat analysis;
-
(d) trial entry defined by the treating clinician deciding to change drug management;
-
(e) broad inclusion criteria to reflect normal clinical practice;
-
(f) choice of drug within a class of treatment was made in advance by the treating clinician;
-
(g) non-commercial funding.
The primary outcome was the score on the Quality of Life Scale (QLS; Reference Heinrichs, Hanlon and CarpenterHeinrichs et al, 1984). The following drugs were available to participants randomised to the first-generation drug treatment arm: chlorpromazine, flupentixol, haloperidol, loxapine, sulpiride, trifluoperazine and zuclopenthixol, plus depot antipsychotics (fluphenazine, zuclopenthixol, flupentixol and haloperidol decanoate). For patients randomised to the second-generation drug treatment arm, the available medications were risperidone, olanzapine, amisulpride and quetiapine. Clinicians were asked to choose the individual drug for their patient before randomisation. A total of 275 patients were referred (70% of whom were taking first-generation drugs at baseline), 82% (n=227) were randomised and 81% (n=185) of randomised patients completed follow-up. There was 75% power to test the main clinical hypothesis. The overall conclusion was that there was a trend for patients in the first-generation drug treatment arm to do better than those in the second-generation arm, in contrast to the trial hypothesis. There was a difference of 1.7 points on the QLS in favour of first-generation drugs (standard error of difference 1.4; 95% CI –4.5 to 1.1); however, this advantage failed to reach statistical significance (P=0.24).
The economic evaluation used the framework of cost-effectiveness acceptability analysis (Reference Briggs and O'BrienBriggs & O'Brien, 2001; Reference Fenwick, Claxton and SculpherFenwick et al, 2001; Reference Pedram-Sendi and BriggsPedram-Sendi & Briggs, 2001; Reference O'Brien and BriggsO'Brien & Briggs, 2002) and the perspectives of the NHS, social support services and patients for the primary analysis. These represent the main stake-holders to approximate a broad societal viewpoint or perspective. The analysis included only the direct costs of care, in line with international guidelines and UK policy (Reference Gold, Siegel and RussellGold et al, 1996; National Institute for Clinical Excellence, 2004). The evaluation was designed to inform policy and treatment decisions in secondary and primary care for a 1-year period, the length of scheduled follow-up from randomisation in the trial. Discounting future costs and outcomes to adjust for time preferences was not necessary for the 1-year time frame.
Quality-adjusted life-years
The health measure for the economic evaluation was the quality-adjusted life-year (QALY), calculated from health states reported by all patients enrolled in the trial, using the EuroQoL EQ–5D (Reference Kind and SpilkerKind, 1996) at baseline and at the 12-week, 26-week and 52-week follow-up assessments. The EQ–5D is a validated generic health status measure covering five domains (mobility, self-care, usual activity, pain/distress, anxiety/depression) and is used in national health surveys in the UK and in clinical trials in mental health. The health status profiles were converted to utility values using published utility tariffs for the EQ–5D (Reference Dolan, Gudex and KindDolan et al, 1995). The utility values are a measure of preferences for different health states and the relative value of different health states on a scale anchored by death and full health. The utility values were used to estimate QALYs, based on the observed number of days patients were alive in the 12-month follow-up period of the trial.
Direct costs
The direct cost of events was estimated from service use observed in the clinical trial multiplied by published national unit cost data (Chartered Institute of Public Finance Accountants, 2002; Reference Netten and CurtisNetten & Curtis, 2002; Department of Health, 2003). All unit costs were standardised to 2001–2002 prices using a health service price index where necessary (Reference Netten and CurtisNetten & Curtis, 2002). Service use data were collected at each scheduled follow-up assessment for all patients enrolled in the trial.
Resource use data were collected for hospital in-patient and out-patient services, primary and community care and prescribed medications. First, data on the use of psychiatric hospital care and medication were obtained for all patients, by case-note review in the main psychiatric hospital used by each patient (typically the hospital at which the patient was treated when referred to the trial). Second, patients completed an economic questionnaire at each assessment to identify whether they had used any other hospital, primary or community care services since the previous assessment. Community care included day care facilities and contact with multidisciplinary mental healthcare professionals and teams, social workers and social support workers. If additional services were used, patients were asked to specify the name and location of the services. Third, additional data on the number of times each service was used (as identified by the patient in the economic questionnaire) were obtained from detailed review of the relevant clinical records for each person. These three methods of data collection minimised the extent of missing data for key cost drivers (psychiatric in-patient and out-patient hospital care).
National average unit cost data were used to control for differences in costs between care settings. The national reference cost data published by the UK Department of Health (2003) were used to estimate the cost of psychiatric in-patient and out-patient care, by type of ward or out-patient visit. Sensitivity analysis was used to test the impact of using national unit cost data from other sources for psychiatric hospital costs (Chartered Institute of Public Finance Accountants, 2002; Reference Netten and CurtisNetten & Curtis, 2002). The hospital trust financial returns data published by the Chartered Institute of Public Finance Accountants (CIPFA) were used to estimate the cost of non-psychiatric hospital care by type of ward or admitting specialty. The reference cost data-set did not have detailed unit costs for non-psychiatric hospitals, so the more detailed CIPFA database was used for these costs.
Information was collected for each patient about dosage, duration and route of administration of medication. A daily cost for oral medication and cost per injection or dose for depot and pro re nata medicines was estimated by multiplying the quantity of medication by unit costs derived from the British National Formulary (British Medical Association & Royal Pharmaceutical Society of Great Britain, 2002) The daily cost was multiplied by the reported duration of courses of treatment completed within the study period, and by the length of the study period for continuing courses of treatment. The cost of medicines did not include the costs of dispensing or administration of the drugs (e.g. by injection), as it was assumed that these were included in the unit costs used for hospital in-patient and out-patient care and primary and community care.
Incremental cost-effectiveness analysis
Descriptive analysis was used to compare utility values, QALYs and costs. The primary measure of interest for the economic analysis was the incremental cost-effectiveness ratio (ICER). The QALY and cost data were used as inputs to estimate the ICER and cost-effectiveness acceptability curves, meaning that statistical analysis of these was not necessary. Incremental cost-effectiveness ratios were calculated as the difference in costs divided by the difference in QALYs for the two types of medication (Reference Gold, Siegel and RussellGold et al, 1996). The incremental costs and QALYs were estimated by analysis of covariance (ANCOVA) using a general linear model and covariates of baseline QLS score, utility, psychiatric hospital in-patient and out-patient costs prior to enrolment in the trial and trial centre (location). Treatment allocation was entered as a fixed factor.
Statistical measures of variance of the ICER were not calculated, since standard methods of analysis do not allow these to be estimated in any meaningful way (Reference Fenwick, Claxton and SculpherFenwick et al, 2001; Reference Pedram-Sendi and BriggsPedram-Sendi & Briggs, 2001; Reference O'Brien and BriggsO'Brien & Briggs, 2002). Instead, cost-effectiveness acceptability curves were plotted to summarise uncertainty associated with the ICER. To derive these curves, the incremental cost and QALY estimates from the generalised linear model regression (adjusted for baseline covariates) were bootstrapped to simulate the sample data of costs and QALY (Reference Briggs, O'Brien and BlackhouseBriggs et al, 2002). Ten thousand bootstrap samples (each one the same size as the original trial sample) were drawn with replacement to calculate 10 000 pairs of net cost and QALY estimates for the first-generation antipsychotics. The bootstrapped estimates of net QALYs were revalued, using a range of ceiling ratios or willingness to pay thresholds (WTPTs) to gain 1 QALY. For each WTPT, a net benefit statistic (NB) was estimated as
where E is the incremental QALY gained by first-generation antipsychotics, WTP is the willingness to pay to gain 1 QALY and C is the incremental cost of the drug. Cost-effectiveness acceptability curves plot the proportion of bootstrapped simulations where the net benefit of an intervention is greater than zero for each WTPT (Reference Fenwick, Claxton and SculpherFenwick et al, 2001, Reference Pedram-Sendi and BriggsPedram-Sendi & Briggs, 2001; Reference Hoch, Briggs and WillanHoch et al, 2002; Reference O'Brien and BriggsO'Brien & Briggs, 2002). The WTPT values used ranged from decision-makers being willing to pay £1 to gain 1 QALY to decision-makers being willing to pay £50 000 to gain 1 QALY. This includes the range of implied values that are acceptable to policy-makers in the UK (Reference Rawlins and CulyerRawlins & Culyer, 2004).
The cost-effectiveness acceptability curve summarises the information at each value of willingness to pay to gain a QALY. The net benefit statistic gives an estimate of the monetary value of a QALY or other measure of effectiveness.
Data manipulation and missing data
The economic data were manipulated and analysed using the Statistical Package for the Social Sciences version 11.5 for Windows to calculate costs and QALYs for the 1-year follow-up period and to estimate missing utility data. Missing utility data for patients who completed the scheduled follow-up but had missing observations were imputed by linear interpolation (value of previous period plus value of next period divided by 2), if observations either side of the missing item were available. Patients with one or more missing observations at the end of follow-up were treated as censored cases due to withdrawal or loss to follow-up. The survival function and probability of survival at each assessment point was estimated, using patient status (alive, dead or withdrawn) and treatment allocation. Multiple imputation (propensity score) was used to impute values for the missing costs, by category of resource use using SOLAS for Missing Data Analysis version 3.0 (Statistical Solutions Ltd, Cork, Ireland) (Reference Rubin and SchenkerRubin & Schenker, 1991; Reference Lavori, Dawson and SheraLavori et al, 1995). This meant that missing cost data were treated as missing at random, rather than informative censoring of data. This was based on the assumption that use of services and subsequent costs were determined by a range of factors in addition to treatment allocation or previous service use. Analysis of covariance and the bootstrap analysis were conducted in Stata version 9 for Windows.
Sensitivity analyses
Some assumptions were required to deal with missing data. The impact of these assumptions on the results was tested using alternative approaches to imputation of missing data. The impact of alternative sources of unit cost data was also tested in the sensitivity analysis.
RESULTS
The clinical and demographic characteristics of patients in the two randomised groups were similar at baseline (Reference Jones, Davies and BarnesJones et al, 2006), and differences in health status, utility and costs for the previous 3 months were not statistically significant (Table 1).
Table 1 Health status and costs at baseline

| FGA n=118 | SGA n=109 | |
|---|---|---|
| Age, years: mean (s.d.) | 40.5 (11.3) | 40.9 (11.1) |
| Gender, n (%) | ||
| Female | 37 (31) | 36 (33) |
| Male | 81 (69) | 73 (67) |
| Ethnic group, n (%) | ||
| White | 87 (74) | 83 (76) |
| Black and minority | 25 (21) | 25 (23) |
| Other | 6 (5) | 1 (1) |
| Diagnosis, n (%) | ||
| Schizophrenia | 85 (72) | 85 (78) |
| Schizophreniform | 5 (4) | 3 (3) |
| Schizoaffective disorder | 22 (19) | 17 (16) |
| Delusional disorder | 6 (5) | 4 (4) |
| EQ–5D | ||
| Mobility, n (%) | ||
| No problems | 85 (72) | 64 (59) |
| Missing | 0 | 1 (1) |
| Self-care, n (%) | ||
| No problems | 98 (83) | 81 (74) |
| Missing | 0 | 1 (1) |
| Usual activities, n (%) | ||
| No problems | 53 (45) | 49 (45) |
| Missing | 0 | 1 (1) |
| Pain/discomfort, n (%) | ||
| No pain or discomfort | 70 (59) | 58 (53) |
| Missing | 0 | 1 (1) |
| Anxiety/depression, n (%) | ||
| Not anxious or depressed | 40 (34) | 27 (25) |
| Missing | 0 | 1 (1) |
| Utility value: mean (s.d.) 1 | 0.67 (0.29) | 0.61 (0.33) |
| QLS score: mean (s.d.) | 43.29 (21.65) | 43.49 (20.31) |
| Hospital costs, £: mean (s.d.) 2 | 4498 (6580) | 4830 (6859) |
| In-patient days: mean (s.d.) 3 | 16 (27) | 17 (30) |
| Location, n (%) | ||
| 1 | 50 (42) | 49 (45) |
| 2 | 41 (35) | 34 (31) |
| 3 | 15 (13) | 15 (14) |
| 4 | 12 (10) | 10 (9) |
| 5 | 0 (0) | 1 (<1) |
FGA, first-generation antipsychotics; QLS, Quality of Life Scale; SGA, second-generation antipsychotics
1. Complete case data
2. Psychiatric hospital in-patient and out-patient costs (UK £, 2001–2002) for the 3 months prior to baseline
3. Psychiatric hospital in-patient days for the 3 months prior to baseline
Quality-adjusted life-years
The unadjusted health status and utility scores at baseline and 12-month follow-up assessments indicate that the health-related quality of life of participants improved over the 12 months from baseline (Tables 1 and 2). There was an observed difference in QALYs, including imputed values for missing data (Table 2), which at least partially reflects differences in utility at baseline. Differences between the groups in adjusted utility values are highest at weeks 12 and 26, and diminish by week 52 (Fig. 1).
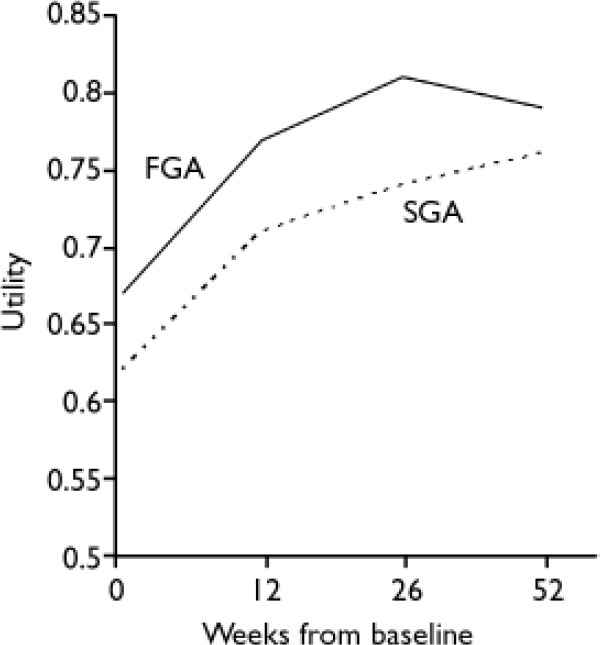
Fig. 1 Utility values, baseline to week 52, adjusted for baseline covariates (FGA, first-generation antipsychotics; SGA, second-generation antipsychotics)
Table 2 Health status, length of follow-up, utility and QALYscores at 1 year, unadjusted for baseline covariates
| FGA (n=118) | SGA (n=109) | |
|---|---|---|
| Health status, n (%) | ||
| Mobility (walking) | ||
| No problems | 80 (68) | 64 (59) |
| Missing | 20 (17) | 25 (23) |
| Self-care | ||
| No problems | 89 (75) | 67 (61) |
| Missing | 20 (17) | 25 (23) |
| Usual activities | ||
| No problems | 56 (47) | 43 (39) |
| Missing | 20 (17) | 25 (23) |
| Pain/discomfort | ||
| No pain or discomfort | 77 (65) | 61 (56) |
| Missing | 20 (17) | 25 (23) |
| Anxiety/depression | ||
| Not anxious or depressed | 44 (37) | 38 (35) |
| Missing | 20 (17) | 25 (23) |
| Follow-up, days: mean (s.d.) | 354 (85) | 344 (93) |
| Utility value: mean (s.d.) | 0.78 (0.22) | 0.75 (0.23) |
| QALY: mean (s.d.) | 0.74 (0.22) | 0.67 (0.25) |
FGA, first-generation antipsychotics; QALY, quality-adjusted life-year; SGA, second-generation antipsychotics
Costs
Participants in both treatment groups mostly used psychiatric hospital services (Table 3). Data on the use of psychiatric hospital care at 52 weeks were available for a high proportion of patients: 88% in the first-generation antipsychotic (FGA) group and 91% in the second-generation antipsychotic (SGA) group. Data were less complete for other cost categories, the lowest rate of follow-up being the use of primary and community care services at 77%. Overall, 85% of patients reported that they had used primary and community care services and their records were reviewed to identify intensity of resource use. Total cost data were available for 65% of participants. The use of psychiatric hospital care constituted 88% of the total costs of care (91% FGA, 84% SGA).
Table 3 Use of services: comparison of the two treatment groups

| Weeks 0–12 | Weeks 13–26 | Weeks 27–52 | |||||||
|---|---|---|---|---|---|---|---|---|---|
| FGA | SGA | FGA | SGA | FGA | SGA | ||||
| Psychiatric hospital | |||||||||
| n | 115 | 106 | 111 | 101 | 107 | 99 | |||
| In-patient days: mean (s.d.) | 29 (37) | 28 (36) | 20 (36) | 21 (38) | 33 (66) | 36 (65) | |||
| Day patient and out-patient visits: mean (s.d.) | 0 (0) | 2 (13) | 1 (4) | 2 (11) | 0 (3) | 3 (22) | |||
| Non-psychiatric hospital | |||||||||
| n | 112 | 97 | 108 | 98 | 107 | 93 | |||
| In-patient days: mean (s.d.) | 1 (10) | 3 (29) | 0 (2) | 0 (3) | 0 (1) | 2 (19) | |||
| Out-patient visits: mean (s.d.) | 0 (0) | 0 (0) | 0 (0) | 0 (1) | 0 (0) | 0 (1) | |||
| Community and primary care | |||||||||
| n | 90 | 83 | 86 | 85 | 91 | 78 | |||
| Psychiatry and psychology visits: mean (s.d.) | 0 (1) | 0 (0) | 0 (0) | 0 (1) | 0 (1) | 0 (1) | |||
| GP, district and practice nurse visits: mean (s.d.) | 1 (2) | 2 (2) | 1 (3) | 2 (6) | 3 (5) | 5 (9) | |||
| Other primary and community care staff visits: mean (s.d.) | 1 (6) | 1 (3) | 2 (8) | 2 (5) | 2 (6) | 3 (8) | |||
| Community centre/day centre visits: mean (s.d.) | 3 (8) | 5 (14) | 4 (12) | 5 (17) | 6 (18) | 7 (25) | |||
| Antipsychotic medication | |||||||||
| n | 111 | 104 | 105 | 94 | 98 | 91 | |||
| Days per antipsychotic: mean (s.d.) | 60 (24) | 53 (25) | 73 (32) | 76 (32) | 132 (59) | 150 (50) | |||
| Number of antipsychotics: mean (s.d.) | 2 (1) | 2 (1) | 2 (1) | 1 (1) | 2 (1) | 1 (1) | |||
| Non-antipsychotic medication | |||||||||
| n | 91 | 75 | 88 | 73 | 90 | 72 | |||
| Days per medicine: mean (s.d.) | 74 (28) | 69 (26) | 84 (29) | 81 (33) | 138 (59) | 152 (53) | |||
| Number of medicines: mean (s.d.) | 2 (1) | 2 (2) | 2 (1) | 2 (2) | 2 (2) | 2 (2) | |||
FGA, first-generation antipsychotics; GP, general practitioner; SGA, second-generation antipsychotics
There was a trend for the mean costs (including imputed costs for missing observations and censored cases) to be lower for people allocated to the FGA group than the SGA group (Table 4). The costs of care at each follow-up period and over 1 year are characterised by large standard deviations, reflecting large differences between patients in the use of services. The costs of antipsychotic medication were a small percentage of overall costs (2% FGA and 4% SGA).
Table 4 Costs of services
| Costs, £: mean (s.d.) 1 | |||||||||||||||
|---|---|---|---|---|---|---|---|---|---|---|---|---|---|---|---|
| Weeks 0–12 | Weeks 13–26 | Weeks 27–52 | Annual cost | ||||||||||||
| FGA (n=118) | SGA (n=109) | FGA (n=118) | SGA (n=109) | FGA (n=118) | SGA (n=109) | FGA (n=118) | SGA (n=109) | ||||||||
| Psychiatric hospital | 5728 (7885) | 5587 (7296) | 4372 (8161) | 4256 (7471) | 7069 (15 358) | 7110 (12 874) | 17 170 (28 518) | 16 953 (24 869) | |||||||
| Non-psychiatric hospital | 177 (1633) | 243 (1670) | 118 (575) | 329 (2459) | 94 (479) | 709 (6313) | 389 (1781) | 1280 (7485) | |||||||
| Antipsychotic medicines | 73 (114) | 179 (174) | 70 (83) | 200 (211) | 258 (413) | 384 (398) | 401 (455) | 763 (661) | |||||||
| Other medicines | 41 (69) | 36 (50) | 44 (80) | 43 (61) | 87 (145) | 87 (127) | 172 (284) | 166 (214) | |||||||
| Community and primary care | 181 (236) | 248 (386) | 230 (347) | 291 (632) | 314 (449) | 416 (681) | 715 (860) | 946 (1350) | |||||||
| Total cost | 6200 (7947) | 6292 (7350) | 4835 (8150) | 5119 (7678) | 7823 (15 495) | 8706 (14 182) | 18 858 (28 602) | 20 118 (25 348) | |||||||
FGA, first-generation antipsychotics; SGA, second-generation antipsychotics
1. Costs in UK £, 2001–2002 values, including imputed values for missing data
Cost-effectiveness analysis
The primary and sensitivity analyses indicated that switching therapy to a first-generation antipsychotic may result in lower costs and higher QALYs (Table 5). All of the primary and sensitivity analyses indicate a large standard error associated with the differences in costs and QALYs. This indicates a high level of variation in these variables between patients, and therefore a high level of uncertainty associated with the estimated differences in costs and QALYs.
Table 5 Incremental costs and quality-adjusted life years (QALYs) and cost per QALY, adjusted for covariance

| Net cost, £ (s.e.) | Net QALY (s.e.) | Net monetary benefit if WTP=£35 000, £ 1 | FGA cost-effective if WTP=£35 000, % simulations | |
|---|---|---|---|---|
| Primary analysis | –116 (2464) | 0.04 (0.03) | 1752 | 75 |
| Sensitivity analysis | ||||
| Analysis unadjusted for covariance | –1260 (3599) | 0.07 (0.03) | 3720 | 84 |
| Complete case analysis | –2390 (2737) | 0.02 (0.02) | 3308 | 87 |
| QALYs including imputed values for missing observations only | –116 (2391) | 0.04 (0.02) | 1650 | 74 |
| Net costs, PSSRU unit cost data | –1157 (2248) | 0.04 (0.03) | 2750 | 88 |
| Net costs, CIPFA unit cost data | –1418 (2230) | 0.04 (0.03) | 3008 | 90 |
CIPFA, Chartered Institute of Public Finance Accountants; FGA, first-generation antipsychotics; PSSRU, Personal Social Services Research Unit; WTP, willingness to pay to gain 1 additional QALY
1. UK £, 2001–2002 values
Figure 2 presents the probability that first-generation antipsychotics are cost-effective in the form of a cost-effectiveness acceptability curve. If decision makers were willing to pay up to £35 000 to gain 1 QALY, then the probability that these drugs are cost-effective is 0.75, with an associated net benefit of £1752. That is, 75% of the pairs of bootstrap replicates indicated that these drugs were associated with a net benefit value greater than zero (the net cost of the drug minus the net QALY multiplied by £35 000). The ceiling cost per QALY ratio of £35 000 is at the top of the range of implied values that are acceptable to policy-makers in the UK (Reference Rawlins and CulyerRawlins & Culyer, 2004).
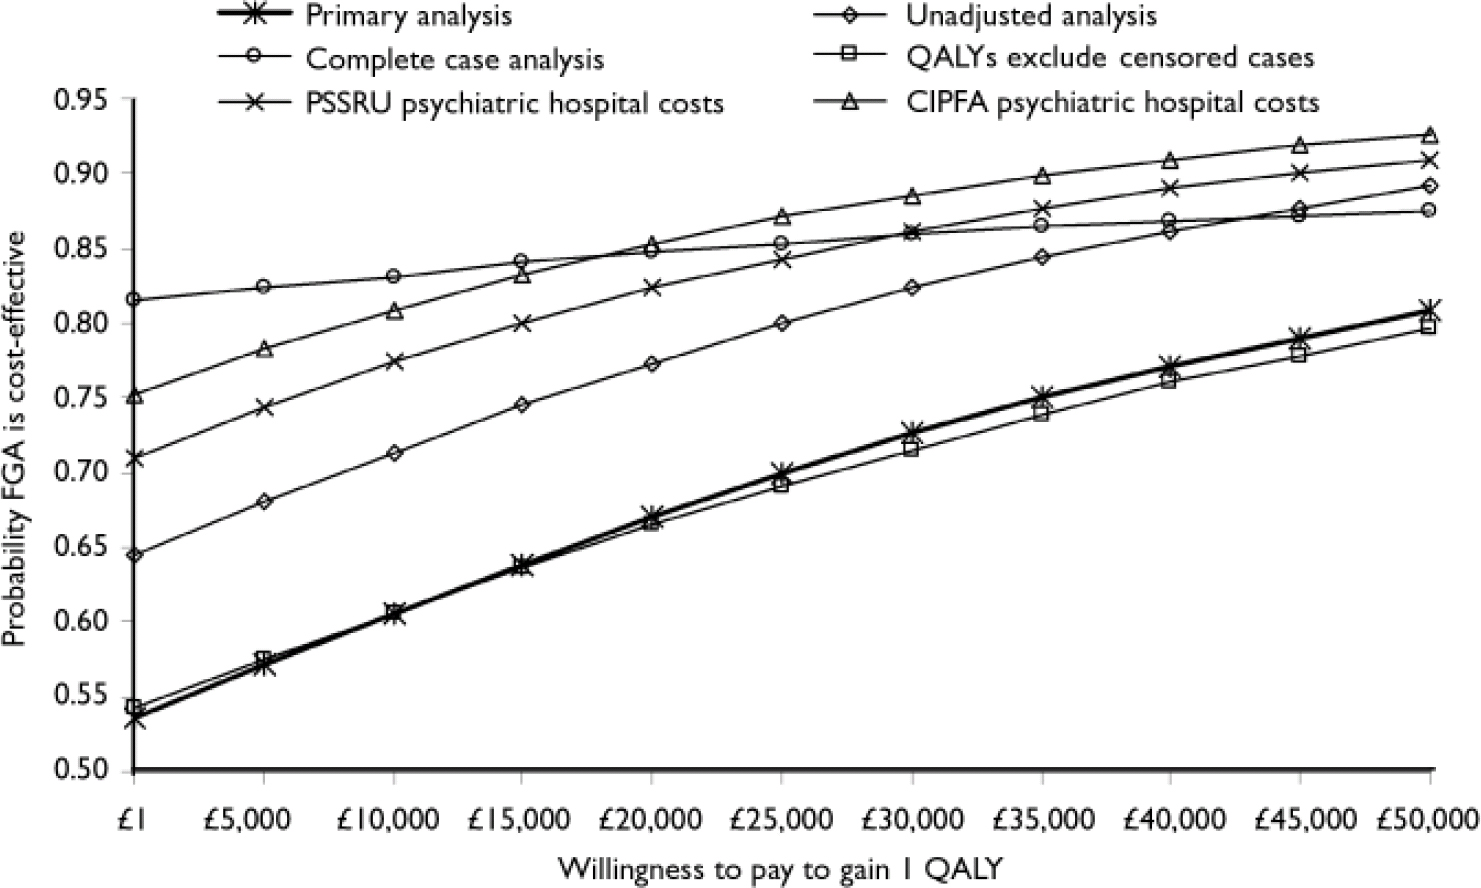
Fig. 2 Cost-effectiveness acceptability curves of the cost per quality-adjusted life-year (QALY) gained by use of first-generation antipsychotics (FGA). CIPFA, Chartered Institute of Public Finance Accountants; PSSRU, Personal Social Services Research Unit.
Overall, the probability that first-generation antipsychotics are cost-effective is between 0.54 (if decision-makers were willing to pay only £1 to gain 1 QALY) and 0.81 (if decision-makers were willing to pay up to £50 000 to gain 1 QALY).
DISCUSSION
The primary and sensitivity analyses suggest that first-generation antipsychotic drugs may be associated with small cost savings and a small gain in QALYs when compared with second-generation drugs. The cost-effectiveness acceptability analysis supported this conclusion. These results were estimated from resource use and health status data collected as an integral part of a randomised controlled clinical trial. The use of a randomised controlled trial strengthens the reliability and internal validity of the data collected; however, aspects of the trial design may affect the validity or robustness of the data.
Potential limitations
Sequential statistical tests of differences in costs and QALYs were not conducted. This was because the primary measure of outcome for the economic analysis was the incremental cost-effectiveness ratio. As a ratio, this is not amenable to statistical analysis of differences between groups (Reference Briggs, O'Brien and BlackhouseBriggs et al, 2002). An alternative approach to assessing the level of variance and uncertainty associated with the data was to estimate net benefit statistics and cost-effectiveness acceptability curves. The latter estimate the likelihood or probability that first-generation drugs are more or less cost-effective than second-generation ones. Other advantages of this approach are, first, that the QALY and cost data were inputs to estimate the ICER. If cost and outcome interact (i.e. poorer health status is associated with increased resource use and cost), then it is more appropriate to relate net costs to patient outcomes than sequentially test for statistical differences in costs and QALYs. Cost-effectiveness acceptability curves incorporate this interaction between costs and QALYs and provide a method to assess the uncertainty associated with the data. Second, the trial was not powered to detect differences in costs, QALYs or net benefit. Insufficient power increases the chance of type II errors (failing to reject the null hypothesis of no difference between groups when a difference does exist). Post hoc sample size calculations indicate that the power to detect statistically significant differences in net benefit was low. If decision-makers consider important differences in costs and QALYS to be £1500 and 0.10 respectively, and are prepared to pay £35 000 to gain 1 QALY, then there was 25% power to detect statistically significant differences in net benefit. If decision-makers consider smaller differences in costs and QALYs to be important, or are prepared to pay less to gain 1 QALY, then the power to detect statistically significant differences in net benefit was lower.
Both the participants and referring clinicians knew of the treatment allocation and drug prescribed, so subjective patient responses to the EQ–5D and service use measures might have been influenced by knowledge of treatment allocation. In addition, knowledge of the treatment allocation and drug prescribed might have influenced the assessment and interpretation of effectiveness and side-effects by the referring clinician and participant (Reference Lloyd, Markwick and PageLloyd et al, 2005). This may in turn have influenced treatment decisions and subsequent service use and outcomes of the patients. This is particularly important if treating clinicians had prior expectations of the likely effectiveness and side-effects of particular antipsychotics or classes of antipsychotic. However, it might be expected that this would operate in favour of the newer, second-generation antipsychotics rather than the older conventional drugs. In addition, knowledge of the drug prescribed is a more accurate reflection of what would happen in routine practice, which may increase the general applicability of the results.
As part of the operational protocol, clinicians were asked to try to keep participating patients on the randomised medication for at least the first 12 weeks (if compatible with good practice). If the medication needed to be changed, the clinician was asked to prescribe another drug within the same class, if possible. If changes to medication occur more frequently in routine practice, the costs estimated in this trial may be underestimated. Changes of medication could incur additional costs for hospital in-patient and out-patient care. At 52 weeks there was a trend for more participants to remain in the SGA arm (65%) than the FGA arm (51%). This is reflected by the increasing cost of antipsychotic medication in the FGA arm over the course of the 1-year follow-up.
The EQ–5D, an instrument shown to have acceptable validity in people with schizophrenia in European countries (Reference Prieto, Novick and SacristanPrieto et al, 2003; Reference Bobes, Garcfa-Portilla and SfiizBobes et al, 2005), was used to measure the self-reported health status of participants at each assessment point. The health states were valued using population utility tariffs. The EQ–5D and utility tariffs are validated measures to estimate QALYs. However, the EQ–5D and QALYs are generic measures of overall physical, mental and emotional health-related quality of life; QALYs also combine health status with survival or life years gained. As such, they may not be sensitive to small but important changes in the symptoms and health-related quality of life of people with schizophrenia. The QALY and the EQ–5D have not been widely used in mental healthcare studies in the past, but the need to demonstrate value for money of interventions and comply with international standards and local guidelines for the design of economic evaluations supports their use (Reference Gold, Siegel and RussellGold et al, 1996; National Institute of Clinical Excellence, 2004). The differences in QALYs in this study were small, but similar to those found in UK-based modelling studies using QALYs (Reference Davies and LewisDavies & Lewis, 2000; Reference Bagnall, Jones and GinnellyBagnall et al, 2003). Changes in health status and in utility were detected over the 52-week follow-up period. Additionally, there was a statistically significant correlation between the utility values and other measures used in the trial, including the primary clinical outcome measure, the QLS.
The costs of contacts with the criminal justice system, use of residential accommodation and informal care were excluded, as were the indirect costs of withdrawal from paid employment. Thus, the total costs were underestimated, which might have biased the results if there were important differences in utilisation due to the choice of antipsychotic rather than the influence of organisational and social factors. However, a descriptive analysis of these variables suggests that the level of use was low and that there were few differences in the use of these services over the 12-month period of the trial.
The economic analyses included multiple imputation techniques to generate values for all missing observations and censored cases, to reduce the impact of bias due to attrition. The ANCOVA supported this approach to missing data. The use of imputation reduced the cost difference between the two types of antipsychotics when compared with the complete case analysis. In contrast, the imputation of missing utility data increased the difference between the two drug classes. Using the imputed and complete case data-sets, the results for patients randomised to switch to first-generation antipsychotics were associated with a trend towards higher QALYs and lower costs than those of patients randomised to receive second-generation antipsychotics. The analysis using imputed data reduces the potential for bias associated with missing data, which is particularly important in studies with multiple follow-up points.
Overall total cost data were available for 65% of participants. However, the use of psychiatric hospital care comprised 88% of the total costs of care observed. Data on this key cost driver were available for a high proportion of patients randomised to treatment (88% FGA and 91% SGA). This suggests that the impact of missing data on total cost per person due to attrition is likely to be relatively low.
The demographic and clinical characteristics of participants at baseline were well balanced between the treatment allocation groups for most characteristics. However, there were observed differences between the groups in health status and utility as measured by the EQ–5D, the costs of hospital care for the 3 months prior to randomisation, and the trial centre in which the patient was treated. These factors were included as covariates in the cost-effectiveness analyses. The analysis of covariance reduced the benefit of first-generation antipsychotics compared with an unadjusted analysis, but still indicated that these drugs are likely to be more cost-effective than second-generation antipsychotics.
Although the randomisation procedure appeared to result in well-balanced groups, the participants referred to the trial might have been a selected and unrepresentative sample of patients. Parallel audit in the clinical services in two of the centres suggested that only 20–37% of possibly eligible patients (those with a diagnosis of schizophrenia whose drug treatment was being changed) were randomised into the trial. The remaining patients were either not referred to the trial or refused to participate. There was insufficient information to determine whether the patients who participated in the trial were representative of eligible patients requiring a change in medication. Therefore, patients referred into the trial might not be representative of the population of patients requiring a change in medication owing to poor response or intolerance, reducing generalisability to the population of interest. However, there was an apparent lack of equipoise for both clinicians and patients, with a belief that second-generation antipsychotics were superior to the first-generation drugs. A survey of the attitudes of clinicians at each of the trial centres, conducted as part of the trial, supports this lack of clinical equipoise. The survey found that 90% of respondents believed that second-generation antipsychotics were associated with less severe side-effects than the conventional drugs and 38% believed that the former were superior in terms of clinical efficacy (Reference Lloyd, Markwick and PageLloyd et al, 2005). If the main reason for the low participation rate was a belief in the superiority of second-generation antipsychotics, then the trial sample may be representative of the eligible population.
The trial was conducted in five centres in England, covering 14 NHS trusts. The trusts and trial centres represented a range of geographical areas, with populations that varied in socio-demographic and economic characteristics; the trial settings thus are likely to include the range of treatment settings and patient populations encountered in routine practice.
The trial followed patients for 12 months from baseline. Although this is a relatively long period of follow-up compared with earlier trials of antipsychotic medication, it may not be long enough to observe changes in costs and outcomes over the course of a chronic illness. The data indicate that over the course of the 12-month follow-up period up to half of patients changed medication. In addition, both health status and costs changed over this time. Therefore, the results of this analysis may not reflect what will happen over the longer term.
Comparison with previous studies
The results of this analysis accord with the overall conclusions of two UK-based economic modelling studies (Reference Davies and LewisDavies & Lewis, 2000, Reference Bagnall, Jones and GinnellyBagnall et al, 2003). The majority of economic studies comparing first- and second-generation antipsychotics suggest that the latter drugs may be cost-effective (Reference Almond and O'DonnellAlmond & O'Donnell, 2000; Reference Gregor, Allicar and LilliuGregor et al, 2000; Reference Lewis, McCrone and FrangouLewis et al, 2001; Reference Lynch, Morrison and GravesLynch et al, 2001; Reference Oh, Lanctot and MittmannOh et al, 2001; Reference Gianfrancesco, Durkin and MahmoudGianfrancesco et al, 2002; Reference Hosak and BahbouhHosak & Bahbouh, 2002; Reference Palmer, Brunner and Ruiz-FloresPalmer et al, 2002; Reference Tilden, Aristedes and MeddisTilden et al, 2002). However, the robustness of these studies is uncertain since they are limited in the range of antipsychotic drugs considered, scale and methodology (Reference Davies and LewisDavies & Lewis, 2000; Reference Knapp, Ilson and DavidKnapp et al, 2002; Reference Bagnall, Jones and GinnellyBagnall et al, 2003). For instance, the usual first-generation antipsychotic comparator in previous studies was haloperidol, known to cause substantial rates of side-effects (Reference Geddes, Freemantle and HarrisonGeddes et al, 2000). In addition, most of these studies rely on simulations of data from short-term efficacy trials with no primary economic focus. In contrast, in this study haloperidol was selected by clinicians in only 8% of cases randomised to the FGA arm.
Implications of the study
Overall, this study confirms that there is no evidence to suggest second-generation antipsychotics are more cost-effective than first-generation ones. This is supported by recent meta-analyses of the clinical evidence (Reference LiebermanLieberman, 2006), an observational study (Reference Kilian, Dietrich and ToumiKilian et al, 2004) and two pragmatic, long-term, randomised studies (Reference Rosenheck, Perlick and BinghamRosenheck et al, 2003; Reference Lieberman, Stroup and McEvoyLieberman et al, 2005), which failed to find evidence for the superiority of second-generation antipsychotics in terms of effectiveness or quality of life.
Practice and prescribing guidelines categorise the available antipsychotics for schizophrenia into first- and second-generation. This study is the first, non-commercially funded, integrated economic and clinical trial to reflect routine practice and guidelines and compare the two classes of antipsychotics in the context of the NHS. The primary and sensitivity analyses of the economic data indicate that first-generation antipsychotics may be cost-saving and associated with a gain in QALYs compared with the second-generation agents. There was no evidence that the second-generation drugs were more cost-effective than the first-generation ones. The cost-effectiveness acceptability analysis supported this conclusion. In other words, for people who required a change in treatment, switching to a first-generation antipsychotic may be as – or more – cost-effective than switching to a second-generation antipsychotic. However, as described above, there were limitations to the study that increase the level of uncertainty in the economic results.
None the less, the data add to a growing body of evidence that questions the perception that second-generation antipsychotics are superior to the earlier drugs in terms of clinical effectiveness, quality of life and cost-effectiveness. The data from this large, pragmatic, randomised controlled trial suggest that careful prescribing of first-generation antipsychotics in routine practice may be cost-effective. Further observational and pragmatic trials are required to identify cost-effective antipsychotic use, the determinants of costs and outcomes and the roles of first- and second-generation antipsychotic drugs in long-term management.
Acknowledgements
Financial support was provided by a project grant from the Secretary of State for Health under the UK NHS Technology Assessment Programme (project number 96/19/06). The views and opinions expressed by the authors do not necessarily reflect those of the Department of Health.
In addition to the authors, members of the CUtLASS team included Graham Dunn, Robin Murray, Rob Kerwin, David Taylor and Martin Knapp who contributed to the design and analysis of the clinical and economic trial. Maria Clark, Tanya Hawthorn, Fiona Hynes, Fionnbar Lenihan, Jenny Massie, Ahmed Mahmoud, Paul Monks, Alex Barrow, Tracy Fay, Maurice Gervin and Susie Morrow were essential in the management and execution of the study. Patient assessments were carried out by Candice Blackwell, Nerys Gooding, Rhona Howitt, Natasha Newbery, Eleanor Page, Joanne Shepherd and Emma Sowden. Secretarial support from Patricia Smith and Helen Woodiwiss. Data entry and IT support from Simon Foster, Xinming Jin, Zhenhua Zhu, John Cooley, Paul Schofield and Lisa Riley.


eLetters
No eLetters have been published for this article.