


Despite the high prevalence and public health importance of the common mental disorders (Reference WeichWeich, 1997) there is no small-area index specific to mental health for health needs assessment and planning the appropriate provision of services in primary care settings. For severe mental illness, the Mental Illness Needs Index (MINI; Glover et al, Reference Glover, Robin and Enami1998, Reference Glover, Arts and Wooff2004) can be used to estimate need for specialist psychiatric services in areas definable by electoral wards. In this study we investigated the small-area ecological relationship between MINI scores and common mental disorders, whether MINI was associated with these disorders after accounting for individual risk factors, and whether any observed associations varied in magnitude with geographical scale and population subgroup, characterised by age, gender, social class and employment status.
METHOD
Data source
We analysed data from the Caerphilly Health and Social Needs Survey, a community study of health inequality set in Caerphilly county borough, Wales, UK, described in detail elsewhere (Reference Fone, Dunstan and ChristieFone et al, 2006). The borough is one of the 22 local government areas in Wales, situated between the cities of Cardiff and Newport in the south and the Brecon Beacons National Park to the north. Briefly, we carried out a cross-sectional postal questionnaire survey of the resident adult population aged 18 years and over in autumn 2001 and obtained a representative data-set on 12 408 residents of the borough (adjusted response 63%). The random sample was stratified by census ward and drawn from the general practitioner age-gender register held by the health authority. The survey included questions on a wide range of demographic and socio-economic factors, and the 36-item Short Form Health Survey (SF–36) version 2 health status questionnaire (Reference Ware, Kosinski and DeweyWare et al, 2000a ).
Mental health outcome measure
The five-item Mental Health Inventory (MHI–5) sub-scale of the SF–36 version 2 health status questionnaire was used as the measure of common mental disorder (Reference Ware, Kosinski and DeweyWare et al, 2000a ). The validity and reliability of the MHI–5 is well established and reflects the continuously distributed nature of mental health status in the population (Reference Ware and GandekWare & Gandek, 1998; Reference Ware, Snow and KosinskiWare et al, 2000b ). Studies have shown that the MHI–5 is at least as good a measure of common mental disorder as the commonly used 12-item General Health Questionnaire (Reference Weinstein, Berwick and GoldmanWeinstein et al, 1989; Reference Berwick, Murphy and GoldmanBerwick et al, 1991; Reference McCabe, Thomas and BrazierMcCabe et al, 1996).
The MHI–5 used in the SF–36 version 2 comprises five questions relating to the past 4 weeks: ‘Have you been very nervous?’ ‘Have you felt so down in the dumps that nothing could cheer you up?’ ‘Have you felt calm and peaceful?’ ‘Have you felt down-hearted and depressed?’ ‘Have you been happy?’ Each of the five questions has five response categories which are scored from 1 to 5: ‘all of the time’ 1; ‘most of the time’ 2; ‘some of the time’ 3; ‘a little of the time’ 4; or ‘none of the time’ 5. Thus each respondent could achieve a total score within the range 5–25. For the third and fifth questions the scoring was reversed so that lower scores indicated worse mental health status on a continuous scale. We transformed the response scores and imputed missing data to a scale of range 0 to 100 using the standard method (Reference Ware, Snow and KosinskiWare et al, 2000b ).
Survey population for analysis
We restricted the analysis to respondents aged less than 75 years because the SF–36 is less reliable in UK elderly populations (Reference Hayes, Morris and WolfeHayes et al, 1995; Reference Hill, Harries and PopayHill et al, 1996) and the proportion of missing mental health and socio-demographic response data in the data-set increased markedly for those over the age of 75 years. The mental health score was available for 10 653 (97.8%) of the 10 892 respondents aged 18–74 years.
Individual level variables
We selected variables that were significantly associated with the mental health score in univariable analyses. Age was modelled as a continuous variable, centred around the mean to avoid estimation problems. Gender, occupational social class, employment status and housing tenure were modelled as categorical variables (Table 1).
Table 1 Univariable associations between mental health and individual risk factors
| Respondents n (%) | Mental health score1 Mean (s.d.) | Disorder present n (%) | 95% CI | |
|---|---|---|---|---|
| Gender | ||||
| Male | 4770 (44.8) | 71.85 (20.79) | 1369 (28.7) | 27.4-30.0 |
| Female | 5883 (55.2) | 67.44 (22.20) | 2126 (36.1) | 34.9-37.4 |
| Social class | ||||
| I, II | 2407 (22.6) | 74.35 (19.38) | 535 (22.2) | 20.6-23.9 |
| IIINM | 2103 (19.7) | 70.75 (20.84) | 634 (30.1) | 28.2-32.1 |
| IIIM | 2171 (20.4) | 71.13 (21.31) | 645 (29.7) | 27.8-31.7 |
| IV, V | 2647 (24.8) | 66.45 (22.01) | 1039 (39.3) | 37.4-41.1 |
| Other | 635 (6.0) | 57.38 (25.33) | 350 (55.1) | 51.2-58.9 |
| Missing data | 690 (6.5) | 65.20 (21.72) | 292 (42.3) | 38.7-46.0 |
| Employment status | ||||
| Employed | 5507 (51.7) | 74.38 (18.23) | 1251 (22.7) | 21.6-23.8 |
| Unemployed | 4665 (43.8) | 64.24 (23.86) | 2244 (48.1) | 46.7-49.5 |
| Seeking work | 286 (2.7) | 64.53 (22.92) | 114 (39.9) | 34.4-45.6 |
| Home or carer | 804 (7.5) | 67.12 (22.06) | 288 (35.8) | 32.6-39.2 |
| Student/training | 190 (1.8) | 71.62 (20.81) | 57 (30.0) | 23.9-36.9 |
| Incapacity | 1274 (12.0) | 48.75 (23.55) | 910 (71.4) | 68.9-73.8 |
| Retired | 2111 (19.8) | 71.78 (20.48) | 641 (30.4) | 28.4-32.4 |
| Missing data | 481 (4.5) | 62.77 (22.53) | 234 (48.6) | 44.2-53.1 |
| Housing tenure | ||||
| Owner occupier | 8562 (80.4) | 71.25 (20.86) | 2495 (29.1) | 28.2-30.1 |
| Not owner occupier | 1943 (18.2) | 61.78 (23.64) | 932 (48.0) | 45.8-50.2 |
| Missing data | 148 (1.4) | 63.72 (19.53) | 68 (45.9) | 38.1-54.0 |
Calculation of the area-level MINI scores
Two spatial levels are defined by the 2001 census in England and Wales within the study data-set: 110 lower super output areas which are nested within 33 electoral wards. Lower super output areas are built up from around five output areas, the smallest geographical scale used in the census. They are constrained to a minimum population size of 1000 and in Caerphilly borough the mean population was 1541 (range 1010–2141). For wards, the mean population was 5137 (range 1803–11 530).
First, we calculated the MINI score for both of these geographical areas from the six census variables (Table 2) using the original method at ward level described by Glover et al (Reference Glover, Robin and Enami1998). Calculation of MINI scores was less straightforward for lower super output areas because detailed tables of census data at this geographical level have not been released by the Office for National Statistics (ONS). However, the Census Key Statistics univariate tables data-set, which is available online from Neighbourhood Statistics (http://www.neighbourhood.statistics.gov.uk), contains selected variables at lower super output area which closely match the definitions required to calculate the MINI score. There are two small differences in these data compared with the data available at ward level which are not likely to make any material difference to the final MINI score: the economically active age range is 16–74 years (instead of the usual age range for the economically active of 16–59 years for women and 16–64 years for men) and the car ownership variable is defined by household instead of by individual. The MINI score is standardised to a mean of 100 in the area of study with a standard deviation of 10.
Table 2 Census variables included in the Mental Illness Needs Index and their weighting within the index, reproduced from Glover et al (Reference Glover, Robin and Enami1998) with permission
| Variable | Weight |
|---|---|
| Proportion of adult population single, widowed or divorced (age 16+ years) | 1.8 |
| Proportion of population resident in households with no car | 3.8 |
| Proportion of population aged 16+ years registered permanently sick | 2.5 |
| Proportion of economically active adults unemployed | 0.1 |
| Proportion of population living in households not self-contained | 1.4 |
| Proportion of population resident in hostels, common lodging houses, miscellaneous establishments or sleeping rough | 0.4 |
Second, we wished to follow Glover et al (Reference Glover, Arts and Wooff2004) and calculate the updated lower super output area MINI score, which is based on the modelled relationship between admission rates for severe mental illness and new population data used in the construction of the Index of Multiple Deprivation in England (Reference Glover, Arts and WooffGlover et al, 2004). However, the updated MINI is specific to England and the differences in the method of construction between the Welsh and English Indices of Multiple Deprivation mean that an updated MINI for Wales that is comparable to England cannot be calculated. We therefore used the Welsh Index of Multiple Deprivation 2005 (WIMD2005; Local Government Data Unit–Wales, 2005) as the closest approximation for the updated MINI in the analysis.
Statistical analysis
We assessed the ecological correlation between the MINI scores and the mean area MHI–5 scores with Spearman's rank correlation coefficient. We then analysed the data-set in two separate multilevel models. The first model included the 10 653 individuals at level 1 nested within 110 lower super output areas. The second model included the 10 653 individuals at level 1 nested within the 33 census wards at level 2. We used a separate model for each of the geographical levels to avoid the collinearity that would have resulted from modelling MINI at the two spatial levels simultaneously in one combined model.
The MHI–5 was modelled as a continuously distributed dependent variable in a normal response multilevel model. The modelling strategy was designed to meet the objectives of the study and started with ‘null’ two-level variance components models of random intercepts. Here the variation in the mental health score was modelled by random intercept terms for either lower super output areas or wards, and a random error term for individuals. In model 1, the lower super output area MINI and WIMD2005 and the ward MINI were entered into the respective null models as continuous variables to obtain the unadjusted estimates. We modelled the MINI variables as z-scores so that the parameter estimate represents the change in predicted mental health score for a change in magnitude of the MINI of 1 s.d. Modelling z-scores meant that the MINI estimates could be compared directly between the two geographical levels used in the study. Individual-level variables were then entered in model 2. The categorical variables were modelled so that the reference categories were male, social class I or II, employed and owner-occupier. We modelled missing data for each categorical variable as a dummy term to avoid data loss and to permit direct comparison of each model using the deviance statistic. In this adjusted model the residual lower super output area and ward level random variances were assessed after including the individual-level variables. Finally, in model 3, we assessed whether any association between the mental health score and MINI varied with the age, gender, social class and employment status of individuals by modelling cross-level interactions between MINI and these individual-level variables.
The models were fitted in MLwiN software version 2.02 (Reference Rasbash, Browne and GoldsteinRasbash et al, 2001) and the parameters were estimated using Markov Chain Monte Carlo (MCMC) methods with iterative generalised least squares estimates (IGLS) as the starting values (Reference GoldsteinGoldstein, 2003). Credible estimates for the 2.5th–97.5th quantiles for the random parameters were obtained using MCMC. Preliminary model fitting using IGLS was assessed by change in the deviance statistic. The validity of the final models was assessed using standard diagnostic plots of residuals at each level in the model.
RESULTS
The mean mental health score for all respondents was 69.4 (s.d. = 21.7, median 75.0, interquartile range 55.0–85.0). Survey responses were obtained from individuals living in all 110 lower super output areas (mean 97 responses) and from all 33 wards (mean 323 responses). The mean mental health score for lower super output areas varied between 55.8 and 80.7 (mean 69.7, s.d. = 4.3) and for wards between 61.4 and 76.1 (mean 69.3, s.d. = 3.1).
The range of MINI scores was 71.2–124.0 for lower super output areas and 80.2–120.1 for wards. Figure 1 shows the spatial variation in MINI and mental health scores for lower super output areas, showing poorer mental health and higher MINI scores in the north of the borough. The MINI and mean mental health score were significantly correlated for both lower super output area (MINI: r=–0.69, P < 0.001; WIMD2005: r = –0.73, P < 0.001) and ward levels (r = –0.69, P < 0.001).

Fig. 1 Spatial variation in mean mental health, Mental Illness Needs Index (MINI) and Welsh Index of Multiple Deprivation 2005 (WIMD2005) scores at lower super output areas in Caerphilly borough.
Null models
The random variance estimates are shown in Table 3 for each area-level model. The variances at level 2 represent the variation in mean mental health score between areas. The majority of the variance occurred at the individual level, with 1.78% (0.96–3.10) at ward level and 2.75% (1.87–3.89) at lower super output area level.
Table 3 Variance components for two-level multilevel regression mental health models
| Model | Null model | Model 1 (null + MINI) | Model 2 (model 1+individual variables)1 | |||
|---|---|---|---|---|---|---|
| Variance | 2.5th—97.5th credible estimates | Variance | 2.5th—97.5th credible estimates | Variance | 2.5th—97.5th credible estimates | |
| Lower super output area MINI | ||||||
| Level 1: individual | 457.8 | 445.6-470.2 | 457.9 | 445.7-470.4 | 384.9 | 374.4-395.6 |
| Level 2: area | 12.94 | 8.79-18.48 | 4.89 | 2.54-7.99 | 1.78 | 0.42-3.55 |
| Lower super output area WIMD2005 | ||||||
| Level 1: individual | 457.8 | 445.6-470.2 | 458.0 | 445.8-470.5 | 385.0 | 374.4-395.7 |
| Level 2: area | 12.94 | 8.79-18.48 | 2.82 | 0.95-5.28 | 1.46 | 0.25-3.13 |
| Ward | ||||||
| Level 1: individual | 463.3 | 451.0-475.9 | 463.5 | 451.4-476.2 | 385.9 | 375.7-396.3 |
| Level 2: ward | 8.40 | 4.48-14.79 | 2.49 | 0.70-5.26 | 1.41 | 0.34-3.14 |
Associations between mental health and the MINI
In model 1, entering the MINI variable to the null models substantially reduced the random variances at both area levels (Table 3). The reduction in the lower super output area variance was greater for WIMD2005 which therefore explained a greater part of the variation in mental health scores. The MINI was significantly associated with individual mental health at both geographical levels in their respective models (Table 4). These associations were greater at the smaller spatial scale of the lower super output area, with some evidence of a stronger effect for WIMD2005 than MINI. We also modelled a quadratic and cubic function of the MINI score to assess the possibility of a non-linear effect, but these terms were not statistically significant. In model 2, addition of the individual-level variables further reduced the random variance at area level, showing the extent to which variation between individuals explained the variation in mean mental health scores between areas (see Table 3). The difference between the variance estimates for WIMD2005 and MINI was now smaller. Low mental health scores remained significantly associated with higher levels of each MINI score after adjusting for individual-level variables, with a marginally stronger effect for WIMD2005 compared with MINI (see Table 4).
Table 4 Associations between the Mental Illness Needs Index and Welsh Index of Multiple Deprivation scores and individual mental health in two-level multilevel linear regression models
| Model | Model 1 (null + MINI) | Model 2 (model 1 + individual variables)1 | Model 3 (model 2 + cross-level interaction) | |||
|---|---|---|---|---|---|---|
| Estimate (s.e.) | 2.5th—97.5th credible estimates | Estimate (s.e.) | 2.5th—97.5th credible estimates | Estimate (s.e.) | 2.5th—97.5th credible estimates | |
| Lower super output area | ||||||
| MINI2 | -2.91 (0.32) | -3.54 to -2.27 | -1.17 (0.25) | -1.67 to -0.67 | -0.97 (0.26) | -1.48 to -0.45 |
| MINI × incapacity3 | -1.95 (0.69) | -3.30 to -0.60 | ||||
| WIMD20052 | -3.20 (0.28) | -3.74 to -2.64 | -1.27 (0.24) | -1.75 to -0.80 | -1.08 (0.25) | -1.57 to -0.59 |
| WIMD2005 × incapacity3 | -1.40 (0.58) | -2.52 to -0.27 | ||||
| Ward | ||||||
| MINI2 | -2.51 (0.38) | -3.29 to -1.76 | -0.93 (0.31) | -1.53 to -0.31 | -0.78 (0.32) | -1.43 to -0.15 |
| MINI × incapacity3 | -1.20 (0.62) | -2.43 to 0.03 | ||||
The magnitude of the association between MINI and mental health can be interpreted by comparison with the association with social class. The raw parameter estimate of the lower super output area MINI score was –0.127. The MINI score ranges from 71.2 to 124.0 (a range of 52.8). Multiplying the raw estimate by the range gives a value of –6.1. The equivalent estimate for WIMD2005 was –6.2 and so both were nearly twice as large as the social class IV/V parameter estimate of –3.4.
Cross-level interactions between MINI and population subgroups
In model 3, both MINI and the cross-level interaction between MINI and the incapacity (defined as permanent sickness or disability) category of economic inactivity were statistically significant at both area levels (see Table 4). Thus, within lower super output areas and wards the gradient of association between mental health and MINI was more steeply negative for people economically inactive from permanent sickness or disability (incapacity) compared with the other categories of employment status (Fig. 2). Other cross-level interactions for gender, social class and tenure categories modelled were non-significant.
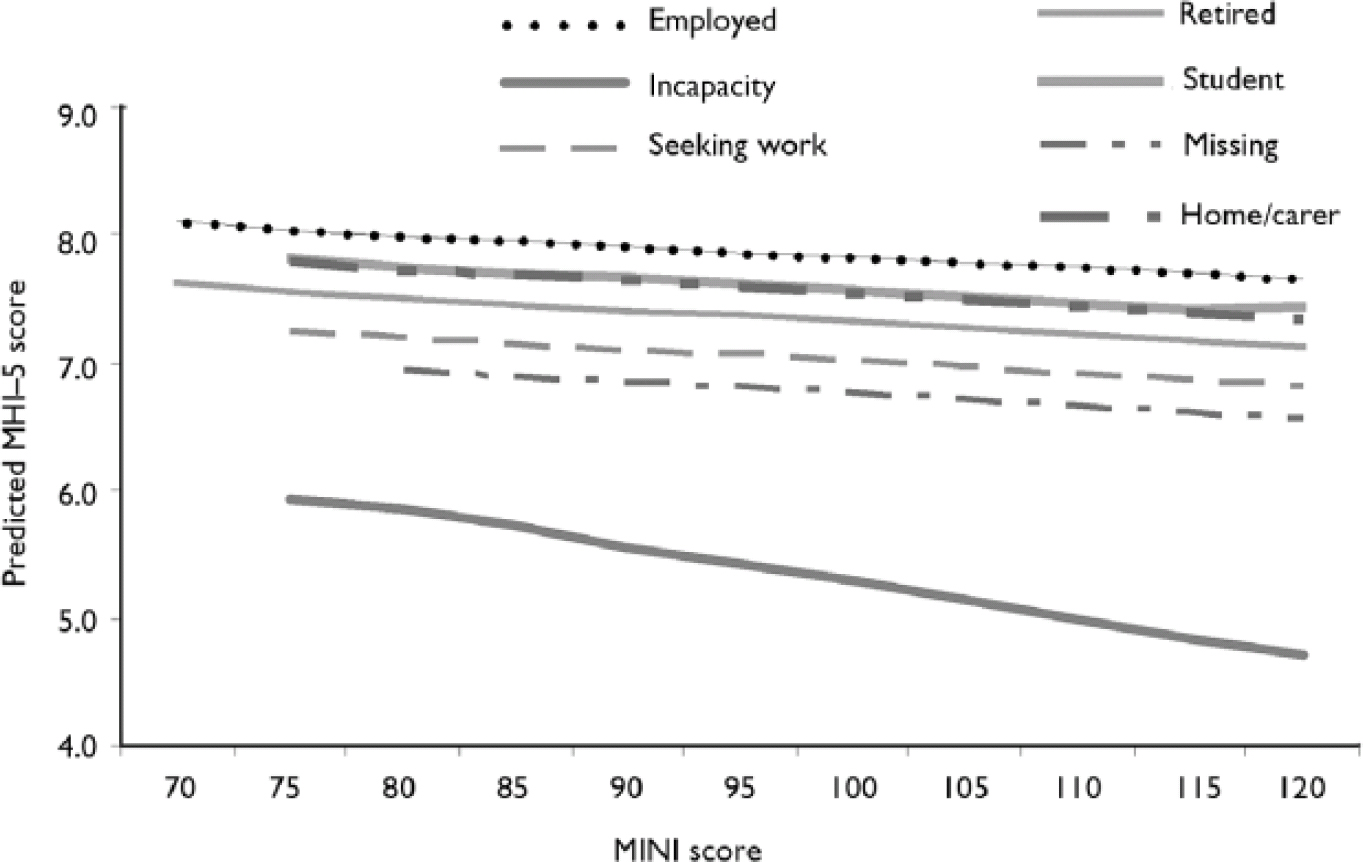
Fig. 2 Model predicted mental health scores on the five-item Mental Health Inventory (MHI–5) v. the lower super output area Mental Illness Needs Index (MINI) score, categorised by individual employment status.
Model checking
Owing to the negative skew of the MHI–5 scores, the individual-level residuals were, as expected, negatively skewed. The model residuals at area level were normally distributed. No spatial pattern in these residuals was found and their correlations with the MINI score were not significantly different from zero.
DISCUSSION
We have shown that the small-area MINI score is significantly associated with common mental disorders. First, we found a strong ecological association between the MINI score and the small-area mean MHI–5 score. Second, in a multilevel analysis we found that MINI score was significantly associated with common mental disorders, after controlling for individual risk factors. This association was stronger at the smaller spatial scale of the lower super output area than the larger and more heterogeneous census ward. The association of common mental disorders with MINI score was significantly stronger in people who were economically inactive from permanent sickness or disability (incapacity). This group has the highest prevalence of common mental disorders in Wales (Reference Fone and DunstanFone & Dunstan, 2006).
We found little practical difference between MINI and the WIMD2005, used as the nearest proxy to the updated MINI in Wales. The strengths of association were not substantially different, but the WIMD2005 explained a little more of the random variation in mental health status. This suggests that WIMD2005 may be a better predictor of the area mean mental health score. This will be tested in further research.
Strengths and limitations of the study
The Caerphilly Health and Social Needs Survey has the strength of a large sampling fraction, resulting in a response data-set including around one in ten of a socially diverse population living in a geographically defined area, with detailed exposure data linked to the smallest census area level using the postcode of respondents. With a mean of 323 respondents per ward and 97 respondents per lower super output area, it was likely that the data-set was sufficiently large to meet the suggested ‘rules’ on sample sizes for multilevel analyses (Reference Subramanian, Jones, Duncan, Kawachi and BerkmanSubramanian et al, 2003). Thus we were able to carry out robust analyses at smaller spatial scales than reported in the general multilevel literature (Reference Pickett and PearlPickett & Pearl, 2001), and were able to assess the MINI at the small geographical level of the lower super output area. This has the added advantage of being the spatial level at which the WIMD2005 is calculated for use in small-area planning and resource allocation in Wales.
The limitations of the study relate to the potential for bias. We were not able to validate survey responses to the MHI–5 scale with a clinical interview owing to the size of the study. One statistical property of the MHI–5 is that the distribution of responses is significantly negatively skewed and thus might have violated the assumptions for linear regression. However, in previous research we have found very similar results from modelling the scale using the square transformation or as a binary variable of ‘case’ and ‘non-case’ of common mental disorder. This suggests that the normal response models were robust to departures from normality (Reference Fone and DunstanFone & Dunstan, 2006; Reference Fone, Dunstan and WilliamsFone et al, 2007).
The original MINI (Reference Glover, Robin and EnamiGlover et al, 1998) has the advantage of being calculated from UK census data, allowing comparability throughout the UK. One of the difficulties in using the original MINI in current research and for service planning is that it is less straightforward to calculate using 2001 census data than using the original 1991 data. Calculating the MINI for lower super output areas is hampered as ONS does not release the detailed tables of data required to calculate the MINI using the exact methodology described by Glover et al (Reference Glover, Robin and Enami1998). Thus, a small compromise in variable definitions is necessary for using census data for lower super output areas. One advantage of using the MINI calculated from 2001 census data in this study is that the scores were almost exactly contemporaneous with the survey data, thus avoiding bias from temporal mismatch (Reference Buzzelli and SuBuzzelli & Su, 2006).
The updated MINI (Reference Glover, Arts and WooffGlover et al, 2004) has the advantage of being updatable on a more regular basis as it is derived from the English Index of Multiple Deprivation. However, it is not possible to derive these MINI scores for Wales, Scotland and Northern Ireland because the different versions of the Index of Multiple Deprivation used in the four countries of the UK limit comparability within the UK.
Mental Illness Needs Index scores derived from census data can also be calculated for general practice populations using a weighted proportional allocation methodology (Reference Majeed, Cook and PolonieckiMajeed et al, 1995), based on the distribution of practice populations within wards or lower super output areas. This is considerably less straightforward for the Indices of Multiple Deprivation in view of the more complex methodology used in their construction.
Comparison with previous literature
To our knowledge no previous study has examined the associations between MINI score and common mental disorders. The original MINI was developed using 1991 census ward data to predict the period prevalence of acute psychiatric admission in patients aged 16–64 years in the former North East Thames region (Reference Glover, Robin and EnamiGlover et al, 1998). A study set in Nottingham investigated associations between the MINI and the ward prevalence of psychiatric admission and incidence rates of psychosis for the years 1992 and 1993 and found that the MINI score was associated with both outcomes (Reference Croudace, Kayne and JonesCroudace et al, 2000). One study used MINI to stratify general practices in a cluster randomised controlled trial which evaluated the effect of guidelines for the diagnosis of minor psychiatric morbidity (Reference Croudace, Evans and HarrisonCroudace et al, 2003). However, this study did not investigate the association between the MINI and the prevalence of common mental disorders. Our study suggests further evidence of the generalisability of MINI as a measure of such disorders.
Usefulness of the MINI for needs assessment and service planning
Common mental disorders are highly prevalent in the community and among primary care consulting populations (Reference WeichWeich, 1997; Reference Craig and BoardmanCraig & Boardman, 1997). Yet there is no rational way of allocating resources at local level to support appropriate interventions. In primary care settings, decisions about who should receive treatment for depression, anxiety and other psychological morbidity seem to be made on a patient-by-patient basis and are influenced by the severity of the particular patient's symptoms (Reference Hyde, Evans and SharpHyde et al, 2005). Service planning and resource allocation at the population level by primary care organisations require some area-based indication of the likely level of need.
Our results suggest that MINI can be used as a proxy for the prevalence of common mental disorders at small geographical area, practice and primary care organisation level. The MINI can be used for needs assessment and service planning in community settings in the same way that it is used for severe mental illness in secondary care settings. Scores calculated for general practice populations will be useful to primary care organisations in understanding the distribution of need for community mental health services within their defined populations. The establishment of such epidemiological relationships is important in the pursuit of transparent equitable resource allocation and the reconfiguration of mental health services away from the acute sector, allowing those with common mental disorders to be effectively managed in primary care.
Acknowledgements
We thank the Caerphilly study research team, and participating staff of Caerphilly County Borough Council and Caerphilly Local Health Group (now Caerphilly Local Health Board), for their help in running this collaborative study. We are grateful to Margaret Webber of the National Public Health Service for Wales for help in calculating MINI scores and to Gyles Glover for a personal communication of helpful documents. The study was funded by the Wales Office of Research and Development.


 Open access
eLetters
No eLetters have been published for this article.