


Anorexia nervosa is commonly associated with severe physical, psychological and social impairments, high levels of mortality (National Collaborating Centre for Mental Health, 2004) and a significant cost burden (Reference Striegel-Moore, Leslie and PetrillStriegel-Moore et al, 2000; Reference Simon, Schmidt and PillingSimon et al, 2005). Young people with anorexia nervosa are often admitted to hospital for treatment. This is disruptive to school, family and social life, and in-patient treatment is an expensive option, yet evidence to support its cost-effectiveness is lacking (Reference Romeo, Byford and KnappRomeo et al, 2005). A recent systematic review did not identify any economic evaluations of treatments for anorexia nervosa (National Collaborating Centre for Mental Health, 2004). One subsequent modelling study has been reported (Reference Crow and NymanCrow & Nyman, 2004). However, the authors acknowledge the limitations of modelling and the need for controlled trials. We report the results of an economic evaluation of psychiatric in-patient, specialist out-patient and general out-patient services for adolescents with anorexia nervosa carried out alongside a randomised controlled clinical evaluation – the Treatment Outcome for Child and adolescent Anorexia Nervosa (TOuCAN) trial (ISRCTN39345394).
METHOD
The aim of the TOuCAN trial was to explore the clinical and cost-effectiveness of in-patient, specialist out-patient and general out-patient services for adolescents with anorexia nervosa. The main economic hypotheses were that: (a) specialist out-patient services would be more cost-effective than general out-patient treatment in community child and adolescent mental health services (CAMHS); and (b) out-patient services would be more cost-effective than in-patient services.
Trial design
The design of this multicentre randomised controlled trial is described in detail in the accompanying paper (Reference Gowers, Clark and RobertsGowers et al, 2007, this issue). In brief, adolescents aged 12–18 years with a DSM–IV diagnosis of anorexia nervosa were recruited to the study from community CAMHS in the north-west of England between March 2000 and December 2003. No exclusions were made on the grounds of clinical severity, but the responsible clinician reserved the right to refer for acute medical management according to urgent need. Participants with severe intellectual difficulties or severe, chronic comorbid physical conditions affecting digestion and/or metabolism were excluded. Randomisation was carried out by an independent statistical centre. Stochastic minimisation was used to control for gender, age (above and below 16 years) and body mass index (BMI) (above and below 15.5).
Interventions
In-patient psychiatric treatment was for 6 weeks in the first instance, extended as clinically indicated and determined by the treating service. The in-patient services used a multidisciplinary psychiatric approach with the aim of normalising eating, restoring healthy weight and facilitating psychological (cognitive) change. Specialist out-patient treatment, described in detail elsewhere (Reference Gowers and SmythGowers & Smyth, 2004; Reference GowersGowers, 2006), was manualised and comprised individual cognitive–behavioural therapy (CBT), parental counselling with the participant, dietary therapy and multi-modal feedback. Treatment as usual in community CAMHS generally involved a multidisciplinary, individual- and family-based approach, with variable dietetic and paediatric liaison.
Clinical outcomes
Research assessors masked to treatment allocation carried out assessments at baseline, 1 and 2 years after trial entry. The a priori primary outcome measure for the clinical and economic evaluation was the Morgan–Russell Average Outcome Scale (MRAOS; Reference Morgan and HaywardMorgan & Hayward, 1988), adjusted for adolescents. Full details of outcome measures, their reliability and validity, are reported in the accompanying paper (Reference Gowers, Clark and RobertsGowers et al, 2007, this issue).
Cost
The economic evaluation took a broad service-providing perspective, including that of the health, social services, education, voluntary and private sectors. Information on resource use was collected in interview at the 1- and 2-year follow-up assessments using the Child and Adolescent Service Use Schedule (CA–SUS), developed by the authors in previous research with young people and adapted for the purpose of the current study (Reference Byford, Harrington and TorgersonByford et al, 1999; Reference Harrington, Peters and GreenHarrington et al, 2000; Reference Barrett, Byford and ChitsabesanBarrett et al, 2006). Data on hospital contacts were collected from clinical records to avoid patients revealing their treatment group to the research assessors.
All unit costs were for the financial year 2003–2004. Costs in the second year were discounted at a rate of 3.5%, as recommended by the National Institute for Health and Clinical Excellence (National Institute for Clinical Excellence, 2004). This was varied from 0 to 6% in sensitivity analysis.
All National Health Service (NHS) hospital contacts, including the trial interventions, were costed using NHS reference costs (Department of Health, 2004). The unit costs of private sector in-patient stays were collected through direct personal communication with each facility. Unit costs of community health and social services were taken from national publications (Reference Curtis and NettenCurtis & Netten, 2004). The costs of schooling came from a number of sources including various Ofsted reports (the inspectorate and regulatory body for schools in England, see http://www.ofsted.gov.uk) and published documents (Reference Berridge, Beecham and BrodieBerridge et al, 2002; Independent Schools Council, 2004). Medications were costed using the British National Formulary (British Medical Association & Royal Pharmaceutical Society of Great Britain, 2004). Where necessary, unit costs were inflated to 2003–2004 costs using the Hospital and Community Health Services inflation indices (Reference Curtis and NettenCurtis & Netten, 2004).
Statistical methods
All economic analyses were carried out on an intention-to-treat basis using a statistical analysis plan drawn up prior to the analysis of the data. The primary analysis was of total costs over 2 years for the sample of young people with complete economic data.
Although costs were not normally distributed, analyses compared mean costs in the three groups using analysis of covariance with covariates for pre-specified baseline characteristics: site (Liverpool and Manchester), gender, age at baseline, baseline BMI and baseline MRAOS score. The robustness of the parametric tests was confirmed using bootstrapping (Reference Efron and TibshiraniEfron & Tibshirani, 1993), as recommended by Barber & Thompson (Reference Barber and Thompson1998). The impact of drop-out was assessed by comparing the baseline characteristics of participants who had missing data with those who had full economic data.
Cost-effectiveness was assessed through the calculation of incremental cost-effectiveness ratios (ICER) – the additional costs of one intervention compared with another divided by the additional effects of one intervention compared with another (Reference Van Hout, Al and GordonVan Hout et al, 1994), in this case using the MRAOS measure of effectiveness. When more than two strategies are compared, ICERs are calculated using rules of dominance and extended dominance (Reference Johannesson and WeinsteinJohannesson & Weinstein, 1993). Strategies are ranked by cost, from the least expensive to the most expensive, and if a strategy is more expensive and less effective than the previous strategy, it is said to be dominated and is excluded from the calculation of ICERs. This process compares strategies in terms of observed differences in costs and effects, regardless of the statistical significance of the difference.
Uncertainty around the cost and effectiveness estimates was represented by cost-effectiveness acceptability curves (Reference Van Hout, Al and GordonVan Hout et al, 1994; Reference Fenwick, Claxton and SculpherFenwick et al, 2001). Repeat re-sampling from the costs and effectiveness data (bootstrapping) was used to generate a distribution of mean costs and effects for the three treatments. These distributions were used to calculate the probability that each of the treatments is the optimal choice, subject to a range of possible maximum values (ceiling ratio, λ) that a decision-maker might be willing to pay for a unit improvement in MRAOS score. Cost-effectiveness acceptability curves are presented by plotting these probabilities for a range of possible values of the ceiling ratio. These curves incorporate the uncertainty that exists around the estimates of mean costs and effects as a result of sampling variation and uncertainty regarding the maximum cost-effectiveness ratio that a decision-maker would consider acceptable (Reference Fenwick and ByfordFenwick & Byford, 2005).
Missing data were explored in three sensitivity analyses using the following data: (a) hospital cost data collected from clinical records and available for a larger sample of young people than full economic data from the CA–SUS; (b) hospital cost data collected from records plus missing non-hospital cost data imputed using the last value carried forward approach for participants with missing year-2 data; and (c) hospital cost data collected from records plus mean imputation by randomised group of missing non-hospital cost data. The results of all sensitivity analyses are reported in the data supplement to the online version of this paper.
RESULTS
Participants
There were 167 young people entering the trial and they were randomised to in-patient care (n=57), specialist out-patient services (n=55) or treatment as usual by general CAMHS (n=55). Full economic data for the 2-year follow-up period were available for 135 young people (81%), 47 in the in-patient group, 45 in the specialist out-patient group and 43 in the general out-patient group. A comparison of baseline characteristics (site, age, gender, BMI and MRAOS score) revealed no significant differences between those included in the economic evaluation and those who were missing, and there was no difference overall in missing data between the three treatment groups. Length of follow-up varied somewhat (range 99–118 weeks), however there was no significant difference in length of follow-up between the three treatment groups (mean 105 weeks in the in-patient and general out-patient groups and 106 in the specialist out-patient group).
Outcomes
There were no significant differences between the three groups by intention to treat at either 1- or 2-year follow-up on the MRAOS (in-patient 2-year global score 8.3, specialist out-patient 8.4, general out-patient 8.3; P=0.838). Full clinical out-come data are reported by Gowers et al (Reference Gowers, Clark and Roberts2007, this issue).
Resource use
Table 1 details the mean number of contacts young people had with all services over the 2-year follow-up period. Resource use differed little between the groups except for in-patient and out-patient contacts. The general out-patient group spent more time in hospital and had a greater number of out-patient attendances on average than the specialist out-patient or in-patient groups. The specialist out-patient group spent the least amount of time in hospital. Exploration of hospital contacts over time reveals that a larger proportion of days were spent in hospital in the first year (in-patient group 62 days, specialist out-patient 35, general out-patient 65) than the second year (in-patient group 12 days, specialist out-patient 20, general out-patient 24). The in-patient treatment of those allocated to out-patient treatment generally occurred after assigned treatment had ended. Details of adherence to treatment are given in the accompanying paper (Reference Gowers, Clark and RobertsGowers et al, 2007, this issue).
Table 1 Use of resources during the 2-year follow-up period
| Service | In-patient (n=47) | Specialist out-patient (n=45) | General out-patient (n=43) |
|---|---|---|---|
| Mean (s.d.) | |||
| Secondary health services | |||
| In-patient nights | 73 (124) | 55 (114) | 89 (159) |
| Out-patient appointments | 23 (20) | 26 (22) | 31 (24) |
| Day patient contacts | 4 (12) | 1 (7) | 1 (5) |
| Accident and emergency contacts | 0 (1) | 1 (2) | 0 (1) |
| Community health and social services contacts | |||
| General practitioner | 7 (9) | 7 (9) | 6 (8) |
| Practice nurse | 2 (5) | 3 (10) | 1 (4) |
| Dietician | 0 (3) | 0 (0) | 0 (0) |
| District nurse | 0 (0) | 0 (2) | 0 (0) |
| Health visitor | 0 (1) | 0 (0) | 0 (0) |
| Community paediatrician | 0 (1) | 0 (0) | 0 (3) |
| Community psychiatric nurse | 0 (1) | 1 (7) | 1 (5) |
| Clinical psychologist | 1 (8) | 0 (1) | 0 (0) |
| Counsellor | 0 (1) | 0 (2) | 0 (1) |
| Family therapist | 1 (8) | 0 (0) | 0 (2) |
| Dentist | 0 (0) | 0 (1) | 0 (0) |
| School doctor | 0 (2) | 0 (0) | 0 (0) |
| School nurse | 1 (6) | 1 (2) | 1 (2) |
| Social worker | 1 (2) | 1 (4) | 0 (1) |
| Eating disorders association | 0 (1) | 0 (1) | 0 (0) |
| Family therapy | 0 (1) | 0 (1) | 0 (0) |
| Foster care, days | 0 (0) | 0 (0) | 2 (13) |
| Education | |||
| State day school, months | 11 (9) | 10 (9) | 12 (10) |
| Independent day school, months | 1 (4) | 2 (6) | 1 (5) |
| Independent boarding school, months | 0 (1) | 0 (0) | 0 (2) |
| Hospital school, months | 1 (3) | 1 (2) | 2 (4) |
| Home tuition, months | 0 (1) | 1 (3) | 1 (4) |
| School counsellor, contacts | 1 (7) | 1 (7) | 0 (0) |
| Education welfare officer, contacts | 0 (0) | 0 (1) | 0 (1) |
Hospital contacts reported in Table 1 include all specialties. However, the vast majority of contacts were psychiatric (71% of in-patient admissions and 90% of in-patient days) or paediatric (20% of admissions and 10% of in-patient days). Other specialties (9% of admissions and 0.2% of in-patient days) included gastroenterology, general medicine, haematology, intensive care unit, obstetrics, orthopaedics, plastic surgery and urology.
Time in education was similar across the three groups, however on average participants spent a significant proportion of the 2-year follow-up period out of education (approximately 10 out of the 24 months of follow-up).
Costs
Table 2 details the total mean costs per participant over the 2-year follow-up period. There were no statistically significant differences between the three groups. In terms of observed differences, the specialist out-patient group was consistently cheaper than the other two groups and the general out-patient group was the most expensive of the three. The bootstrapped results differed little and are thus not reported here. Hospital costs constitute the greatest proportion of total costs (93% in each group), with few community health and social services being used.
Table 2 Total cost (£) per young person over the 2-year follow-up period
| Sector | In-patient (n=47) | Specialist out-patient (n=45) | General out-patient (n=43) | ANOVA1 P | ||||||
|---|---|---|---|---|---|---|---|---|---|---|
| Mean (s.d.) | Minimum | Maximum | Mean (s.d.) | Minimum | Maximum | Mean (s.d.) | Minimum | Maximum | ||
| Secondary health care | 32 0 15 (51 541) | 69 | 280 580 | 24 724 (46 231) | 103 | 244 043 | 37 746 (62 046) | 68 | 269 236 | 0.456 |
| Primary health care | 380 (640) | 4 | 2773 | 385 (873) | 0 | 4325 | 245 (361) | 0 | 2078 | 0.503 |
| Education | 2098 (2115) | 0 | 8783 | 1595 (1456) | 0 | 6393 | 2654 (2228) | 0 | 12 093 | 0.088 |
| Other community services2 | 37 (110) | 0 | 513 | 35 (104) | 0 | 445 | 150 (806) | 0 | 5244 | 0.504 |
| Total 2-year cost | 34 531 (52 439) | 86 | 282 508 | 26 738 (46 809) | 462 | 244 174 | 40 794 (63 652) | 1483 | 274 838 | 0.426 |
| Total cost per week | 325 (487) | 1 | 2588 | 253 (442) | 4 | 2288 | 386 (600) | 14 | 2603 | 0.423 |
Cost-effectiveness analysis
Using the rules of dominance described in the Method section, specialist out-patient treatment (bootstrapped mean cost per participant £26 797; bootstrapped mean effect 8.35) dominates the in-patient group (£34 371; 8.26) and the general out-patient group (£40 520; 8.26) since it is both cheaper and more effective. Figure 1 illustrates the uncertainty associated with the costs and effects of the three treatments at 2 years and demonstrates that if decision-makers were willing to pay nothing for a unit increase in MRAOS score, there is a 78% chance of specialist out-patient services being the most cost-effective strategy, 16% for in-patient services and only 6% for general CAMHS. The probability of specialist out-patient services being the most cost-effective strategy decreases with increasing levels of willingness to pay for gains in effectiveness, levelling out at around 47%, but remains higher than the other two strategies over the full range of willingness to pay values shown, and beyond.
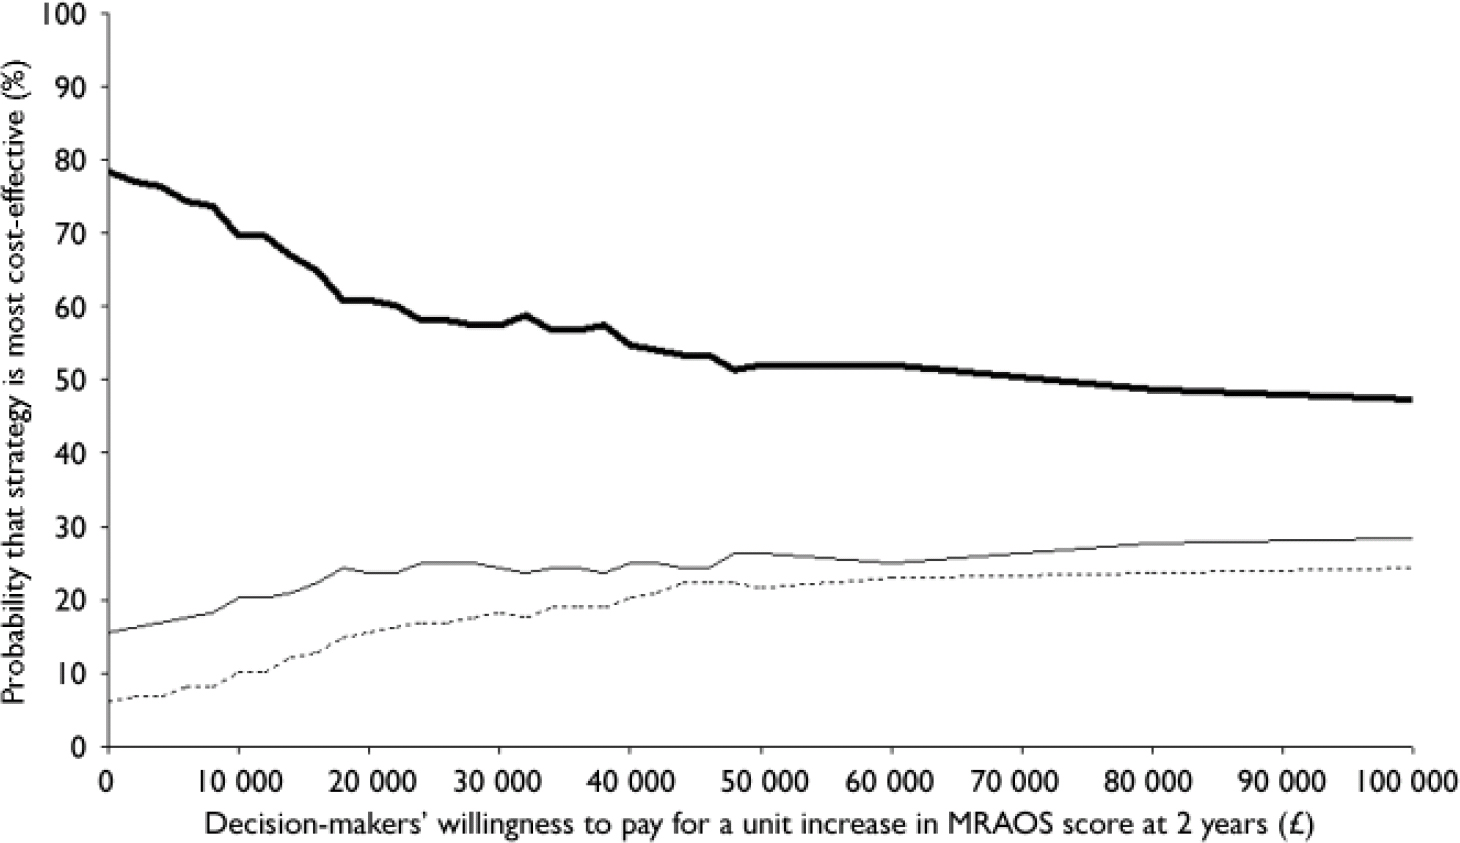
Fig. 1 Cost-effectiveness acceptability curve for Morgan–Russell Average Outcome Scale (MRAOS) score.—, Specialist out-patient;—, in-patient; - - -, general out-patient.
Figure 1 suggests that the probability of our first hypothesis being true is high, i.e. that specialist out-patient services are more cost-effective than general out-patient services. Figure 2 depicts the cost-effectiveness acceptability curve for the second hypothesis, i.e. in-patient v. out-patient services (specialist combined with general), and shows that there is a greater probability of out-patient services being more cost-effective than in-patient services for the full range of values of willingness to pay.
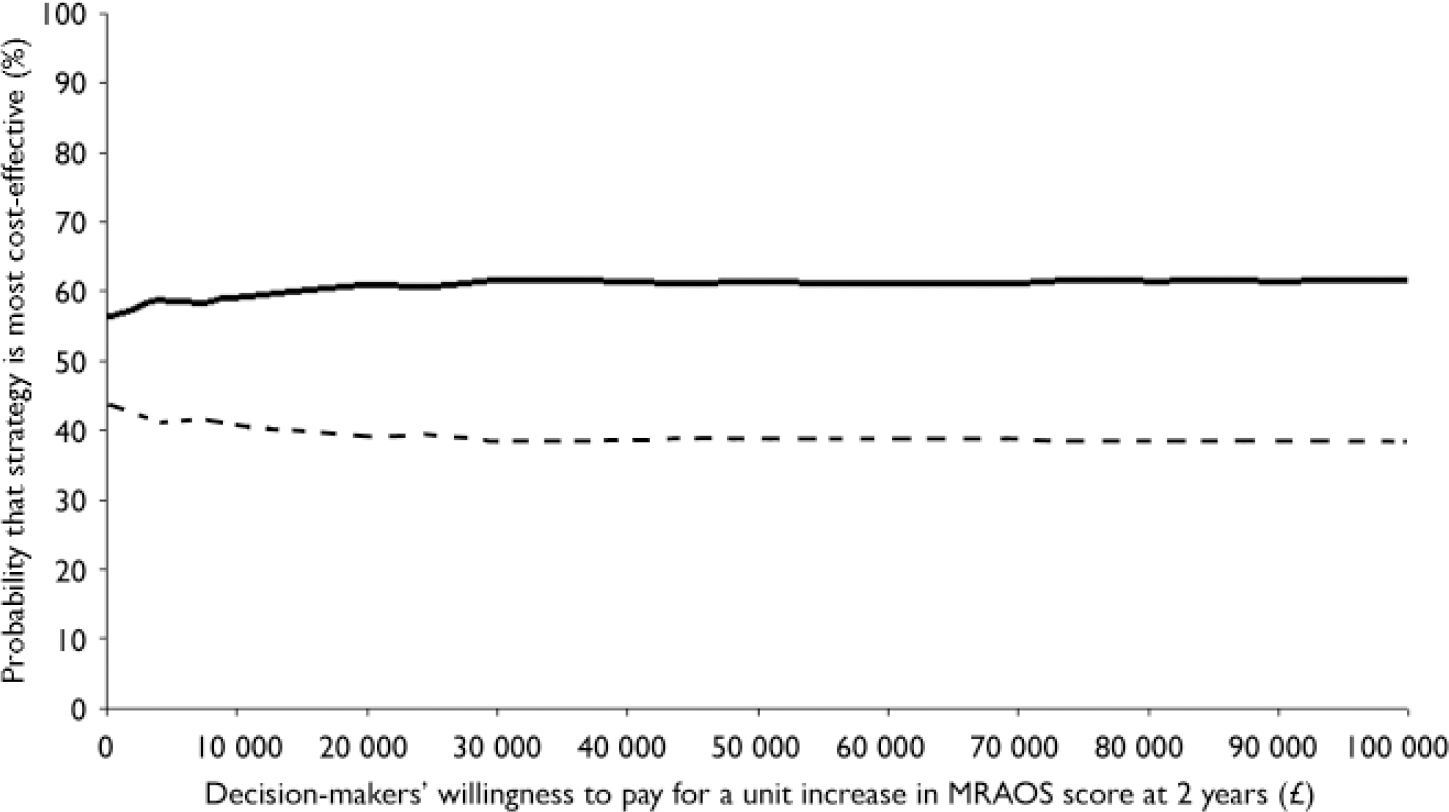
Fig. 2 Cost-effectiveness acceptability curve for Morgan–Russell Average Outcome Scale (MRAOS) score.—, Out-patient; - - -, in-patient.
DISCUSSION
This paper reports the results of the first economic evaluation of alternative strategies for the treatment of anorexia nervosa using primary data collected from a randomised controlled trial.
Clinical outcomes, resource use and cost
There were no statistically significant differences in clinical outcomes between the three groups, with results demonstrating similar improvements in all groups over time. The specialist out-patient group was observed to be the cheapest of the three groups and the general out-patient group the most expensive. However, these differences were not statistically significant. These findings were robust to changes in the discount rate and in analyses of missing data.
Observed differences in total mean cost per participant were almost entirely due to differences in the length of time spent in hospital. Secondary healthcare costs accounted for over 90% of all costs and, of this, almost 90% was due to in-patient stays. The majority of in-patient stays took place in the first year. Although not randomised to psychiatric in-patient services, the general out-patient service group spent almost as much time in hospital as the in-patient group, suggesting that general CAMHS were less successful at maintaining these young people in the community than specialist out-patient services. With the exception of CAMHS, participants used very few community health and social services. Months in education was similar across the groups on average, but high-lighted the significant proportion of time participants spent out of education, presumably as a result of their illness.
At almost £17 000 per year on average, the annual service costs of caring for this group of young people were high. Although much higher than the cost of conditions generally treated in the community, for example conduct disorder with annual service cost estimates varying between £1300 and £3200 (Reference Harrington, Peters and GreenHarrington et al, 2000; Reference Romeo, Knapp and ScottRomeo et al, 2006), this figure is similar to the cost of a cohort of young people treated in child and adolescent psychiatric in-patient wards, estimated to be £24 000 per admission (Reference Green, Jacobs and BeechamGreen et al, 2007). Although slightly higher than the costs reported in this paper, the mean length of stay was longer at 116 days.
Cost-effectiveness
Specialist out-patient services were found to be the dominant treatment option in terms of incremental cost-effectiveness (more effective and less costly). Exploration of the associated uncertainty supported this finding. In terms of our hypotheses, the data suggest that specialist out-patient services have a higher probability of being cost-effective than general out-patient services and that out-patient services (specialist combined with general) have a higher probability of being cost-effective than psychiatric in-patient services.
Limitations
Despite substantial differences in observed cost data, these differences did not reach statistical significance. This may be due to inadequate sample sizes for the economic evaluation. Sample size calculations were based on the primary outcome measure, the MRAOS. Calculations on the basis of cost or cost-effectiveness were not feasible at the design stage because of the lack of any relevant published cost data. Although acknowledging this limitation, the use of a decision-making approach to the economic evaluation provides probabilistic evidence of the cost-effectiveness of the alternative treatment strategies, given the data currently available. Although larger trials may be considered in future research, this must be balanced against the cost of additional research in a disease area where low prevalence rates necessitate multicentre evaluation. Analysis of patients excluded because of missing economic data did not suggest any bias; patients included in the economic evaluation did not differ significantly from those excluded and there was no evidence to suggest any bias in missing data between the three treatment groups.
Acknowledgements
This project is funded by the UK National Health Service Health Technology Assessment programme, Grant No. 97/42/02 and supported by teh North West MHEN. This paper is dedicated to Professor Richard Harrington.


eLetters
No eLetters have been published for this article.