


There is considerable interest in screening instruments that identify children with possible autistic-spectrum disorders for a more in-depth diagnostic assessment. Recently developed screening instruments that have demonstrated promising properties in initial validation studies include the Social Communication Questionnaire (SCQ; sensitivity 0.85; specificity 0.75; Reference Berument, Rutter and LordBerument et al, 1999) and the Social Responsiveness Scale (SRS; 0.85; 0.75; Reference Constantino and GruberConstantino & Gruber, 2005). The Children's Communication Checklist (CCC; Reference BishopBishop, 1998) has a pragmatic composite sub-scale that has been shown to discriminate well between individuals with and without autism (Reference Bishop and BairdBishop & Baird, 2001). For clinicians and researchers a key consideration is which screen is most appropriate to their service or study. In the present study we directly compared the instrument properties of the SCQ, SRS and CCC in identifying individuals with autistic-spectrum disorders in a subsample of the Special Needs and Autism Project (SNAP; Reference Baird, Simonoff and PicklesBaird et al, 2006) cohort of children 9-13 years of age with special educational needs with and without autistic-spectrum disorders.
METHOD
The study was approved by the South East Multicentre Research Ethics Committee (00/01/50). Patients gave informed consent.
Screening instruments
Social Communication Questionnaire
The SCQ (Reference Rutter, Bailey and LordRutter et al, 2003) is a 40-item parent-report questionnaire that asks about characteristic autistic behaviour. Each item is scored 0 or 1, with 1 being the score for endorsement of each symptom of autism. Total scores can range from 0 to 39 (the first item is a language screening question that is not included in the total score). The questionnaire is based on the Autism Diagnostic Interview - Revised (ADI-R; Reference Lord, Rutter and LeCouteurLord et al, 1994) and it has established validity for a diagnosis of autism (Reference Berument, Rutter and LordBerument et al, 1999). Nineteen items rate current behaviour and 20 rate behaviour when the child was 4-5 years old. The recommended cut-off score for autistic-spectrum disorder or pervasive developmental disorder is ⩾15.
Social Responsiveness Scale
The SRS (Reference Constantino and GruberConstantino & Gruber, 2005) is a 65-item rating scale asking about characteristic autistic behaviour over the previous 6 months. Each item is scored from 0 (‘never true’) to 3 (‘almost always true’). Total scores can range from 0 to 195. For the present analysis a cut-off score of ⩾75 was chosen as that which best discriminates children with and without autistic-spectrum disorders (Reference Constantino and GruberConstantino & Gruber, 2005: p. 38). Scores on the SRS discriminate between children with and without autistic-spectrum disorders and are strongly correlated with ADI-R domain scores (r=0.65-0.77; Reference Constantino, Davis and ToddConstantino et al, 2003).
Children's Communication Checklist
Although not developed as a screen for autistic-spectrum disorders, the CCC (Reference BishopBishop, 1998) is a 70-item rating scale that asks about language and communication impairments. Each item is scored 0 (‘does not apply’), 1 (‘applies somewhat’), 2 (‘definitely applies’) or missing value (‘unable to judge’). Items ask about language and communication impairments and about competencies. The CCC is divided into 9 sub-scales: two sub-scales assess aspects of language structure (syntax and speech); two assess aspects of autistic behaviour (social relationships and interests); and five assess aspects of pragmatic communication (inappropriate initiation, coherence, stereotyped conversation, use of context, and rapport). These last five scales can be combined into a pragmatic composite. Bishop (Reference Bishop1998) found that a CCC pragmatic composite score ⩽132 best identified children with pragmatic language impairment. This cutoff also discriminated well between children with and without autism in a clinical sample, but less well between individuals with Asperger syndrome or pervasive developmental disorder, not otherwise specified (PDD-NOS) and those with attention-deficit hyperactivity disorder (ADHD) (Reference Bishop and BairdBishop & Baird, 2001). The present study was started before the publication of the Children's Communication Checklist - Version 2 (CCC-2; Reference BishopBishop, 2003).
SNAP cohort
As part of the larger SNAP study of the prevalence of autistic-spectrum disorders (Reference Baird, Simonoff and PicklesBaird et al, 2006), within a total population cohort of 56 946 children born between 1 July 1990 and 31 December 1991 all those with a current clinical diagnosis of pervasive developmental disorder (n=255) or considered at risk of having the undetected disorder by virtue of having a statement of special educational needs (n=1515) were screened using the SCQ. (In the UK a statement of special educational needs is a legal document issued by a local educational authority when children require significant additional support in school because they have learning and/or behavioural problems.) A total of 1066 SCQs were returned completed (return rate 60.2%); 31 families declined further participation, leaving 1035 (return rate 58.5%) who returned the SCQ and opted in for further assessments. Mean age at SCQ screening in the whole SNAP sample was 10.3 years (s.d.=0.4 years). We have previously reported on the screening properties of the SCQ in the total sample, finding similar discrimination between individuals with autistic-spectrum disorders and those without as in the original validation sample (sensitivity 0.88; specificity 0.72; Reference Chandler, Charman and BairdChandler et al, 2007).
A stratified subsample (by coincidence, also n=255) received a comprehensive diagnostic assessment, including standardised clinical observation (the Autism Diagnostic Observation Schedule - Generic (ADOS-G; Reference Lord, Risi and LambrechtLord et al, 2000)), parent-interview assessments of autistic symptoms (ADI-R; Reference Lord, Rutter and LeCouteurLord, et al, 1994), language and IQ tests, evaluation of psychiatric comorbidities and a medical examination. The team used ICD-10 research diagnostic criteria (World Health Organization, 1993) to derive a clinical consensus diagnosis of childhood autism, other autistic-spectrum disorders or no autistic-spectrum disorder (for details see Reference Baird, Simonoff and PicklesBaird et al, 2006). For 36 randomly selected children, project consensus diagnoses were compared with diagnoses by eight internationally recognised experts using ICD-10 criteria (two experts independently rated the ADI-R, ADOS-G, psychometric findings and a clinical vignette for each case). Agreement between the project consensus and expert diagnoses was 93% with (weighted) κ= 0.77 (for details see Reference Baird, Simonoff and PicklesBaird et al, 2006: Fig. 1).
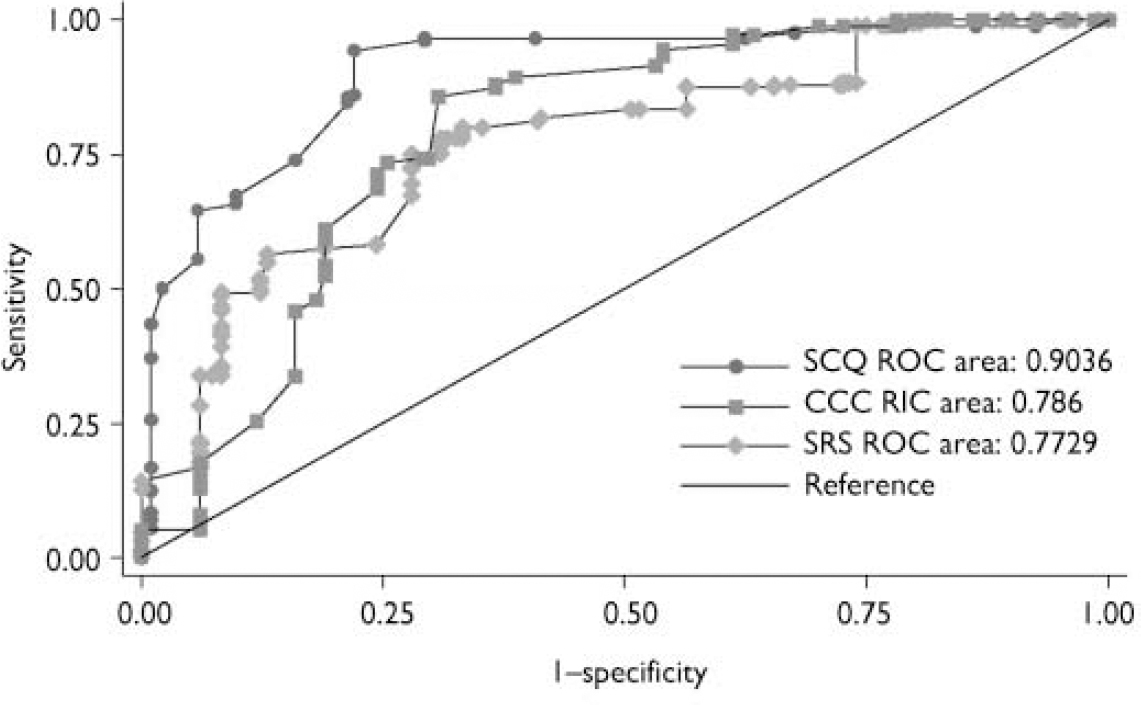
Fig. 1 Receiver operating characteristic (ROC) curves for the Social Communication Questionnaire (SCQ), Social Responsiveness Scale (SRS) and Children's Communication Checklist (CCC).
We collated the following data for our subsample of 119 children: IQ; severity of symptoms of autism, measured by ADI-R and ADOS-G algorithm total scores; a total count of ICD-10 symptoms (0-12), systematically completed as part of the diagnostic review process of every case; parent and teacher reports of emotional and behavioural problems; and adaptive behaviour, assessed using the Vineland Adaptive Behavior Scales (VABS; Reference Sparrow, Balla and CichettiSparrow et al, 1984). The children's (n=118) IQ was measured using the Wechsler Intelligence Scale for Children (WISC-III-UK; Reference WechslerWechsler, 1992). The (weighted) mean full-scale IQ of the sample was 73.4 (s.e.=1.6) and the range was 40-136; 56% (weighted) of the children had an IQ<70. One child could not complete the WISC-III-UK and their IQ was derived using Raven's Standard Progressive Matrices (Reference Raven, Court and RavenRaven et al, 1990).
Parents of a subsample of children (n=119) completed both the SRS and the CCC in addition to the SCQ. This afforded us the opportunity to directly compare the instrument properties of the three screens in the same sample.
Parents and teachers of these 119 children also completed the Strengths and Difficulties Questionnaire (SDQ; Goodman, Reference Goodman1997, Reference Goodman2001). Each sub-scale has five questions that are rated ‘not true’, ‘somewhat true’ and ‘certainly true’ and score 0-2, with higher scores indicating greater pathology. Four sub-scales (emotional problems, peer problems, conduct problems and hyperactivity) are summed to create a total problem score (range 0-40). We considered children whose teacher-rated (⩾16) and/or parent-rated (⩾17) total problem score fell around the 10% percentile in UK norms for SDQ scores (Reference Meltzer, Gatward and GoodmanMeltzer et al, 2000) to have a high rate of behaviour problems.
Order of completion of assessments
In the larger study (Reference Baird, Simonoff and PicklesBaird et al, 2006) the SCQ was used as the initial screening instrument to identify cases for in-depth diagnostic assessment; therefore the SCQ was completed for all children before the diagnostic assessments. For our subsample of 119 children with data on all three screening instruments the mean age at SCQ screening was 10.2 years (s.e.=0.4 years; range 9.5-11). The CCC was completed by parents immediately before the diagnostic assessment (mean age of children=12.0 years (s.e.=0.1 years; range 9.8-13.9). The SRS was completed at a mean age of 12.6 years (s.e.=0.4 years; range 11.8-13.2): for 50 children this was in advance of, and for 69 this was following, the diagnostic assessment and completion of the CCC. Scores on the three screening instruments were not consulted during the consensus clinical diagnostic process (for details see Reference Baird, Simonoff and PicklesBaird et al, 2006). The 119 children in our subsample differed from the remainder of the cohort (n=136) in terms of IQ (mean=78.5 (s.e.=1.8) v. 67.4 (s.e.=2.2); ANOVA F(1,251)=15.0, P<0.001) but not symptom severity or parental education.
Statistical analysis
Stratification of the sample with autistic-spectrum disorders and special educational needs was based on whether or not a child had a locally recorded autistic-spectrum disorder diagnosis (yes/no) and one of four levels of SCQ score (low: <8; moderately low: 8-14; moderately high: 15-21; high: >22; for details see Reference Baird, Simonoff and PicklesBaird et al, 2006: Fig. 1). Weighting allowed all statistics such as means, group differences and screen performance measures to be presented as target population estimates, taking account not only of the differences in sampling proportions according to SCQ score and local diagnosis of autistic-spectrum disorder, but also the differential response to the SCQ associated with a prior local autistic-spectrum disorder diagnosis, health district and child's gender. Wald test statistics (adjusted t- and F-tests) and P-values were calculated using the linearisation version of the robust parameter covariance matrix as implemented by the svy procedures of Stata 9 (Stata, 2005). A receiver-operator-characteristic (ROC) area-under-the-curve (AUC) analysis was performed to assess and compare the discriminant power of the screening instruments in distinguishing children with autistic-spectrum disorders (including autism) from those without (Reference Hanley and McNeilHanley & McNeil, 1982; Reference DunnDunn, 2000). Application of the weights ensured that this comparison was fair despite the SCQ-stratified sample design. Confidence intervals for weighted AUC estimates and tests were obtained using the bootstrap resampling ROC procedures of Stata 9, reverse coded in the case of the CCC.
RESULTS
Thirty-three children received a clinical consensus diagnosis of childhood autism; 37 a clinical consensus diagnosis of other autistic-spectrum disorders (other-ASD); and 49 children did not meet clinical consensus diagnosis for autism or other autistic-spectrum disorders (non-ASD). Of the 37 children in the other-ASD group: 2 met ICD-10 criteria for atypical autism because of late onset; 2 met ICD-10 criteria for atypical autism because of an insufficient number of areas of abnormality; 29 met ICD-10 criteria for other pervasive developmental disorders because of subthreshold symptomatology; 3 met ICD-10 criteria for ‘pervasive developmental disorder, unspecified’ because of lack of information (incomplete assessment, adopted children for whom early history was not available); and 1 met ICD-10 criteria for overactive disorder associated with mental retardation and stereotyped movements. Diagnoses for the 49 children in the non-ASD group included intellectual disability (DSM-IV-TR ‘mental retardation’; American Psychiatric Association, 2000) and learning difficulties (n=27), language delay/disorder (n=7), hyperkinetic and/or conduct disorder (n=6) and a variety of other medical, sensory and developmental diagnoses (n=9).
Table 1 shows the weighted mean scores of the sample on the three screens by consensus diagnostic group. As would be expected, individuals in the childhood autism group scored higher than those in the other-ASD and non-ASD groups on the SCQ and SRS and lower on the (reverse-scored) CCC pragmatic composite. Similarly, the children in the other-ASD group scored higher than those in the non-ASD group on the SCQ and SRS and lower on the CCC pragmatic composite. For the SCQ all three group-by-group comparisons were significant (other-ASD v. non-ASD: F(1,118)=39.8, P<0.001; childhood autism v. non-ASD: F(1,118)=186.4, P<0.001; childhood autism v. other-ASD: F(1,118)=28.2, P<0.001). For the SRS and CCC all three comparisons reached significance, except for the childhood autism v. other-ASD comparison on the SRS (SRS: other-ASD v. non-ASD: F(1,118)=6.2, P<0.05; childhood autism v. non-ASD: F(1,118)=38.7, P<0.001; childhood autism v. other-ASD: F(1,118)=2.7, P=0.10; CCC: other-ASD v. non-ASD: F(1,118)=13.2, P<0.001; childhood autism v. non-ASD: F(1,118)=29.5, P<0.001; childhood autism v. other-ASD: F(1,118)=5.3, P<0.05).
Table 1 Scores on the three screening instruments by diagnostic group
| Non-ASD (n=49) Mean (s.e.) | Other-ASD (n=37) Mean (s.e.) | Childhood autism (n=33) Mean (s.e.) | |
|---|---|---|---|
| SCQ | 9.5 (1.1) | 19.2 (1.1) | 25.8 (0.5) |
| SRS | 68.0 (6.2) | 97.8 (10.2) | 116.1 (4.6) |
| CCC | 131.9 (2.7) | 120.3 (1.8) | 114.5 (1.8) |
ASD, autistic-spectrum disorder; CCC, Children's Communication Checklist; SCQ, Social Communication Questionnaire; SRS, Social Responsiveness Scale
Total scores on the three screening instruments were highly and significantly correlated (weighted correlation coefficients SCQ-SRS=0.68; SCQ-CCC=–0.66; SRS-CCC=–0.75, all P<0.001). Table 2 shows the correlations between total scores on the three screening instruments and scores on the eight other diagnostic assessment measures. All three screening instruments were more highly correlated with the ADI-R total score and ICD-10 symptom count than with the ADOS-G total score. The SCQ and SRS scores were unrelated to IQ, and scores on the CCC were only weakly related, with lower IQ being associated with poor pragmatic ability (r=0.20, P<0.05). All three screening instruments were unrelated to language ability as measured by the British Picture Vocabulary Scale (BPVS; Dunn et al, 1987). Scores on all three screens were also significantly associated with the adaptive behaviour composite of the VABS and with parent-completed, but less so with teacher-completed SDQs.
Table 2 Correlations between total scores on the three screens and scores on other diagnostic assessment measures
| Measure | SCQ | SRS | CCC |
|---|---|---|---|
| ADI–R (n=117) | 0.83 *** | 0.59 *** | –0.58 *** |
| ADOS–G (n=119) | 0.45 *** | 0.48 *** | –0.36 *** |
| ICD–10 symptom count (n=119) | 0.72 *** | 0.59 *** | –0.55 *** |
| IQ (n=118) | 0.01 | –0.09 | 0.20* |
| BPVS (n=118) | 0.12 | 0.09 | 0.06 |
| VABS (n=103) | –0.38 *** | –0.44 *** | 0.43 *** |
| Parent SDQ (n=119) | 0.57 *** | 0.73 *** | –0.67 *** |
| Teacher SDQ (n=108) | 0.34 *** | 0.36 *** | –0.47 *** |
BPVS, British Picture Vocabulary Scale; CCC, Children's Communication Checklist; SCQ, Social Communication Questionnaire; SDQ, Strengths and Difficulties Questionnaire; SRS, Social Responsiveness Scale; VABS, Vineland Adaptive Behavior Scales
** P < 0.05
*** P < 0.001
The AUC, sensitivity, specificity, positive and negative predictive values of the three screening instruments in predicting ASD versus non-ASD status are shown in Table 3 and the ROC curves are shown in Fig. 1. The SCQ had a higher AUC (0.90) than the SRS (0.77; P=0.05) and the CCC (0.79, P=0.05), reflecting both its high sensitivity (0.86) and specificity (0.78). The AUC of the SRS and CCC did not differ from one another (P=0.84). The SRS had high sensitivity (0.78) but only moderate specificity (0.67); whereas the CCC had a high sensitivity but a low specificity (0.93 and 0.46 respectively).
Table 3 Properties (weighted values) of the three screening instruments
| SCQ ASD cut-off ⩾ 15 | SRS ASD cut-off ⩾ 75 | CCC PC cut-off ⩽ 132 | |
|---|---|---|---|
| Whole sample (n=119) | |||
| AUC (95% CI) | 0.90 (0.81–0.96) | 0.77 (0.61–0.90) | 0.79 (0.64–0.91) |
| Sensitivity (95% CI) | 0.86 (0.65–0.96) | 0.78 (0.57–0.92) | 0.93 (0.87–0.97) |
| Specificity (95% CI) | 0.78 (0.60–0.93) | 0.67 (0.46–0.84) | 0.46 (0.28–0.68) |
| PPV (95% CI) | 0.74 (0.56–0.92) | 0.63 (0.46–0.82) | 0.56 (0.41–0.75) |
| NPV (95% CI) | 0.88 (0.72–0.97) | 0.81 (0.61–0.94) | 0.90 (0.81–0.96) |
| Low IQ (n=44) | |||
| AUC (95% CI) | 0.92 (0.74–0.99) | 0.67 (0.38–0.93) | 0.72 (0.47–0.92) |
| Sensitivity (95% CI) | 0.97 (0.88–1.00) | 0.78 (0.46–1.00) | 0.99 (0.96–1.00) |
| Specificity (95% CI) | 0.73 (0.42–0.99) | 0.57 (0.29–0.84) | 0.41 (0.14–0.70) |
| PPV (95% CI) | 0.68 (0.38–0.98) | 0.52 (0.29–0.78) | 0.50 (0.27–0.75) |
| NPV (95% CI) | 0.98 (0.89–1.00) | 0.81 (0.44–1.00) | 0.99 (0.91–1.0) |
| High IQ (n=75) | |||
| AUC (95% CI) | 0.90 (0.77–0.97) | 0.87 (0.73–0.95) | 0.88 (0.73–0.97) |
| Sensitivity (95% CI) | 0.77 (0.51–0.94) | 0.78 (0.61–0.91) | 0.88 (0.76–0.96) |
| Specificity (95% CI) | 0.85 (0.60–0.98) | 0.80 (0.58–0.94) | 0.53 (0.30–0.86) |
| PPV (95% CI) | 0.83 (0.58–0.97) | 0.78 (0.53–0.94) | 0.63 (0.42–0.89) |
| NPV (95% CI) | 0.80 (0.57–0.96) | 0.80 (0.60–0.91) | 0.83 (0.68–0.94) |
| Low SDQ (n=33) | |||
| AUC (95% CI) | 1.0 (0.99–1.00) | 0.77 (0.42–0.94) | 0.86 (0.67–0.98) |
| Sensitivity (95% CI) | 0.87 (0.54–1.00) | 0.57 (0.15–0.93) | 0.94 (0.70–1.00) |
| Specificity (95% CI) | 0.99 (0.96–1.00) | 0.93 (0.76–1.00) | 0.60 (0.34–0.90) |
| PPV (95% CI) | 0.91 (0.61–1.00) | 0.47 (0.00–1.00) | 0.21 (0.05–0.57) |
| NPV (95% CI) | 0.99 (0.95–1.00) | 0.95 (0.87–0.99) | 0.99 (0.95–1.0) |
| High SDQ (n=77) | |||
| AUC (95% CI) | 0.83 (0.66–0.92) | 0.67 (0.44–0.87) | 0.66 (0.42–0.87) |
| Sensitivity (95% CI) | 0.86 (0.66–0.97) | 0.80 (0.55–0.95) | 0.95 (0.89–0.99) |
| Specificity (95% CI) | 0.57 (0.29–0.87) | 0.41 (0.15–0.71) | 0.30 (0.09–0.66) |
| PPV (95% CI) | 0.73 (0.52–0.91) | 0.64 (0.43–0.82) | 0.64 (0.45–0.83) |
| NPV (95% CI) | 0.76 (0.37–0.95) | 0.61 (0.24–0.93) | 0.81 (0.52–0.95) |
ASD, autistic spectrum disorder; AUC, area under the curve; CCC PC, Children's Communication Checklist, pragmatic composite; NPV, negative predictive value; PPV, positive predictive value; SCQ, Social Communication Questionnaire; SDQ, Strengths and Difficulties Questionnaire; SRS, Social Responsiveness Scale
To examine whether the three screens performed differently in subsamples of children (children with low (<70) v. high (⩾70) IQ; children with v. without parent- and/or teacher-rated borderline behavioural problems on the SDQ), AUC analyses were repeated for these subgroups. Note that these analyses should be treated with caution, as the confidence intervals for some of the parameters are wide, reflecting smaller subsamples. However, although the SCQ and CCC performed similarly in the subsample with low IQ as they did for the whole sample, the SRS had a lower AUC (0.67), reflecting its lower specificity (0.57). In the subsample with high IQ the AUC was similar for all three screens (SCQ=0.90; SRS=0.87; CCC=0.88). All three instruments showed lowered specificity in the subsample with elevated behavioural problems (SCQ=0.57; SRS=0.41; CCC=0.30).
DISCUSSION
Summary of the screening properties
The performance of the SCQ was similar to the that in initial validation study (sensitivity=0.85; specificity=0.75; Reference Berument, Rutter and LordBerument et al, 1999; Reference Rutter, Bailey and LordRutter et al, 2003) and somewhat better than in several more recent studies that have included younger children and have reported reduced sensitivity (0.71: Reference Eaves, Wingert and HoEaves et al, 2006a ; 0.71: Reference Corsello, Hus and PicklesCorsello et al, 2007; 0.67: Reference Lee, David and RusyniakLee et al, 2007) or reduced specificity (0.71: Reference Eaves, Wingert and HoEaves et al, 2006b ; 0.58: Reference Allen, Silove and WilliamsAllen et al, 2007; 0.54: Reference Corsello, Hus and PicklesCorsello et al, 2007). The present study included only a restricted age range but in a large sample Corsello et al (Reference Corsello, Hus and Pickles2007: Table 3) found that the sensitivity of the SCQ increased with age, perhaps reflecting the emergence of the full range of autistic symptoms over time. This is supported by comparison of the mean SCQ scores for children with a diagnosis of childhood autism in the present (25.8) and previous studies. Although our figure is very similar to the 25.2 obtained in the Berument et al (Reference Berument, Rutter and Lord1999) study it is higher than the 20.3 obtained in the Corsello et al (Reference Corsello, Hus and Pickles2007) study, which included children 2-16 years and also the 19.2 of the Eaves et al (Reference Eaves, Wingert and Ho2006b ) study, which included children aged 2-6 years.
The SRS had a lower sensitivity in our sample than in the original validation study (0.85; Reference Constantino and GruberConstantino & Gruber, 2005) and both the SRS and CCC had reduced specificity (0.57 and 0.41 respectively) in our subsample with low IQ. The increased specificity of the SCQ compared with that of the SRS and CCC might be due to its fuller coverage of the third autism symptom domain of restricted and repetitive behaviours and interests. All three screens showed high discrimination between children with IQ⩾70 in the ASD and non-ASD groups with AUC values between 0.87 and 0.90. The CCC had a high sensitivity but low specificity, reflecting its broader cut-off for ‘pragmatic impairment’, rather than autistic-spectrum disorder itself. For some purposes, for example screening out individuals who might have autistic-spectrum disorder when characterising a non-ASD comparison group in a research study, high sensitivity is prioritised and lower specificity does not bring costs, and on the basis of the present data the CCC could be used for such a purpose. Geurts et al (Reference Geurts, Verté and Oosterlaan2004) found that the CCC discriminated well between children with autism, children with ADHD and typical controls (discriminant function classification 78% in Study 1; 77% in Study 2).
All three screening instruments had lower specificity in the subsample with elevated levels of behavioural problems as measured by the SDQ. It is likely that in response to questions on the instruments that are meant to measure symptoms of autism, some parents are endorsing items that reflect aspects of their child's emotional, hyperactivity or conduct difficulties. One previous study has reported high scores on the SCQ for children with mood and anxiety disorders in whom a clinical diagnosis of pervasive developmental disorder had been excluded (Reference Towbin, Pradella and GorrindoTowbin et al, 2005), although such disorders are unlikely to be common in our sample as they usually do not form a reason for special educational needs registration. In the Towbin et al study significantly more children fell above the autistic-spectrum disorder cutoff on the SRS and the Social Interaction Deviance Composite on the CCC-2 than above the cut-off for the disorder on the SCQ (Reference Towbin, Pradella and GorrindoTowbin et al, 2005: Fig. 1, p. 458).
In addition to the prevalence of autistic-spectrum disorders in any particular clinical setting or research study, the characteristics (e.g. clinical diagnosis, IQ, age) of those with and without the disorder, family factors (e.g. parental education, parental knowledge about autism) and methodological factors, including whether the screen was completed before or after diagnostic assessment, will also affect how a screening instrument performs. Another factor that affects an instrument's performance in relation to a clinical diagnosis of autistic-spectrum disorder is the time period of the behaviour sampled and the three instruments used in this study differed in this respect. Whereas the CCC and SRS ask parents to rate current behaviour (for the SRS over the previous 6 months; unspecified for the CCC), about half of the items on the SCQ ask about behaviour in the 4- to 5-year period when symptoms of autism may be at their most prototypical. One further consideration that our study cannot address is whether screening instruments perform differently in different countries owing to cultural interpretation of the behaviours enquired about.
Example scenarios comparing use of the three screens
The meaning of statistics such as the AUC can be hard to translate into everyday examples to guide clinicians and researchers. To illustrate the potential impact of the different screen parameters on a hypothetical research study or clinical service we will outline two scenarios that summarise the consequences of choice of screening instrument. In both scenarios assume that among 250 children to be screened, 100 are ‘true cases’ of autistic-spectrum disorders and 150 are ‘true non-cases’. Using estimates from the present analysis this translates into: the number of the 100 ‘true cases’ that are screen positive (true positives) (SCQ=86; SRS=78; CCC pragmatic composite=93); the number of the 100 ‘true cases’ that are screen negative (false negatives) (SCQ=14; SRS=22; CCC pragmatic composite=7); the number of the 150 true non-cases that are screen negative (true negatives) (SCQ=117; SRS=100.5; CCC pragmatic composite=69); and the number of the 150 true non-cases that are screen positive (false positives) (SCQ=33; SRS=49.5; CCC pragmatic composite=81). The relative importance of these figures depends on the purpose of using the screening instrument in a particular study/service.
In the first scenario, consider that the instruments is being used to estimate, for purely administrative reasons, the number of children within a special school system who have an autistic-spectrum disorder. That is, there is no consequence or cost (such as a follow-up assessment) attached to being screen positive. In this scenario, the estimated prevalence of autistic-spectrum disorder will vary by a factor of ∼50%, depending on whether one is using the SCQ (119 screen positives, i.e. children with autistic-spectrum disorders identified), the SRS (127.5 identified) or the CCC pragmatic composite (173 identified), with the latter clearly overestimating the ‘true’ prevalence.
In a second scenario, consider a clinical service screening speech and language therapy referrals to identify children who should be ‘fast tracked’ into an expensive (and for parents sometimes anxiety provoking) multidisciplinary assessment. For this aim, high sensitivity is required for the screening procedure to be clinically useful. To maximise case-finding efficiency one could consider the proportion of cases correctly identified by the screen compared with cases missed by it (SCQ=6.14; SRS=3.55; CCC pragmatic composite=13.3). However, one would also want to minimise false positives in order not to use expensive assessment resource on children who do not have autistic-spectrum disorders and to avoid provoking unnecessary anxiety in parents. Here the most relevant figure is the number of false positives (SCQ=33; SRS=49.5; CCC pragmatic composite=81). In this scenario the SRS was least efficient in terms of case-finding and the CCC least cost-effective, with the SCQ performing best. Other scenarios would produce different outcomes, and the choice of which screen to use and which criterion to adopt could depend on the relative costs of false positives and false negatives - although these costs fall on different parties (false positives tend to cost services, whereas false negatives tend to cost the child and parent). Clinicians and researchers need to estimate as best they can the implications for their service/study of which screen they use for any particular purpose.
Strengths and limitations
The strengths of our study include: testing the ability of different screening instruments to identify children with autistic-spectrum disorders in the same sample; the generalisability of the findings, owing to the population-weighting procedure; the calculation of confidence intervals around the instrument parameter estimates; and the inclusion of both low- and high-IQ children. The comprehensive diagnostic assessment and use of a clinical consensus decision-making process that was corroborated by independent expert rating (see Reference Baird, Simonoff and PicklesBaird et al, 2006) are also strengths. Furthermore, the screens were able to differentiate those with autistic-spectrum disorders from those without such disorders but with intellectual disability and language delay despite the considerable degree of symptom overlap between these conditions, especially in the area of impairments in communication.
One limitation of the study is that the age of the at-risk sample at the time of screening (9-13 years) is older than would be required for first-level screening of young children, although it is still an age at which many children are referred for possible autistic-spectrum disorders, in particular to child and adolescent mental health services (Reference Skuse, Mandy and ScourfieldSkuse et al, 2005). Second, the SCQ was derived from items on the ADI-R and information from the ADI-R was part of the information used to achieve a clinical consensus diagnosis. This might explain, in part, the higher prediction of the SCQ compared with the SRS and CCC that we found. Another limitation is the relatively modest sample size, in particular when the subsamples with high/low IQ and high/low levels of behavioural problems were examined, leading to relatively wide confidence intervals. However, the sample size compares well with the majority of published data available on the SCQ, SRS and CCC.
Clinical implications
A score on a screening instrument is not a diagnosis. For diagnostic assessment a full parental interview regarding current and past development and behaviour, and structured observation of the child, preferably including a peer-group setting, is essential. Corsello et al (Reference Corsello, Hus and Pickles2007) found that the addition of information from the ADOS-G to information from the SCQ significantly improved specificity to detect autistic-spectrum disorders. For some clinical and research purposes they suggest that a multistage assessment beginning with the SCQ, followed by the ADOS-G and then including information from the time-intensive ADI-R assessment might be appropriate. Our study demonstrates that for some clinical and research purposes the SCQ, and to a lesser extent the SRS and CCC, can all be efficient first-level screening instruments for identifying children with possible autistic-spectrum disorder for a more in-depth assessment. Child characteristics such as IQ and behavioural problems affect performance of the screens, and this, in addition to considerations regarding the consequences/costs of a screen-positive or negative result, should be borne in mind when choosing which screen to use for any particular clinical or research purpose.
Acknowledgements
We are grateful to the children and families who participated in the study and to the clinical teams in South Thames, whose collaboration made the study possible. We thank the expert group, Patrick Bolton, Antony Cox, Anne Gilchrist, Rebecca Landa, Ann Le Couteur, Catherine Lord, Lennart Pedersen and Michael Rutter. Thanks also to Iris Carcani-Rathwell, Greg Pasco, Samantha Ross, Emma Rowley, Vicky Slonims and Martha Turner for their help with assessments, and to Dorothy Bishop for comments on an earlier version of this manuscript.


eLetters
No eLetters have been published for this article.