


There is a growing focus on disconnectivity as a model for schizophrenia, Reference Stephan, Baldeweg and Friston1,Reference Friston2 following the evidence of functional disconnectivity from functional neuroimaging. This has led to a renewed interest in white matter, and in white matter imaging in particular. The results of volumetric magnetic resonance imaging (MRI) studies of white matter in schizophrenia have been inconclusive, however. Whereas grey matter analyses have shown robust changes and a clear relationship with disease progression, Reference Velakoulis, Wood, Wong, McGorry, Yung and Phillips3 the extent of white matter changes and their relation to illness duration or the effects of medication remain in doubt. Reference Walterfang, Wood, Velakoulis and Pantelis4
Diffusion tensor imaging (DTI) offers a method of examining white matter microstructure in vivo. Reference Basser, Mattiello and LeBihan5 It has proved effective in detecting subtle white matter pathology and is a promising method of investigating anatomical connectivity in schizophrenia. Reference Kanaan, Kim, Kaufmann, Pearlson, Barker and McGuire6 There have been a number of DTI studies in schizophrenia in recent years, but the results so far have been inconsistent with respect to both the location and extent of white matter abnormalities. This may reflect both a lack of power to detect differences, which seem to be small and highly variable, Reference Kanaan, Shergill, Barker, Catani, Ng and Howard7 and methodological differences. Region of interest studies have selected different foci of investigation but have often been small. Voxel-based approaches permit assessment of the entire white matter, but the studies in schizophrenia to date have used a variety of different acquisition and analysis protocols. Reference Kanaan, Kim, Kaufmann, Pearlson, Barker and McGuire6
The first goal of our study was to use DTI to assess the microstructure of white matter in schizophrenia, as far as possible overcoming the methodological difficulties that may have limited previous DTI studies of this disorder. We therefore studied a large sample of patients and a carefully matched control group using a sophisticated acquisition sequence, optimised for the study of white matter, Reference Jones, Williams, Gasston, Horsfield, Simmons and Howard8 and a voxel-based method of analysis specifically developed for DTI data. Our main hypothesis was that with greater statistical power, and by examining all implicated tracts, we would reconcile the apparently inconsistent findings in the literature by revealing widespread abnormalities in schizophrenic white matter. We further predicted that our greater statistical power would reveal small negative relationships between illness duration, medication and white matter microstructure.
Method
Seventy-six patients meeting DSM–IV criteria for schizophrenia 9 were recruited from the wards and out-patient clinics of the South London and Maudsley Hospital National Health Service (NHS) Trust and by national referral. Diagnoses were established by an experienced psychiatrist, using semi-structured interviews and detailed case-note review. Patients who were assessed within the first few months of their illness had the 6-month duration criterion confirmed at subsequent follow-up. The median duration of illness (defined as time from first contact with services) for all patients at assessment was 4.5 years (range 3 months to 35 years) and their median age was 27 years (range 18–60). All but 11 patients were receiving antipsychotic medication at the time of scanning. Seventy-six healthy volunteers were then selected from a sample of over 200 controls, to match the patient group for age, gender, handedness and premorbid IQ using the National Adult Reading Test. Reference Russell, Munro, Jones, Hayward, Hemsley and Murray10 Control group volunteers were excluded if they had a personal history of mental illness or a family history of psychotic illness, and both patients and controls were excluded if there was a lifetime history of head injury with loss of consciousness, neurological illness or current drug or alcohol dependence. To examine the effects of antipsychotic medication on DTI data, a subgroup of 15 patients who had been treated with medication for less than 1 month (median 3 days, range 0–25) were matched for age, gender, IQ and handedness with another subgroup of 30 patients who had been treated for more than 1 year (median 3 years, range 1–13), selected without reference to their DTI results. Our sample was powered by the subgroup analysis to give 80% power to detect changes of the order described in the most recent large study for which suitable data were available. Reference Kuroki, Kubicki, Nestor, Salisbury, Park and Levitt11 The power to detect changes of that order in the principal analysis was correspondingly over 99%.
The study was approved by the appropriate NHS research ethics committee, and all participants gave written informed consent before taking part.
Diffusion tensor data acquisition
Data were acquired using a 1.5 T GE Signa LX system (General Electric, Milwaukee, USA) with actively shielded magnetic field gradients (maximum amplitude 40 mT/m). A standard quadrature birdcage head coil was used for both radiofrequency transmission and signal reception. Each volume was acquired using a multislice, peripherally gated echoplanar imaging sequence, optimised for precise measurement of the diffusion tensor in parenchyma from healthy volunteer data, Reference Jones, Williams, Gasston, Horsfield, Simmons and Howard8 over 60 contiguous 2.5 mm thick near-axial slice locations. Data were acquired with a 96×96 matrix over a 24 cm×24 mm field of view, yielding isotropic (2.5 mm× 2.5 mm×2.5 mm) voxels, although during reconstruction the data were zero-filled to 128×128, giving an apparent in-plane voxel size of 1.875 mm×1.875 mm. The echo time was 107 ms and the repetition time was 15 R-R intervals. The duration of the diffusion encoding gradients (δ) was 17.3 ms, giving a maximum diffusion weighting of 1300 s/mm2. At each slice location, seven images were acquired with no diffusion gradient applied, together with diffusion-weighted images in 64 gradient directions uniformly distributed in space (see Jones et al for further details). Reference Jones, Williams, Gasston, Horsfield, Simmons and Howard8
Data processing
The diffusion-weighted images were first corrected for eddy current distortion using a mutual information-based registration scheme, and then masked using locally written software plus the Brain Extraction Tool (BET) in the Functional Software Library package (Oxford Centre for Functional Magnetic Resonance Imaging of the Brain, Oxford University, UK). The diffusion tensor was then calculated at each voxel using multivariate linear regression after logarithmic transformation of the signal intensities. Reference Basser, Mattiello and LeBihan5 Fractional anisotropy (an index of white matter microstructural organisation) was calculated at each voxel to produce a multislice fractional anisotropy image. Normalisation (i.e. transformation of the scans into a standard space to allow inter-individual comparison) used a two-stage process. In the first step, a study-specific template was created and the fractional anisotropy images were then registered to this as follows: the mean b=0 (non-diffusion-weighted) image from every participant was registered using SPM2 (Wellcome Department of Imaging Neuroscience, London, UK) to the SPM2 echoplanar imaging template. The derived mapping parameters for each participant were then applied to that person's (inherently co-registered) fractional anisotropy image. These normalised images were themselves averaged and smoothed with an 8 mm Gaussian kernel to create a study-specific template. The second stage involved a new registration, as the original fractional anisotropy images were then registered to this template, again using SPM2. The registered images were also segmented, using the default tissue probability information (‘priors’) in SPM2, and these probabilistic maps thresholded at 10% probability to generate a liberal white/rest-of-brain mask. The fractional anisotropy images were smoothed with a 5 mm (full width half maximum) kernel, before applying the white matter mask to create white-matter-only fractional anisotropy maps. Note that the smoothing was not to comply with the statistical requirements of parametric analysis, since the analysis stage uses non-parametric methods, but simply to increase signal: noise ratio – although this also served to sensitise the analysis to structures with spatial extents of this size. Reference Jones, Symms, Cercignani and Howard12 All computation was carried out on a Sun workstation (Sun Microsystems, Mountain View, California, USA).
Statistical analysis
The principal analysis was a voxel-based analysis of variance (ANOVA) of the fractional anisotropy of the white matter of the patient group compared with the control group. This was carried out in XBAM version 3.4 (Institute of Psychiatry, London, UK) employing a permutation-based method. The one-way ANOVA was fitted to each voxel of the normalised, segmented fractional anisotropy maps using patient v. control status as the grouping variable. The ANOVA was only fitted at voxels where all participants contributed; when combined with the liberal thresholding described earlier, this confined analysis to the body of the white matter. After fitting the ANOVA model to the observed data, the participant labels were randomly permuted between the two groups to achieve the null hypothesis of no main effect of group membership on fractional anisotropy. This permutation was carried out 1000 times at each voxel to allow the construction of a voxel-level null distribution of fractional anisotropy differences. This approach is necessary with DTI because in areas close to tissue boundaries any normalisation error will produce a strongly bimodal distribution of fractional anisotropy. A final advantage of the non-parametric approach is that hypotheses can be tested at the cluster level rather than at individual voxel level, potentially increasing sensitivity, and this level can be chosen so as to give precise control over the false positive rate. Reference Rabe-Hesketh, Bullmore and Brammer13 After determination of voxels showing significant effects at a relatively low threshold (P<0.01), sets of spatially contiguous suprathreshold voxels were identified, and the sum of the suprathreshold voxel-wise test statistics (or ‘mass’) of each three-dimensional cluster was calculated. The mass of each cluster was then tested against the corresponding permutation distribution, an approach for which there is no parametric equivalent owing to the lack of appropriate theoretical distributions. Reference Poline, Worsley, Evans and Friston14 Voxel and cluster-wise probability thresholds were chosen to ensure less than one false positive in the imaging volume. The identification of clusters with white matter tracts was made by reference to Mori et al and Crosby et al. Reference Mori, Wakana and Van Zijl15,Reference Crosby, Humphrey and Lauer16
The secondary analyses used the significant clusters identified by the principal analysis. The mean fractional anisotropy over each identified cluster was extracted for each participant. This allowed correlations of illness duration with fractional anisotropy, and comparison of the cluster means for the medicated v. unmedicated groups. These analyses were carried out using SPSS version 13.0 for Windows.
Results
The demographic characteristics of the sample are shown in Table 1 and compared with the patient group according to medication status in Table 2.
Table 1 Demographic characteristics of the sample
| Patients (n=76) | Controls (n=76) | P a | |
|---|---|---|---|
| Age, years: mean (s.d.) | 30.9 (10.2) | 30.5 (10.0) | 0.9 |
| Male/female, n | 66/10 | 65/11 | 0.8 |
| Handedness | All right-handed | All right-handed | |
| IQ, mean (s.d.) | 105.2 (9.7) | 106.7 (9.4) | 0.7 |
| Illness duration, years: median | 4 |
a. All values represent Mann–Whitney tests
Table 2 Demographic comparison of medicated v. only briefly medicated patients
| Medicated (n=30) | Unmedicated (n=15) | P a | |
|---|---|---|---|
| Age, years: mean (s.d.) | 25.8 (5.3) | 24.1 (5.2) | 0.3 |
| Male/female, n | 26/4 | 14/1 | 0.4 |
| Handedness | All right-handed | All right-handed | |
| IQ, mean (s.d.) | 102.5 (11.2) | 97.8 (6.8) | 0.1 |
| Treatment duration, median | 3 years | 3 days | <0.0001 |
a. All values represent Mann–Whitney tests
The principal analysis revealed several white matter areas where the patient group had significantly lower fractional anisotropy than the control group (at thresholds of voxel P<0.01 and cluster P<0.0025, chosen so that less than one false positive cluster would be expected within the image volume by chance alone; Fig. 1). In contrast, there was no area where fractional anisotropy was higher in the patient group. Table 3 lists the coordinates of the centre of mass and approximate white matter location for each cluster. All but one of the clusters were extensive, however, and in no case corresponded to a single white matter structure. They are more fully described as follows.

Fig. 1 Areas of reduced fractional anisotropy in patients with schizophrenia v. controls (the left of the brain is on the right of the slice images).
Table 3 Areas of reduced fractional anisotropy in patients compared with controls
| Talairach coordinates | Fractional anisotropy, mean (s.d.) | |||||||||
|---|---|---|---|---|---|---|---|---|---|---|
| White-matter region | Side | X | Y | Z | Patient group | Control group | P | |||
| Brainstem | Right | 5 | –31 | –22 | 452 (30) | 470 (20) | 0.002 | |||
| ILF | Right | 40 | –31 | –8 | 453 (29) | 472 (26) | <0.001 | |||
| Fornix | Left | –27 | –22 | –6 | 446 (26) | 464 (18) | 0.001 | |||
| ILF/IFO/optic radiations | Right | 22 | –80 | –2 | 401 (31) | 426 (26) | <0.001 | |||
| ILF/IFO/optic radiations | Left | –22 | –78 | 0 | 416 (29) | 440 (21) | <0.001 | |||
| Anterior thalamic radiation | Right | 20 | 6 | 10 | 435 (33) | 456 (24) | 0.002 | |||
| Corpus callosum | Right | 16 | 28 | 12 | 392 (35) | 416 (31) | <0.001 | |||
| SLF | Right | 27 | 19 | 28 | 338 (29) | 362 (23) | <0.001 | |||
| SLF | Left | –31 | –26 | 32 | 368 (30) | 389 (23) | <0.001 | |||
| Corona radiata | Right | 14 | 9 | 44 | 423 (43) | 455 (34) | 0.002 | |||
IFO, inferior fronto-occipital fasciculus; ILF, inferior longitudinal fasciculus; SLF, superior longitudinal fasciculus
Cluster location
Brainstem
A cluster of reduced fractional anisotropy lay within the brainstem, an area where several small white matter structures run close to each other. At its most inferior extent the cluster included the inferior cerebellar peduncle on the right, and extended to include the right superior cerebellar peduncle, and the lateral aspect of the cerebral peduncle at its most superior extent.
Frontal
A large area of reduced fractional anisotropy in the right inferior frontal white matter extended ventrally to include areas corresponding to parts of the inferior fronto-occipital fasciculus, the forceps minor and the anterior radiations of the corona radiata. More posteriorly the cluster extended bilaterally to include parts of the genu of the corpus callosum and the superior fronto-occipital fasciculus, and abutted the cingulum bundle, notably on the left.
Medial
The large right anterior cluster described above traced the lateral border of the corpus callosum as it forms the body. A second cluster lay in the anterior limb of the internal capsule on the right. A third lay where the interior and external capsules meet posteriorly on the left; this area may contain fibres from the left inferior longitudinal fasciculus, optic radiation and fornix.
Lateral
There were clusters in medial areas of the superior longitudinal fasciculus bilaterally. These were more extensive in the left hemisphere but extended more antero-superiorly in the right.
Medial temporal/occipital
Large bilateral clusters traced areas of white matter extending from the medial temporal lobes to the occipital pole. In form these most clearly corresponded to the inferior longitudinal fasciculi; however, the inferior fronto-occipital fasciculi, the optic radiations and the splenium of the corpus callosum – although they have origins superiorly and medially – could not be excluded from the occipital parts of the clusters.
Superior corona radiata
Bilateral areas of fractional anisotropy reduction were found in the superior radiations of the corona radiata.
Whole brain white matter fractional anisotropy
The mean fractional anisotropy over the whole brain white matter was significantly different between groups (0.314 in patients compared with 0.323 in controls; P=0.001, Mann–Whitney test); the mean segmented white matter volume did not differ between the groups.
Effects of illness duration and antipsychotic medication
In our secondary analyses there was no significant correlation between the mean fractional anisotropy extracted from any of the clusters and duration of illness in the patient group. There was no significant difference between the mean fractional anisotropy extracted from any of the clusters between the briefly medicated and chronically medicated groups. Mean white matter fractional anisotropy over the whole brain likewise showed no correlation with illness duration (Fig. 2) and no medication-status group difference.
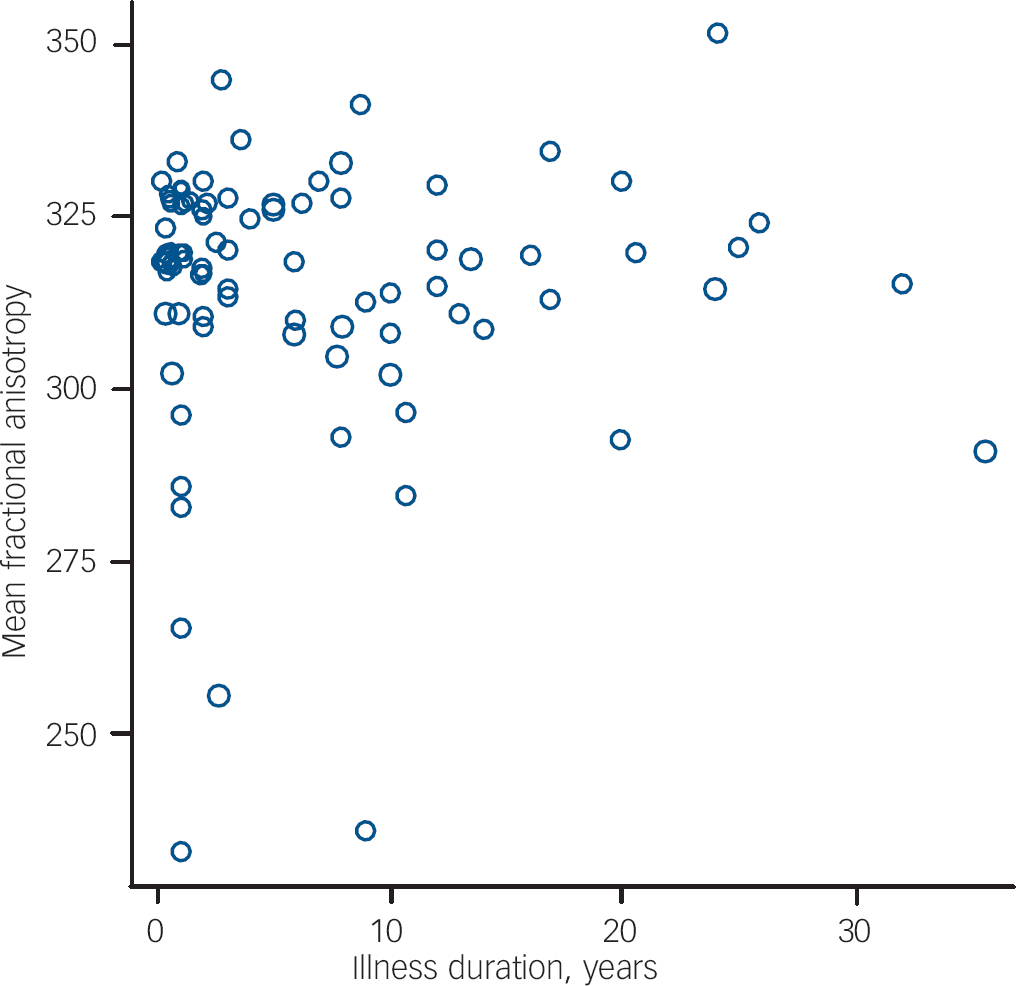
Fig. 2 Scatter plot of illness duration against mean segmented white-matter fractional anisotropy in patients with schizophrenia.
Discussion
Our principal analysis clearly indicated that fractional anisotropy was reduced in several regions of white matter in people with schizophrenia, with no area of increased fractional anisotropy. This direction of differences is consistent with virtually all previous studies. Reference Kanaan, Kim, Kaufmann, Pearlson, Barker and McGuire6 The reductions were evident in areas of the white matter in both hemispheres, involving most of the commissural and association pathways in the brain. This would provide a correlate of, and potential pathological substrate for, the extremely diverse deficits in schizophrenia – phenomenologically, cognitively Reference Reichenberg and Harvey17 and structurally. Reference Davatzikos, Shen, Gur, Wu, Liu and Fan18
Our results included most of the regions that have been reported in previous DTI studies such as the superior longitudinal fasciculus, Reference Buchsbaum, Friedman, Buchsbaum, Chu, Hazlett and Newmark19–Reference Shergill, Kanaan, Chitnis, O'Daly, Jones and Frangou23 the inferior longitudinal fasciculus, Reference Hubl, Koenig, Strik, Federspiel, Kreis and Boesch21 the corpus callosum Reference Hubl, Koenig, Strik, Federspiel, Kreis and Boesch21,Reference Shergill, Kanaan, Chitnis, O'Daly, Jones and Frangou23–Reference Price, Cercignani, Parker, Altmann, Barnes and Barker26 and the fornix. Reference Kuroki, Kubicki, Nestor, Salisbury, Park and Levitt11 Our results can be argued to reconcile these previous discrepant findings. A systematic review of 19 anisotropy-based studies of schizophrenia by our group Reference Kanaan, Kim, Kaufmann, Pearlson, Barker and McGuire6 found anisotropy reductions reported over the whole brain, Reference Lim, Hedehus, Moseley, de Crespigny, Sullivan and Pfefferbaum27 in regions of the corpus callosum, Reference Agartz, Andersson and Skare24,Reference Foong, Maier, Clark, Barker, Miller and Ron25,Reference Ardekani, Nierenberg, Hoptman, Javitt and Lim28 the cingulum, Reference Agartz, Andersson and Skare24,Reference Kubicki, Westin, Nestor, Wible, Frumin and Maier29–Reference Wang, Sun, Cui, Du, Wang and Zhang31 the superior longitudinal fasciculus, Reference Burns, Job, Bastin, Whalley, Macgillivray and Johnstone20,Reference Hubl, Koenig, Strik, Federspiel, Kreis and Boesch21 the uncinate fasciculus, Reference Hubl, Koenig, Strik, Federspiel, Kreis and Boesch21 frontal white matter, Reference Kumra, Ashtari, McMeniman, Vogel, Augustin and Becker32 occipital white matter, Reference Kumra, Ashtari, McMeniman, Vogel, Augustin and Becker32 the cerebellum Reference Wang, Sun, Du, Wang, Cong and Zhang33 and the hippocampus. Reference Kalus, Buri, Slotboom, Gralla, Remonda and Dierks34 There was a marked inconsistency in findings, however, which we speculated was due to small differences examined in small, heterogeneous samples with variable regions of interest: regions identified in one study would not be examined in most studies, or in underpowered ones, leading to false negatives. In the study reported here all of these regions were implicated, with the exception of the uncinate, even at a highly conservative threshold. This suggests that our study was able to detect almost all of the abnormalities that had been individually identified in earlier studies. This may reflect the greater statistical power afforded by relatively large, well-matched samples, and optimised acquisition, as well as the use of a voxel-based approach which permitted analysis of the entire white matter rather than selected regions within it. A recent study of a large sample with different methodology – using regions of interest on multiple tracts – found similarly widespread reductions, again with a question mark over the uncinate. Reference Mitelman, Torosjan, Newmark, Schneiderman, Chu and Brickman35
Our secondary analysis revealed that, within the patient group, none of the reductions in fractional anisotropy was significantly related to the duration of psychotic illness. Recent cross-sectional and longitudinal MRI studies have provided evidence that at least some of the global and regional abnormalities of grey matter volume in schizophrenia progress over the course of the disorder. Reference Velakoulis, Wood, Wong, McGorry, Yung and Phillips3,Reference Kasai, Shenton, Salisbury, Hirayasu, Onitsuka and Spencer36–Reference Wood, Velakoulis, Smith, Bond, Stuart and McGorry43 Although some studies have found white matter volume deficits in schizophrenia, Reference Wright, Rabe-Hesketh, Woodruff, David, Murray and Bullmore44 these are generally less pronounced than in grey matter, Reference Davatzikos, Shen, Gur, Wu, Liu and Fan18 although they are also less well studied, Reference Walterfang, Wood, Velakoulis and Pantelis4 and there is little evidence that these are progressive. Reference Van Haren, Hulshoff Pol, Schnack, Cahn, Mandl and Collins41 Our finding that fractional anisotropy did not correlate with illness duration offers a microstructural counterpart to this. This has been reported previously, Reference Kuroki, Kubicki, Nestor, Salisbury, Park and Levitt11,Reference Foong, Maier, Clark, Barker, Miller and Ron25,Reference Kubicki, Westin, Nestor, Wible, Frumin and Maier29,Reference Kubicki, Westin, Maier, Frumin, Nestor and Salisbury45 but these studies involved much smaller samples. Because our sample was relatively large and included patients with a range of illness durations, it is less likely that the absence of a correlation simply reflects limited statistical power. However, a recent, somewhat larger study by Mori et al found a small negative (uncorrected) correlation of fractional anisotropy with duration. Reference Mori, Ohnishi, Hashimoto, Nemoto, Moriguchi and Noguchi46 One possible explanation for this discrepancy may lie with the different ages of the samples. Age is typically strongly correlated with duration of illness (there was a correlation coefficient of 0.685 in our study), and is itself related to fractional anisotropy in both patients and controls, Reference Friedman, Tang, Carpenter, Buchsbaum, Schmeidler and Flanagan47 although the relationship is perhaps non-linear. In early life, myelination – one of the determinants of fractional anisotropy – tends to increase before declining in early-middle life. Reference Bartzokis, Beckson, Lu, Nuechterlein, Edwards and Mintz48 The sample investigated by Mori et al was relatively old (mean age 39 years) compared with our patients' mean age of 30 years, so the age-related decline might have been more pronounced. This may also partly explain the findings of Friedman et al, Reference Friedman, Tang, Carpenter, Buchsbaum, Schmeidler and Flanagan47 who found widespread differences between patients with chronic schizophrenia and controls, but less extensive differences in a first-episode group (although they did not formally compare their chronic disorder and first-onset groups): again, their chronic disorder group was older than ours, with an age range extending beyond 80 years.
The relationship of illness duration and fractional anisotropy is also potentially confounded by the effect of antipsychotic medication, as in general the longer the duration of the disorder the longer the period of antipsychotic treatment. Antipsychotic medication has been linked to changes in grey matter and white matter volume in monkeys, Reference Dorph-Petersen, Pierri, Perel, Sun, Sampson and Lewis49 and to grey matter reductions in humans. Reference Molina, Reig, Sanz, Palomo, Benito and Sanchez50 There is also evidence that, in humans at least, typical and atypical antipsychotic drugs affect brain volume differentially. Reference Lieberman, Tollefson, Charles, Zipursky, Sharma and Kahn51 There have been fewer studies of the effects of medication on white matter volume in schizophrenia and the results have been inconsistent. Reference Molina, Reig, Sanz, Palomo, Benito and Sanchez50,Reference Lieberman, Tollefson, Charles, Zipursky, Sharma and Kahn51 In our study there was no significant difference in regional or global white matter fractional anisotropy when chronically treated patients were compared with a matched group of patients who had received little or no medication, suggesting that antipsychotic medication did not affect white matter microstructure as measured by fractional anisotropy. This has also been reported previously, again in much smaller studies, Reference Foong, Maier, Clark, Barker, Miller and Ron25,Reference Kubicki, Westin, Nestor, Wible, Frumin and Maier29,Reference Kubicki, Westin, Maier, Frumin, Nestor and Salisbury45 although not all studies agreed, Reference Kuroki, Kubicki, Nestor, Salisbury, Park and Levitt11 and one recent study reported fractional anisotropy decreases in a larger group who had received no medication at all. Reference Cheung, Cheung, McAlonan, Deng, Wong and Yip52 Our groups were matched for age, so age should not have confounded the analysis. Our findings are largely limited to atypical antipsychotic medication, however, since only one member of our combined sample was taking a typical antipsychotic drug. Our chronically medicated group had been treated for a median of 3 years, by which time most macrostructural effects had been demonstrated in other studies. Reference Lieberman, Tollefson, Charles, Zipursky, Sharma and Kahn51 However, most volume effects have been shown in the initial months, Reference Lieberman, Tollefson, Charles, Zipursky, Sharma and Kahn51 so that some medication effects cannot be entirely ruled out in our ‘unmedicated’ group, even though they had taken antipsychotics for a median of only 3 days.
Whole brain white matter fractional anisotropy was lower in our study, and this was not simply the effect of a few clusters of greatly reduced fractional anisotropy: 85% of white matter voxels had a mean fractional anisotropy lower in patients than in controls when the comparison was unthresholded (Fig. 3). However, our analysis suggests that if the fractional anisotropy reduction affected most white matter then, at the very least, there were areas that were more severely affected. Areas such as the uncinate Reference Mori, Ohnishi, Hashimoto, Nemoto, Moriguchi and Noguchi46 or the posterior cingulum, Reference Fujiwara, Namiki, Hirao, Miyata, Shimizu and Fukuyama53 which other studies identified but our study did not, were on the edge of our clusters, and would have been included were our threshold less stringent.

Fig. 3 White matter voxels where mean fractional anisotropy is lower (a) and higher (b) in patients than in controls (unthresholded comparison).
Limitations
Although our large sample provided sufficient power to examine the effects of illness duration and medication on fractional anisotropy in a cross-sectional design, duration of illness and treatment are usually highly correlated. Differentiating their effects from each other, and from age, might be facilitated by prospective DTI studies, particularly in groups in whom it is possible to carefully monitor exposure to antipsychotic medication such as first-episode or high-risk samples.
One particular difficulty with the interpretation of our results lies in localising the differences. This is a difficulty in common with all voxel-based analysis methods. Region-of-interest and tractographic methods, although they face other challenges, Reference Kanaan, Shergill, Barker, Catani, Ng and Howard7 at least have an a priori location within a specific tract or tracts. One area of difference from our results, for example, lies in the right frontal white matter (Fig. 1), but it is unclear how best to describe this location, for it does not precisely correspond to any particular white matter tract: it lies largely in the genu of the corpus callosum, but morphologically is more like the anterior cingulum or the superior fronto-occipital fasciculus. This area has been highlighted in other studies, Reference Ardekani, Nierenberg, Hoptman, Javitt and Lim28,Reference Kumra, Ashtari, McMeniman, Vogel, Augustin and Becker32 and has usually been described as ‘the region of the cingulum’. Although this facilitates a functional interpretation, it would (in our case at least) ignore the bulk of the cluster. This reflects two issues facing DTI. The first is that white matter localisation lacks the precision and consensus that grey matter analysis has been used to for some time, although there are some notable attempts to rectify this, for example by using post-mortem samples. Reference Burgel, Amunts, Hoemke, Mohlberg, Gilsbach and Zilles54 The second is that a cluster- or voxel-based analysis is designed to identify clusters or voxels of difference rather than tracts. Clusters will not necessarily lie within single tracts, even where they can be readily distinguished from their neighbours, and this makes the description and interpretation of the results more difficult. Although it is tempting to localise a cluster to a single tract for these reasons, this assumes that any true difference corresponds to the morphology of a tract, and that the cluster is only a partial capture of that true difference. The reality may be very different, however, and is likely to vary with the causes of any white matter changes. A tract-like difference might be predicted where white matter disconnectivity has developed in response to altered function. However, environmental insults might follow the pattern of arterial supply, for example, or of infective foci, leading to clusters of difference (as in progressive multifocal leukoencephalopathy). Reference Kuker, Mader, Nagele, Uhl, Adolph and Klose55 Moreover, genetic abnormalities, in myelination for example, might lead to differences that affected all white matter, to a greater or lesser degree (as in adrenoleukodystrophy). Reference Schneider, Il'yasov, Boltshauser, Hennig and Martin56 Our results, which are supportive of cluster-level or whole-brain effects, must be interpreted in the context of the analysis method.
In conclusion, our findings indicate that there are widespread reductions in fractional anisotropy in schizophrenia, independent of illness duration and the effects of antipsychotic medication. There are various determinants of reduced fractional anisotropy, the most important of which are disordered neuronal architecture and myelination, Reference Pierpaoli and Basser57,Reference Beaulieu58 and there is evidence for both of these in schizophrenia. Reference Flynn, Lang, Mackay, Goghari, Vavasour and Whittall59–Reference Kubicki, Park, Westin, Nestor, Mulkern and Maier61 Since either of these would lead to altered white matter function, our finding of reduced fractional anisotropy provides support for disconnectivity models of schizophrenia. Further, since the differences were so widespread, they would support disconnectivity between frontal, temporal, parietal, occipital and cerebellar regions.
Acknowledgements
R.K., M.P. and S.S. were funded by The Wellcome Trust. P.M. has received honoraria for lectures and consultancy fees from Lilly, AstraZeneca and Janssen Cilag. S.S. has received honoraria or support to attend conferences from Janssen, Lilly, Novartis and Sanofi-Synthelabo, and unrestricted project grant support from Novartis and AstraZeneca.


 Open access
eLetters
No eLetters have been published for this article.