


Depression is a major cause of morbidity and its burden of disease ranks high in many countries. 1 However, the burden is not the same in all populations. Reference Chiu2 A European study found prevalence rates varying from 2.5% in Santander to 17% in Liverpool, whereas a worldwide study found rates up to 29.5%. Reference Ayuso-Mateos, Vázquez-Barquero, Dowrick, Lehtinen, Dalgard and Casey3,Reference Goldberg, Lecrubier, Üstün and Sartorius4 Goldberg & Lecrubier postulate that some of the intercountry differences may be as a result of differing cultural concepts of illness and ways of communicating symptoms, but find it difficult to see how this could possibly account for the enormous range of rates between countries that are culturally related. Reference Goldberg, Lecrubier, Üstün and Sartorius4 This makes it likely that real differences in the prevalence of depression exist.
Little is known about the causes of these population-level differences. Clinical practice stimulates the application of a clear distinction between those who have a disease and need to be treated, and those who do not. This directs the search for causes of disease towards identifying the differences between healthy and diseased individuals. The distinguished epidemiologist Geoffrey Rose showed that for many risk factors for cardiovascular disease, continuous population distributions over severity levels underlie the estimates of prevalence. The prevalence of hypertension, for example, is nothing but the proportion of individuals with a blood pressure above a certain level. Moreover, the threshold between having and not having hypertension is essentially arbitrary: the risk of disease does not suddenly change at this point of the population distribution of blood pressure. For continuous exposures such as blood pressure, alcohol consumption and body mass index, the mean predicts the number of ‘deviant’ individuals. Rose's work paved the way for research into the factors that determine the exposure of populations rather than individuals, an area of research that hitherto had been largely ignored. Reference Rose and Day5
Mental health epidemiology often examines incidence and prevalence rates between subpopulations and therefore makes the same clear distinction between those that are depressed and those that are not. If there is such a thing as an underlying population distribution of mood that we can measure, this might open up new avenues for research into the causes of depression. This study aims to investigate whether in depression, like in cardiovascular disease, the population mean predicts the number of individuals at the extreme end of the distribution.
Method
Data
We used data from the European Outcome in Depression International Network (ODIN) study, which examined populations in Finland, Ireland, Norway, Spain and the UK. The study was conducted in urban centres (Turku, Dublin, Oslo, Santander and Liverpool) and rural areas (in Finland, Ireland, Norway and Wales). The ODIN study had two phases. The first phase identified possible cases of depression with the Beck Depression Inventory (BDI). Reference Beck, Ward, Mendelson, Mock and Erbaugh6 The BDI consists of 21 questions with answer categories ranging from an absence of symptoms (0 points) to severe symptoms (3 points). In the second phase of ODIN, all of those scoring above 12 on the BDI and a random 5% of responders were offered detailed interviews. The Schedule for Clinical Assessment in Neuropsychiatry (SCAN) version 2.0 7 was used to generate diagnoses of depressive disorders on the basis of ICD–10 8 and DSM–IV 9 categories. The overall response rate was 65% for the first phase of the survey and 73% for the second phase. The ODIN study is described in more detail elsewhere. Reference Ayuso-Mateos, Vázquez-Barquero, Dowrick, Lehtinen, Dalgard and Casey3,Reference Dowrick, Casey, Dalgard, Hosman, Lehtinen and Vázquez-Barquero10
Analysis
As in an earlier study based on the ODIN data, Reference Ayuso-Mateos, Vázquez-Barquero, Dowrick, Lehtinen, Dalgard and Casey3 our definition of depressive disorders (‘depression’) includes dysthymia and adjustment disorders with depressive mood according to DSM–IV or ICD–10 criteria and is determined based on the SCAN interviews conducted in phase two. For participants with a BDI score but missing values for depression in the second phase we imputed values based on their BDI score and the probability of being diagnosed with depression in the second round at that BDI score among participants with full data. We calculated the average prevalence of depression by BDI score of 13 and over among those with full data, then smoothed the resulting curve by applying a second-order polynomial, and assumed that all those with a BDI score over 40 suffered from depression. For the participants with a BDI score below 13 we used the same procedure but now fitted a simple linear relationship. We interpreted negative values as 0. For example, participants with a BDI score of 0 or 1 were assigned a probability of depression of 0, those with a BDI of 12 a probability of 0.04 and those with a BDI of 20 a probability of 0.48.
We established the relationship between mean BDI and prevalence of depression in two different ways. First, we assumed a simple linear relationship between mean BDI and the prevalence of depression. Second, we constructed a model that describes the population distribution of BDI scores and estimates the prevalence of depression by assessing the proportion above a certain threshold value of BDI. This second method comes in two variants; one with an ‘exact’ cut-off value and one using a natural number as cut-off. Finally, by way of sensitivity analysis, we assessed the relationship between the prevalence of depression and mean BDI with the latter calculated after exclusion of all cases of depression.
Modelling the distribution of BDI scores
We prepared frequency distributions of BDI scores for populations by country, gender, age (18–40, 41–65), and rural/urban residency, which added up to 36 populations. For each of the 64 possible BDI scores (0–63) we determined the percentage of respondents with that score. This typically resulted in high percentages for low BDI scores and gradually lowering percentages at higher BDI scores.
The distributions of the 24 populations from Finland, Norway and the UK (‘index populations’) were fitted to mathematical distributions. The aim was to determine the formula that best predicted all distributions based on the mean BDI score. We used the least squares method and the generalised reduced gradient algorithm embedded in the ‘Solver’ add-in function in Microsoft Office Excel 2003 as optimisation routine. Reference Fylstra, Lasdon, Watson and Waren11
We tested the Weibull, beta and gamma distributions because all three are capable of describing highly skewed distributions. Because the distributions are continuous whereas the BDI gives discrete results (natural numbers), we interpreted a BDI score of 0 to represent all values between 0.000 and 0.999, a score of 1 as 1.000 to 1.999, etc. The Weibull and gamma distributions range from 0 to plus infinity, but the beta distribution is restricted to 0… 1. We therefore scaled the range to fit the BDI range of 0 to 63. All three distributions have two parameters, usually called ‘α’ and ‘β’, which together determine the shape of the distribution. We assumed that the BDI mean could influence both α and β, and that the relationship could be described by a slope and an intercept, which leads to formulae of the type:
and
The fitting procedure determined the values for a and b.
Subsequently, we determined the cut-off value for BDI that most accurately predicted the prevalence of depression that was found in the data. Again using the least squares method and the solver function, we determined the value for this cut-off for depression by minimising the difference between the prevalence of depression and the prevalence predicted by our model.
Testing the models
The prediction models were tested on the data from Ireland and Spain (‘test populations’).
Results
Online Table DS1 gives an overview of the data. Sample sizes varied between roughly 200 and 450 participants per population, with the exception of the Irish data, which had only 45 to 76 individuals per group. The mean BDI scores in the index populations ranged from 4.18 (Norwegian rural males aged 18–40) to 10.69 (Liverpool females aged 41–65). The prevalence of depression in the index populations ranged from 1.7% in rural Finnish males aged 18–40 to 20.0% among Liverpool females aged 41–65 (Table DS1). The mean BDI values and the prevalence of depression in the Spanish populations were considerably lower than those in the index populations, whereas one of the Irish populations had values higher than the upper values in the index populations (Table DS1, Fig. 1).
In the index populations, mean BDI correlated with diagnosed depression with an R 2 of 0.84 (slope 0.022064, intercept −0.05669; Fig. 1). In regression, the R 2 coefficient of determination is a statistical measure of how well the regression line approximates the real data points. An R 2 of 1.0 indicates that the regression line perfectly fits the data. When mean BDI was calculated after exclusion of participants with depression, it was still positively associated with the prevalence of depression, although R 2 was reduced to 0.70.
We then tested whether it was possible to describe the population distributions mathematically. In all index populations except older males in Liverpool, the most frequent BDI score was 0, and all BDI distributions were strongly skewed to the right. A beta distribution with parameters:
provided the best fit (see example in Fig. 2).
The cut-off for BDI score that most accurately predicted the prevalence of depression in the beta distribution was 17.44 (R 2 index populations = 0.86). When the cut-off value was restricted to natural numbers, it was 16/17 (R 2 index populations = 0.83), i.e. the proportion of the population that scores 17 or higher corresponded best with the prevalence of depression in the index populations.
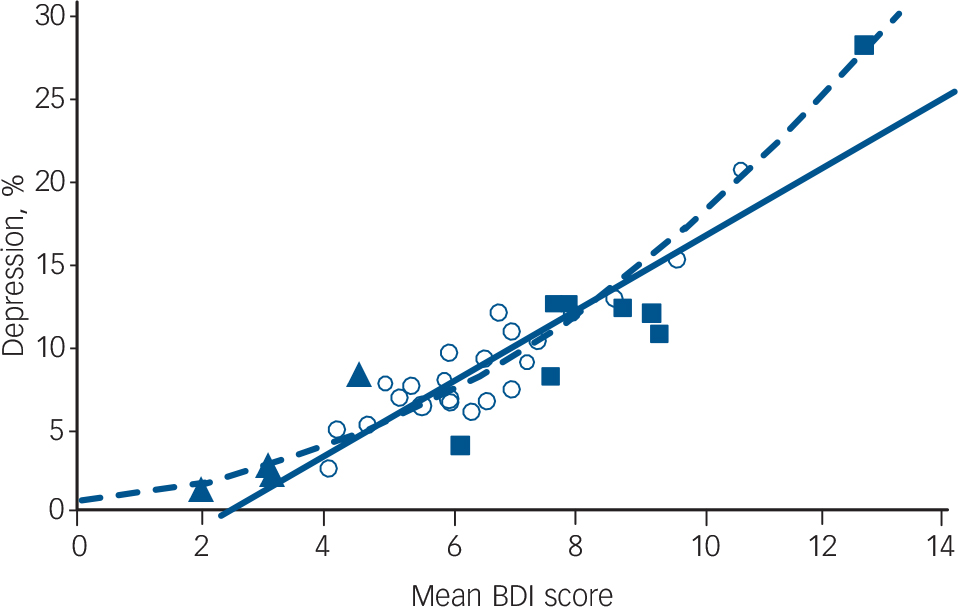
Fig. 1 The correlation between mean Beck Depression Inventory (BDI) score and the prevalence of depression in the index and test populations (solid line; R 2 index populations = 0.84; R 2 all populations = 0.82) and the fitted beta model (dashed line; R 2 index populations = 0.86; R 2 all populations = 0.86).
The open circles represent the index populations, the solid triangles the Spanish data and the solid squares the Irish data.
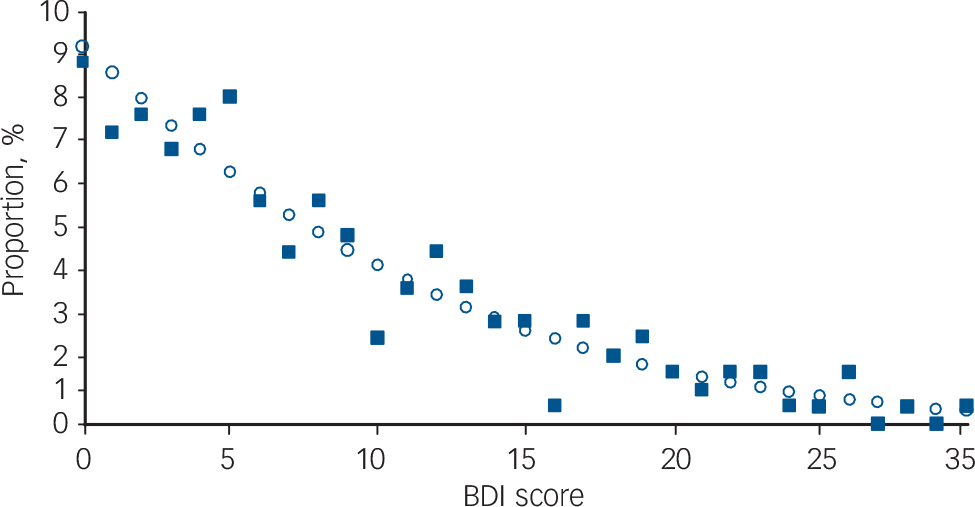
Fig. 2 Population distribution of scores on the Beck Depression Inventory (BDI) for the ODIN sample of urban females aged 18–40 in the UK (n = 239).
The solid squares represent the data, the open circles show the values predicted by the model, given the mean BDI score of 8.70 in this population.
Table DS1 shows the accuracy of the predictions of the prevalence of depression using the different models: the one based on the linear correlation between mean BDI and the prevalence of depression (Fig. 1), interpreting negative values as 0; the beta distribution with the precise cut-off value of 17.44; and the beta distribution that estimates the depression prevalence based on the modelled proportion with a BDI score of 17 or higher. On average, the beta model predicted the prevalence of clinical depression reasonably well in the Irish and Spanish populations, albeit with large residual errors for the Irish populations because of their small numbers (Table DS1, Fig. 3). On average, the model overestimated the Irish depression prevalence by 1.8% (95% confidence interval: −3.0 to 6.5) on an average prevalence of 12.5% and slightly underestimated the Spanish prevalence (–0.5%; 95% CI −4.8 to 3.7) on an average of a mere 3.4%. The average error of the simple correlation model is lower than that of the beta model, but the standard error is larger. This suggests it may be more valid (less systematic bias) than the more complex models, but less accurate. The results for the Spanish data suggest that this model may tend to underestimate the prevalence of depression in the lower ranges.
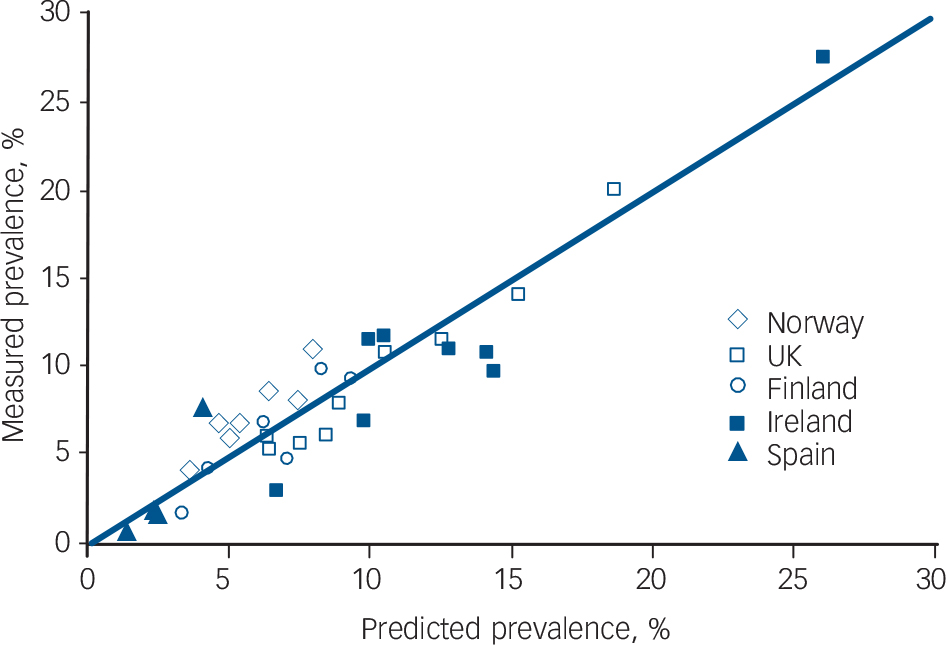
Fig. 3 Depression prevalence as predicted by the beta model compared with the measured prevalence.
The diagonal line depicts perfect correlation. The somewhat wider dispersion of the results for the Irish populations most likely reflects the smaller number of observations.
Discussion
Interpretation
This study provides empirical support for the existence of continuous population distributions of mood with predictable characteristics, of which the mean predicts the number of clinical cases of depression. The prevalence of depression was also correlated with the mean BDI score among those free from depression, so the association does not simply arise because the BDI scores of people with depression pull up the average. The correlation between mean BDI and clinical depression we found in this study is less than the correlation found in the Intersalt study between, for example, mean alcohol consumption and the prevalence of heavy drinking (correlation coefficient 0.97), but comparable to that between mean sodium excretion and the prevalence of high sodium intake (0.78). Reference Rose and Day5 Measurement problems may have lowered the correlation we found.
This study is limited by the fact that depression and mood are difficult to define, let alone measure accurately. Undoubtedly, the BDI and the combination of SCAN with ICD–10 or DSM–IV measure slightly different concepts. This reduces the correlation between the results and decreases the ability of one instrument to predict the results of the other. (Rose & Day, Reference Rose and Day5 in contrast, used the same measurement instrument for both the determination of population mean and the prevalence of ‘deviant’ individuals.)
Our results may also have been influenced by low numbers of observations in some of the populations and by response rates in the survey. Non-response may have been dependent on mood, which would affect the shape of the BDI distribution we found in our data. The shape of this distribution we found in this study can therefore be no more than an approximation of an underlying true distribution of mood, however defined.
Lastly, we investigated only depression as outcome, but mood may also influence the prevalence of other mental disorders such as substance misuse and anxiety disorders. All of these factors would work to decrease the association we found, so that in all, the population mean probably predicts the number of individuals at the extreme end of the distribution in depression to a similar degree as in cardiovascular disease.
Population-level causes of depression
Most, but not all, taxometric studies of the BDI support the view that depression is not a clinical entity separate from low mood. Reference Ruscio and Ruscio12,Reference Solomon, Ruscio, Seeley and Lewinsohn13 Together with our finding that the mean BDI score among the non-depressed in a population predicts the prevalence of depression, this suggests that the causes are affecting all individuals in a population, albeit not necessarily to the same extent. The search should be for environmental, social and cultural factors that influence this population mean. The identification of the factors that determine mood at the population level may lead to new ways to reduce the burden of depression, by treating populations in addition to treating individuals. To identify factors that influence mood at the population level, it is necessary to conduct studies that compare populations. Within populations, age, gender and socioeconomic status have been identified as determinants of mood within countries, Reference Everson, Maty, Lynch and Kaplan14 but these factors may not adequately explain the differences in mood between countries. Indicators of deprivation are not invariably implicated. Reference Goldberg, Lecrubier, Üstün and Sartorius4,Reference Mikolajczyk, Maxwell, El Ansari, Naydenova, Stock and Ilieva15 Sociodemographic variables at the individual level explain little of the high prevalence of depression found among urban women in the British Isles, Reference Lehtinen, Michalak, Wilkinson, Dowrick, Ayuso-Mateos and Dalgard16 nor do negative life events, social support or vulnerability explain the higher rates of depression among women. Reference Dalgard, Dowrick, Lehtinen, Vazquez-Barquero, Casey and Wilkinson17 Multilevel analyses that include factors at country level in addition to known individual-level determinants of depression may provide new insight into the causes of depression.
Relevance of results
The mathematical description of mood in populations in this study is useful in combination with studies that link risk factors to depression. For example, the BDI is often used in studies into the effects of physical activity on depression because it provides more statistical power compared with the presence or absence of depression as a measure of outcome. Reference Lawlor and Hopker18,Reference Teychenne, Ball and Salmon19 If the relationship between physical activity and BDI score and the BDI distribution in a population are known, it becomes possible to estimate the mood improvement brought about by current population levels of physical activity, and how much could be gained by interventions that increase physical activity at the population level such as the construction of walkways and cycle paths. The effects of population-targeted interventions such as school-based psycho-education could be similarly estimated. Reference O'Kearney, Kang, Christensen and Griffiths20 If mood has a continuous distribution and depression is not a separable nosological entity, this also has consequences for the disease classification systems. Reference Kraemer, Shrout and Rubio-Stipec21 For DSM–V, the addition of a dimensional adjunct to each of the traditional categorical diagnoses has been proposed. Reference Kraemer22,Reference Helzer, Kraemer and Krueger23
Implications
To paraphrase Rose, these findings imply that distributions of depression-related characteristics move up and down as a whole: the frequency of ‘cases’ of depression can be understood only in the context of a population's characteristics. The population thus carries a collective responsibility for its own health and well-being, including that of its members at the extreme end of the distribution, by the influence that societal processes and decisions have on collective mood.
Funding
J.L.V. was supported by an NHMRC Capacity Building Grant (no. 456002) and the EcoReside project (NHMRC no. 458768). The ODIN project was supported by the European Commission Biomed 2 programme; the NHS Executive North-West Research and Development Office (Contract RDO/18/31); the Spanish FIS (Exp. No 96/1798); the Wales Office of Research and Development (Contrast RC092); the Norwegian Research Council, Council for Mental Health and Department of Health and Social Welfare; and the Finnish Pensions Institute of Agricultural Entrepreneurs (Contract 0339).


eLetters
No eLetters have been published for this article.