


Old age, mental illness and intellectual disability are among the main determinants of healthcare expenditure. Reference Meerding, Bonneux, Polder, Koopmanschap and van der Maas1–Reference Polder, Meerding, Bonneux and van der Maas3 In the general population psychiatric disorders influence the cost of care for older adults, and both depression and dementia are significant predictors of high service costs. Reference Livingston, Manela and Katona4 The cost of caring for people with intellectual disability currently makes up a large proportion of healthcare spending in western Europe, Reference Polder, Meerding, Bonneux and van der Maas3 and may rise in line with the increasing number of people with intellectual disability now living to old age; Reference Holland5 moreover, the rates of mental illness and dementia in people with intellectual disability have been found to be higher than in the general population. Reference Cooper, Smiley, Morrison, Williamson and Allan6,Reference Strydom, Livingston, King and Hassiotis7
There has been no published study of costs of care of a representative sample of older people with intellectual disability. Our study reports service use patterns and costs for older people with intellectual disability in the UK, including accommodation, in-patient and out-patient care, as well as domiciliary and personal care. We predicted that dementia and other psychiatric disorders would be independently associated with increased care costs in this population, and explored the influence of other possible sociodemographic and illness-related determinants.
Method
We undertook a survey of all adults with intellectual disability without Down syndrome aged 60 years and older living in five inner-city and suburban London boroughs: Camden, Islington, Enfield, Harrow and Greenwich. The study method is described in detail in earlier papers. Reference Strydom, Livingston, King and Hassiotis7,Reference Strydom, Hassiotis, King and Livingston8 The Thames Valley multicentre research ethics committee approved the study and it was agreed with the research and development offices of all participating National Health Service (NHS) organisations.
Participants and consent procedures
All adults with intellectual disability aged 60 years and older, currently resident in any of the five boroughs, were identified from Social Services electronic databases and intellectual disability team healthcare records (current and past recipients of care who have been recorded at any time to have intellectual disability), and from all local residential and day service providers (voluntary or government sector) for adults with intellectual disability.
Informed consent was obtained from participants with intellectual disability who had capacity, but for those who lacked capacity we sought agreement from carers. We also gained consent from informants for their own participation in the survey. Informants were family members, social workers or care staff who had regular contact with the participants. If necessary, further informants or historical records were sought.
Severity of intellectual disability
Intellectual disability was defined according to ICD–10 criteria for mental retardation as global developmental delay, IQ below 70 and impairment of social functioning. 9 Those in whom the intellectual disability status was uncertain at screening underwent an assessment and were excluded if they did not meet these ICD–10 criteria. Each participant's severity of intellectual disability was rated to be mild or more severe, according to their early and adult abilities (including IQ score if available).
Physical health
Information on physical health was obtained from medical records, or from informants in the small number of cases for whom records were not available. We grouped participants into those with one or more chronic health problems and those with none. (Chronic health problems were conditions requiring long-term treatment such as cardiovascular disorders, including hypertension; lipid metabolism disorders; respiratory diseases such as chronic obstructive airway disease; arthritic conditions; gastrointestinal disorders such as peptic ulcers and chronic constipation; endocrine disorders such as diabetes; urinary or renal disorders such as chronic urinary tract infection and renal failure; haematological conditions such as anaemia; solid tumours; and neurological conditions such as epilepsy.) Mobility was rated independently of other physical health problems using the Instrumental Activities of Daily Living scale. Reference Lawton and Brody10 Mobility problems were defined as the need to use a railing, cane, frame or wheelchair, or being bedridden.
Hearing ability was assessed with the whispered voice test. Reference Pirozzo, Papinczak and Glasziou11 Participants using hearing aids were tested with their aids and hearing was rated as follows: no hearing impairment; can hear speech of normal volume; can only hear loud speech; deaf or near deaf. The screening version of the Kay picture test was used to screen for deficits in visual acuity. Reference Kay12 It was designed for children 2–3 years old, and has also successfully been used in adults with intellectual disability. Reference Prasher13,Reference Woodhouse, Griffiths and Gedling14 Participants using correction wore their glasses during testing and visual acuity was rated as follows: normal; impaired; blind or almost blind (even after correction).
Mental health and dementia
Participants were divided into those with and those without a current history (obtained from informants or health records) of one or more serious mental illnesses, including psychoses, affective disorders, anxiety disorders, severe behavioural problems and personality disorders. We did not include a rating for autism-spectrum disorders.
All participants were screened for cognitive or functional decline and memory function. Those who screened positive had a detailed assessment, and the participants were divided into those with and those without a diagnosis of dementia (according to ICD–10, DSM–IV or DC–LD criteria; diagnosis using these criteria has been described in a previous report). Reference Strydom, Livingston, King and Hassiotis7
Service use
All informants were interviewed using the Client Service Receipt Inventory (CSRI) adapted for use in intellectual disabilities. Reference Beecham, Knapp and Thornicroft15 This collects comprehensive data on a range of demographics and services including usual place of residence, accommodation charges, income and sources of income, and receipt of all healthcare, social care and other services (day care, domiciliary care, respite care and nursing care, in-patient stays, primary and community care contact). Time spent caring by family, other unpaid carers and external providers and aids and adaptations used by study participants were also recorded. We collected data for the preceding 3 months, except for hospital services and aids and adaptations, which covered the previous 6 months. We recorded regular medication use (excluding as needed medication) for the preceding month. Agreement between information collected with the CSRI and general practitioner records has been shown to be relatively high. Reference Byford, Leese, Knapp, Seivewright, Cameron and Jones16
Costs
All costs are expressed as weekly estimates.
Information on the weekly accommodation charges for residential settings came from the manager of the home, or the care manager overseeing the placement. Costs of health and social care were estimated by combining health and social care resource utilisation data with unit costs (2005–6 levels). Unit costs were collected from a variety of national sources. Costs per contact with health and community professionals were taken from an annual national compendium. Reference Curtis and Netten17 Publicly available national reference costs were used to estimate the cost of out-patient attendances. 18 For some services (accident and emergency, out-patient care and all community-based services) the weekly cost estimate was derived by multiplying the mean number of contacts made with a given service (over 3 months) by the unit cost of contact with service (for each person). The weekly mean cost of that service is estimated by taking the total cost of that service for all patients divided by the total number of service users, divided by 13 weeks. Weekly estimates of hospital-based services were derived in the same way but the costs were weighted by 26 weeks, as hospital service use was based on a 6-month retrospective time-point.
An estimate of the cost of nursing care by external provider to the service user was estimated by multiplying the nursing time spent by the unit cost of a district nurse. Reference Curtis and Netten17 Day activities were estimated by multiplying the appropriate unit of measure consumed in a week by the unit cost of that unit of measure. Costs of informal care were estimated by combining the time spent in domiciliary and personal care by the national minimum hourly wage rate. 19 Weekly medication costs were estimated by calculating the cost per unit (e.g. per tablet, per volume or per inhaler) at prices quoted in issue 50 of the British National Formulary, 20 and multiplying this by the actual amount used over the period, except for ointments or creams which were estimated by assuming that the smallest commercially available tube or container was bought every 4 weeks. Missing data on day centre, hospital and community-based services were imputed using the median, to avoid distributional concerns, whereas weekly accommodation charges were estimated using the median charge for individuals living in a similar setting. Data were nearly complete – less than 1.5% (range 0.5–2.3%) of data points were missing. Incomplete medication dosing information was completed using standard dosing regimens if possible. The weekly cost of aids and adaptations was estimated using median annual costs divided by 52. For aids and adaptations not contained in this compendium, costs were estimated by taking the price of the aid, discounting it over 5 years at 3.5% and dividing by 52.
Statistical analysis
Ordinary least squares analysis was used to examine the associations between baseline characteristics and total costs. Bivariate analysis was used to investigate associations between each of the baseline characteristics and the total costs of care, using simple linear regression. Associations between costs and continuous variables were computed. All explanatory variables that had a bivariate association with costs were initially included in the model. Variables that did not have bivariate associations with costs were then included one at a time and were kept if they added significantly to the model. The decision to retain or discard a variable was based on significance at the 10% level. This approach was chosen as it allowed us to investigate the impact of various potential predictors of costs independently and when all were included in the model. This approach avoids bias due to omitted variables by including not only variables associated with costs in the preliminary analysis, but exploring the importance of other variables.
Results
We identified and contacted 281 potential participants. Of these, 24 (8.5%) were ineligible for the study. Of the remainder, 222 (86.4%) participated. The prevalence of eligible participants with intellectual disability in the total population of all adults aged 60 years and older was 0.15%. Participants' demographic details are given in Table 1. More than half of the participants (55.4%, n = 123) were rated as having mild intellectual disability and 99 (44.6%) had moderate or more severe intellectual disability; 41.9% had a mental disorder. Most participants (89.6%) were dependent on state benefits for their income, but 17 (7.7%) had income from private sources (such as pension, savings or family support).
Table 1 Demographic and health indicators
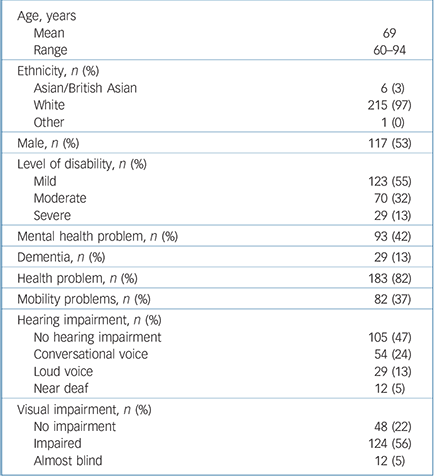
| Age, years | |
| Mean | 69 |
| Range | 60-94 |
| Ethnicity, n (%) | |
| Asian/British Asian | 6 (3) |
| White | 215 (97) |
| Other | 1 (0) |
| Male, n (%) | 117 (53) |
| Level of disability, n (%) | |
| Mild | 123 (55) |
| Moderate | 70 (32) |
| Severe | 29 (13) |
| Mental health problem, n (%) | 93 (42) |
| Dementia, n (%) | 29 (13) |
| Health problem, n (%) | 183 (82) |
| Mobility problems, n (%) | 82 (37) |
| Hearing impairment, n (%) | |
| No hearing impairment | 105 (47) |
| Conversational voice | 54 (24) |
| Loud voice | 29 (13) |
| Near deaf | 12 (5) |
| Visual impairment, n (%) | |
| No impairment | 48 (22) |
| Impaired | 124 (56) |
| Almost blind | 12 (5) |
Table 2 provides information about the cost of hospital and community services, daytime activities and direct care (if not included in the accommodation costs). In total, 215 (97%) participants accessed some form of hospital or community service and the cost to agencies was £55 per week per participant (averaged across the whole sample). Service users accessed a range of community-based services, but the most intensively used were general practitioners and chiropodists. Fifty-one per cent of the sample used at least one hospital-based service, and 95% used at least one community-based service. Daytime activities (e.g. day centre or social clubs) or respite were accessed by 108 (49%) of the sample, with the average cost to service providers being £135 per week. Forty-six (21%) older adults had domiciliary and personal care provided externally (i.e. not as part of the accommodation package) at an average cost of £17 per week over the full sample. Although 42% had a reported psychiatric disorder, just 20% (less than half of those with mental illness) were receiving input from psychiatrists, 12% had input from psychiatric nurses and only 4% had had contact within the past 3 months with a psychologist. The majority of participants (85%) were using at least one medication, 59% of the sample used at least three different types of long-term medication, 94 participants (42%) used four or more different types of medication, 12 (5%) used eight or more medications and there were 4 (2%) who used nine or more medications.
Table 2 Service costs (n = 222)
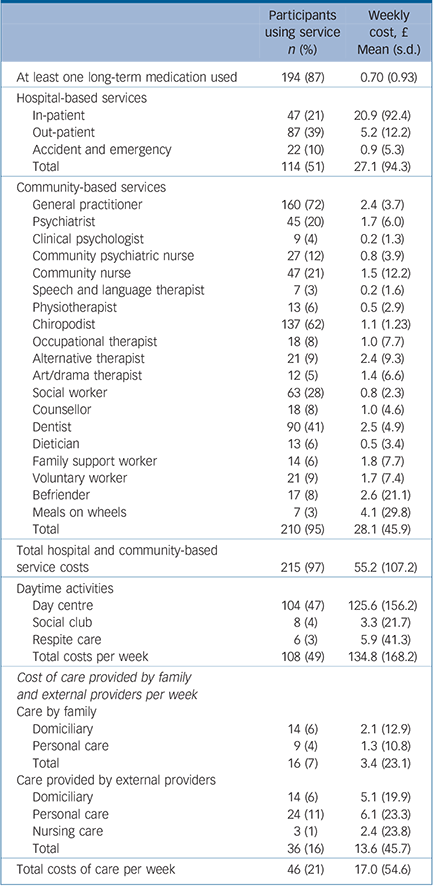
| Participants using service n (%) | Weekly cost, £ Mean (s.d.) | |
|---|---|---|
| At least one long-term medication used | 194 (87) | 0.70 (0.93) |
| Hospital-based services | ||
| In-patient | 47 (21) | 20.9 (92.4) |
| Out-patient | 87 (39) | 5.2 (12.2) |
| Accident and emergency | 22 (10) | 0.9 (5.3) |
| Total | 114 (51) | 27.1 (94.3) |
| Community-based services | ||
| General practitioner | 160 (72) | 2.4 (3.7) |
| Psychiatrist | 45 (20) | 1.7 (6.0) |
| Clinical psychologist | 9 (4) | 0.2 (1.3) |
| Community psychiatric nurse | 27 (12) | 0.8 (3.9) |
| Community nurse | 47 (21) | 1.5 (12.2) |
| Speech and language therapist | 7 (3) | 0.2 (1.6) |
| Physiotherapist | 13 (6) | 0.5 (2.9) |
| Chiropodist | 137 (62) | 1.1 (1.23) |
| Occupational therapist | 18 (8) | 1.0 (7.7) |
| Alternative therapist | 21 (9) | 2.4 (9.3) |
| Art/drama therapist | 12 (5) | 1.4 (6.6) |
| Social worker | 63 (28) | 0.8 (2.3) |
| Counsellor | 18 (8) | 1.0 (4.6) |
| Dentist | 90 (41) | 2.5 (4.9) |
| Dietician | 13 (6) | 0.5 (3.4) |
| Family support worker | 14 (6) | 1.8 (7.7) |
| Voluntary worker | 21 (9) | 1.7 (7.4) |
| Befriender | 17 (8) | 2.6 (21.1) |
| Meals on wheels | 7 (3) | 4.1 (29.8) |
| Total | 210 (95) | 28.1 (45.9) |
| Total hospital and community-based service costs | 215 (97) | 55.2 (107.2) |
| Daytime activities | ||
| Day centre | 104 (47) | 125.6 (156.2) |
| Social club | 8 (4) | 3.3 (21.7) |
| Respite care | 6 (3) | 5.9 (41.3) |
| Total costs per week | 108 (49) | 134.8 (168.2) |
| Cost of care provided by family and external providers per week | ||
| Care by family | ||
| Domiciliary | 14 (6) | 2.1 (12.9) |
| Personal care | 9 (4) | 1.3 (10.8) |
| Total | 16 (7) | 3.4 (23.1) |
| Care provided by external providers | ||
| Domiciliary | 14 (6) | 5.1 (19.9) |
| Personal care | 24 (11) | 6.1 (23.3) |
| Nursing care | 3 (1) | 2.4 (23.8) |
| Total | 36 (16) | 13.6 (45.7) |
| Total costs of care per week | 46 (21) | 17.0 (54.6) |
The total costs of care per week are given in Table 3. Accommodation costs constituted 74% of the total. Daytime activities and hospital and community healthcare accounted for most of the remainder. Overall, the average weekly cost in GBP (including accommodation) per older person with intellectual disability was £790, or £41 080 per year ($63 176 in USD or €53 548 in EUR using purchasing power parity at 2006).
Table 3 Total cost of care per week associated with mental health problems
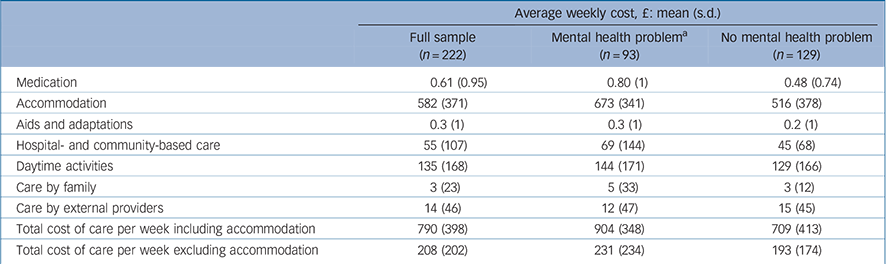
| Average weekly cost, £: mean (s.d.) | |||
|---|---|---|---|
| Full sample (n = 222) | Mental health problema (n = 93) | No mental health problem (n = 129) | |
| Medication | 0.61 (0.95) | 0.80 (1) | 0.48 (0.74) |
| Accommodation | 582 (371) | 673 (341) | 516 (378) |
| Aids and adaptations | 0.3 (1) | 0.3 (1) | 0.2 (1) |
| Hospital- and community-based care | 55 (107) | 69 (144) | 45 (68) |
| Daytime activities | 135 (168) | 144 (171) | 129 (166) |
| Care by family | 3 (23) | 5 (33) | 3 (12) |
| Care by external providers | 14 (46) | 12 (47) | 15 (45) |
| Total cost of care per week including accommodation | 790 (398) | 904 (348) | 709 (413) |
| Total cost of care per week excluding accommodation | 208 (202) | 231 (234) | 193 (174) |
The largest proportion of participants were living in residential accommodation (n = 85; 38%), followed by supported living schemes for adults with intellectual disability (n = 38; 17%), nursing homes (n = 30; 14%) and sheltered accommodation schemes (mostly schemes for older people, although some were similar schemes specifically for adults with intellectual disability) (n = 30; 14%). A small proportion of participants were living by themselves in council or privately owned flats, or with family members in private households. Overall costs (including accommodation) were highest for those living in congregate settings such as residential homes (£985 per week) and nursing homes (£910 per week). Most of these costs were for accommodation charges. Lowest costs were for those living in their own homes (£203 per week), sheltered accommodation (£576 per week), or private households (£648), but non-accommodation elements accounted for all of these costs. A comparison of the costs associated with mental health problems v. those without such problems showed that accommodation costs accounted for most of the cost difference (Table 3).
We examined demographic and clinical associations (age, gender, severity of intellectual disability, dementia, health problems, mobility problems, mental illness, hearing impairment and visual impairment) of total costs of care, first by using linear regression analysis. Variables that had a bivariate association at 0.5% with costs (gender, level of disability, whether a hearing assessment was done, presence of health problems, presence of a mental health problem) were initially included in the model. Age, ethnicity, residence, the presence of dementia, mobility problems and visual problems did not have a significant bivariate association with total costs in this sample of older adults with intellectual disability. The best-fitting model shown in Table 4 explained 21% of the observed variance in cost (R 2 = 0.21; adjusted R 2 = 0.19; F (5,193) = 4.04, P<0.001). In order of impact, clinical variables that were predictive of cost after adjustment for other explanatory variables included severity of intellectual disability (£201 per week for severe intellectual disability relative to mild intellectual disability), hearing impairment (£25 per week), presence of health problems (£164 per week for those with a health problem relative to those without) and presence of mental health problems (£202 per week for those with a mental health problem relative to those without).
Table 4 Predictors of total cost of care
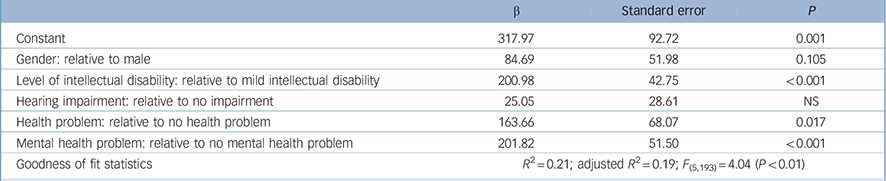
| β | Standard error | P | |
|---|---|---|---|
| Constant | 317.97 | 92.72 | 0.001 |
| Gender: relative to male | 84.69 | 51.98 | 0.105 |
| Level of intellectual disability: relative to mild intellectual disability | 200.98 | 42.75 | <0.001 |
| Hearing impairment: relative to no impairment | 25.05 | 28.61 | NS |
| Health problem: relative to no health problem | 163.66 | 68.07 | 0.017 |
| Mental health problem: relative to no mental health problem | 201.82 | 51.50 | <0.001 |
| Goodness of fit statistics | R 2 = 0.21; adjusted R 2 = 0.19; F (5, 193) = 4.04 (P<0.01) | ||
Discussion
To our knowledge this is the first detailed study of care costs and service usage of older adults with intellectual disability, including the costs associated with mental illness and dementia. Previous studies of the cost of UK care associated with intellectual disability of the de-institutionalisation process found that costs increased, although simultaneously the quality of life improved on average. Reference Beecham, Knapp, McGilloway, Donnelly, Kavanagh and Fenyo21–Reference Hallam, Beecham, Knapp, Carpenter, Cambridge and Forrester-Jones23 As most people lived in supported settings, accommodation accounted for three-quarters of the total costs, with overall costs being lower for those living independently who had, however, higher costs for non-accommodation elements. On average, hospital or other community services constituted a relatively minor cost component at £55 per week; however, a diagnosis of illness was linked to higher costs
Study limitations
We excluded older adults with Down syndrome, as their needs are better researched than those of people without this syndrome. Very few people with Down syndrome survive beyond the age of 60 years; our estimated costs should therefore be representative of the older intellectual disability population. Although we set out to identify all people with intellectual disability aged 60 years or more, it is possible that we missed individuals not known to intellectual disability services. However, such people are likely to have mild intellectual disability and are unlikely to be using many formal services, and therefore should incur relatively low intellectual disability-associated service costs. A further limitation is our reliance on informant reports and clinical records for information concerning physical and mental health status, rather than undertaking a detailed assessment of participants. Nevertheless, the rates of physical and mental illness in our study were similar to those found in previous studies such as that by Cooper et al. Reference Cooper, Smiley, Morrison, Williamson and Allan6 Although we made a detailed assessment of costs and service use, it is possible that some elements relevant to overall costs were not as accurate as we would have liked; for example, we used average costs in residential care settings, not the actual individual cost of care.
Cost of intellectual disability and ageing
We did not demonstrate a relationship between age and cost, possibly because the lifelong, complex disability associated with intellectual disability means that people have longstanding care needs and the additional problems of ageing do not add significantly to this. Furthermore, those with most severe intellectual disability tend to die younger, Reference Patja, Mölsä and Iivanainen24 so that those who are older might be relatively healthy. Reference Janicki, Davidson, Henderson, McCallion, Taets and Force25 In addition, there are several other possible contributors to costs that we have not accounted for, such as provider characteristics, Reference Matosevic, Knapp and Le Grand26 market structure, price-cost mark-up or subsidisation of charges, and the purchasing power of local authorities and local NHS commissioners. Reference Knapp, Hardy and Forder27 Costs for older people with mental health needs in the general population rise with age, probably owing to increasing physical disability; but it has been found that, if those above and below age 65 years are considered, the support costs in relation to need are lower for the older people. Reference Beecham, Knapp, Fernandez, Huxley, Mangalore and McCrone28 As in our study, higher costs and service use in younger people in care accommodation in England are associated with more severe intellectual disability and more challenging behaviour, Reference Knapp, Comas-Herrera, Astin, Beecham and Pendaries29 but vary widely according to models of accommodation, individual organisations, settings and service users. Direct comparison of specific accommodation types have shown that semi-independent living may offer cost and quality of life benefits compared with fully staffed homes. Reference Felce, Perry, Romeo, Robertson, Meek and Emerson30
Dementia and mental illness costs in older adults with intellectual disability
If dementia is included, psychiatric morbidity rates are raised in older, compared with younger, adults with intellectual disability. Reference Cooper31 Dementia did not predict higher costs in this study. In the general older adult population, dementia is the most expensive psychiatric disorder in older adults owing to high personal Social Services costs. Reference Nelson, Fernandez, Livingston, Knapp and Katona32 However, having dementia was a negative predictor of health service use, Reference Nelson, Fernandez, Livingston, Knapp and Katona32 and therefore not always associated with high healthcare costs. As with age, dementia may not lead to increased costs in the intellectual disability population as people are often already living in supported accommodation with personal Social Services and so do not use additional resources. Alternatively, they may have unmet needs because dementia is often undiagnosed and unmanaged. Reference Strydom, Livingston, King and Hassiotis7 Previous studies have found that mental illness, especially depression, significantly increases service costs in older adults in general. Reference Livingston, Manela and Katona4 Mental health problems occurred frequently in our sample of older adults with intellectual disability, and a diagnosis of mental illness was the most prominent clinical predictor of costs. However, there was a relative lack of healthcare, suggesting ample scope to improve healthcare without making major additional demands on overall costs, thus possibly leading to reduced needs for long-term care and care costs.
Comparison with personal Social Services budget in England
During 2006–7, £3.3 billion of the £20 billion (1 billion = 10 9 ) spent on personal Social Services in England was used to support adults aged under 65 years with intellectual disability. 33 Similarly, in The Netherlands, nearly 10% of the care budget is used for people with intellectual disability. Reference Polder, Meerding, Bonneux and van der Maas3 Older adults with intellectual disability make up only a small proportion of the older population (0.15–0.25%); Reference Emerson and Hatton34 using our figures, the cost of providing social care to them is between £595 million and nearly £1 billion, which is up to 5% of the total budget. Even small increases in the population of older adults with intellectual disability may therefore have considerable overall cost implications.
Implications
Older adults with intellectual disability are a growing population who consume a significant, disproportionate and increasing proportion of resources, although perhaps less than their morbidity levels would suggest is equitable according to need. Their frailty in old age may be underestimated, or subsumed into existing provision. We have demonstrated that mental illness, severity of disability and health problems are important predictors of costs; these characteristics should therefore be taken into consideration when planning resource allocation and service development at a local level. Services and funders should ensure equal access to care and support, regardless of age, and consider family carers. Nevertheless, there may also be opportunities to improve care without large increases in overall spend, which could result in cost reduction in the longer term, by early identification and management of mental illness or behavioural problems, which could lead to placement in less restrictive and less costly environments. This is in keeping with the principles of the UK government strategy for the care of adults with intellectual disability, 35,36 which emphasises the need to reduce costly placements (often out of area) by ensuring access to appropriate specialist support, local accommodation options, education and day opportunities.


eLetters
No eLetters have been published for this article.