


The frontal cortex is involved in the processing of a variety of cognitive and behavioural domains that are relevant to the pathophysiology of schizophrenia, including executive function, working memory, language production, attention, motivation and emotional processing. Reference Barch, Cannon and Mineka1 Studies that have partitioned the frontal cortex according to intrinsic sulcal/gyral anatomy have generally identified the inferior and/or middle frontal gyrus as regions of grey matter loss in individuals with schizophrenia Reference Goldstein, Goodman, Seidman, Kennedy, Makris and Lee2–Reference Suzuki, Zhou, Takahashi, Hagino, Kawasaki and Niu6 (but see Crespo-Facorro et al). Reference Crespo-Facorro, Kim, Andreasen, O'Leary and Magnotta7 Studies of the unaffected (non-psychotic) siblings of individuals with schizophrenia can help to determine whether such findings are due to genetic factors, since siblings share on average 50% of their genetic variants. Prior studies suggest that the relatives of individuals with schizophrenia exhibit abnormalities of overall frontal lobe volume Reference Lawrie, Whalley, Abukmeil, Kestelman, Donnelly and Miller8,Reference Cannon, van Erp, Huttunen, Lonnqvist, Salonen and Valanne9 (but see Staal et al). Reference Staal, Hulshoff Pol, Schnack, Hoogendoorn, Jellema and Kahn10 However, such studies have not addressed whether gross volume deficits were localised to particular frontal gyri or subregions, which is important because of the specific roles such regions play in cognition. In the present study, we examined the structure of three prefrontal cortical gyri using modern computational neuroanatomy in conjunction with manual gyral delineation in individuals with schizophrenia and their siblings, and in control individuals and their siblings.
Method
Participants
The participants included in this study were drawn from a population of individuals who volunteered for studies of brain structure and function at the Conte Center for the Neuroscience of Mental Disorders at Washington University School of Medicine in St Louis, USA). Participants consisted of pairs of individuals with DSM–IV 11 schizophrenia (schizophrenia group) and their unaffected siblings (schizophrenia-siblings group) (n = 26 pairs), and healthy controls (control group) and their siblings (control-siblings group) (n = 40 pairs) (Table 1). Siblings were full siblings, based on self-report. This cohort of individuals was substantially similar to that used in our previous reports on the thalamus and basal ganglia (122 participants in common) Reference Harms, Wang, Mamah, Barch, Thompson and Csernansky14,Reference Mamah, Harms, Wang, Barch, Thompson and Kim15 and cingulate gyrus (128 participants in common). Reference Calabrese, Wang, Harms, Ratnanather, Barch and Cloninger16 All participants gave written informed consent for participation following a complete description of the risks and benefits of the study.
Table 1 Profiles of the participants in the schizophrenia (SCZ), schizophrenia–siblings (SCZ–SIB), control (CON) and control–siblings (CON–SIB) groups.a

| Characteristics | SCZb n = 26 | SCZ-SIB n = 26 | CON-SIB n = 40 | CON n = 40 | P c |
|---|---|---|---|---|---|
| Age, years:d mean (s.d.) | 22.7 (3.0) | 22.3 (3.4) | 20.3 (3.6) | 21.2 (3.6) | 0.02 |
| Gender, n (%) | <0.001 | ||||
| Female | 4 (15.4) | 16 (61.5) | 28 (70.0) | 17 (42.5) | |
| Male | 22 (84.6) | 10 (38.5) | 12 (30.0) | 23 (57.5) | |
| Ethnicity, n (%) | 0.25 | ||||
| African American | 9 (34.6) | 9 (34.6) | 8 (20.0) | 8 (20.0) | |
| White | 17 (65.4) | 17 (65.4) | 32 (80.0) | 32 (80.0) | |
| Handedness,e n (%) | |||||
| Right | 22 (84.6) | 23 (88.5) | 37 (92.5) | 34 (85.0) | 0.75 |
| Left | 4 (15.4) | 3 (11.5) | 3 (7.5) | 6 (15.0) | |
| Parental SES,f mean (s.d.) | 3.1 (1.2) | 3.0 (1.1) | 3.1 (0.9) | 2.9 (0.9) | 0.82 |
| Crystallised IQ,g least square mean (s.e) [% difference relative to the SCZ-SIB value] | 9.0 (0.81) [-14.3] | 10.5 (0.65) | 11.9 (0.53) [13.3] | 11.7 (0.49) [11.4] | 0.03 |
| Non-PFC cortical GM volume,h cm3: least square mean (s.e) [% difference relative to the SCZ-SIB value] | 349 (8.9) [-3.6] | 362 (5.9) | 390 (6.0) [7.7] | 381 (6.3) [5.3] | 0.006 |
| Non-PFC white matter surface area,i cm2: least square mean (s.e) [% difference relative to the SCZ-SIB value] | 1348 (31.7) [-3.7] | 1399 (24.8) | 1485 (22.3) [6.2] | 1464 (19.9) [4.7] | 0.02 |
| Mean cortical thickness,j mm: least square mean (s.e) [% difference relative to the SCZ-SIB value] | 2.43 (0.016) [-0.8] | 2.45 (0.013) | 2.49 (0.013) [1.6] | 2.47 (0.013) [0.8] | 0.04 |
Individuals in the schizophrenia group met DSM–IV criteria for schizophrenia and were all out-patients at the time of study. The control group had no lifetime history of any DSM–IV psychotic or major mood disorder (i.e. major depressive disorder and bipolar disorder) and no first-degree relatives with a psychotic disorder. Potential schizophrenia-siblings group participants were excluded if they had a lifetime history of any DSM–IV psychotic disorder, but not other DSM–IV Axis I disorders. Individuals in the control-siblings group met the same inclusion/exclusion criteria as the schizophrenia-siblings group (other than the requirement of having a sibling with schizophrenia) and were included to control for possible effects arising from the impact of psychiatric disorders other than schizophrenia. The schizophrenia-siblings group and control-siblings group had similar lifetime histories of DSM–IV defined substance dependence (23% and 8% respectively, P = 0.1, Fisher's exact test), mood disorder (50% and 35%, P = 0.3) and anxiety disorder (23% and 15%, P = 0.5). The schizophrenia group were treated with antipsychotic medications (primarily atypicals), and had been clinically stable for at least 2 weeks prior to their participation. People in any group were excluded if they met DSM–IV criteria for substance abuse or dependence within the 3 months preceding assessment. Further details of participant recruitment, assessment, antipsychotic medication and lifetime comorbidities are available elsewhere. Reference Harms, Wang, Mamah, Barch, Thompson and Csernansky14,Reference Mamah, Harms, Wang, Barch, Thompson and Kim15
Clinical and cognitive assessments
Psychopathology and cognitive function were assessed as previously described Reference Harms, Wang, Mamah, Barch, Thompson and Csernansky14,Reference Delawalla, Barch, Fisher Eastep, Thomason, Hanewinkel and Thompson17 using a battery of clinical and neuropsychological tests that were z-scored (against a centre-wide sample) and subsequently averaged within domains to yield summary scores on three domains of clinical symptoms – positive symptoms, negative symptoms, and thought disorganisation – and four broad cognitive domains – working memory, episodic memory, executive function and attention. The mean scores of these domains by participant group were nearly identical to those reported previously. Reference Harms, Wang, Mamah, Barch, Thompson and Csernansky14
Image collection and preparation
Magnetic resonance scans were collected using a Siemens Magnetom Vision 1.5 T imaging system using a standard head coil. The magnetic resonance scanning protocol included the collection of multiple (2–4) high-resolution, three-dimensional T 1-weighted MPRAGE volumes: voxel size 1 × 1 × 1.25 mm3, repetition time (TR) 1765 ms, inversion time (TI) 640 ms3, echo time (TE) 4.0 ms, flip angle 10°, and scan time 6.5 min per acquisition. All MPRAGE scans for each individual were aligned and averaged to create a low-noise image volume, which was then tri-linearly interpolated into 0.5 × 0.5 × 0.5 mm3 isotropic voxels to produce smoother intensity histograms for more accurate segmentation. A region of interest containing frontal cortex was defined in the preprocessed image volume, and non-brain tissue (e.g. skull and dura) manually removed. Gaussian mixture modelling was used to segment this region into grey matter, white matter and cerebrospinal fluid, typically using three Gaussians to model each tissue class. The validity of this approach to tissue segmentation of prefrontal cortex has been previously established. Reference Lee, Priebe, Miller and Ratnanather18 A topologically correct surface (i.e. no ‘holes’ or ‘handles’ in the surface mesh) was then generated at the white/grey matter interface. Reference Han, Xu, Braga-Neto and Prince19 References to simply ‘surface’ or ‘surface area’ refer to the white/grey matter interface.
Delineation of prefrontal subregions
Four raters, masked to the group status of the participants, used dynamic programming Reference Khaneja, Grenander and Miller20 to manually delineate the sulcal boundaries of the superior, middle and inferior frontal gyri on the frontal white matter surface using a set of detailed anatomical rules Reference John, Wang, Moffitt, Singh, Gado and Csernansky21 (Fig. 1, see online Fig. DS1 for a colour version of this figure). There was a high degree of both inter- and intrarater consistency in the delineation of these boundaries, with the average surface overlap exceeding 94% for both inter- and intrarater comparisons (see online supplement for details).

Fig. 1 Examples of the parcellated white matter surface of the prefrontal cortex in two participants.
In general, the boundaries for the superior, middle and inferior frontal gyri followed the depth of prominent sulci, except when necessary to cross over the crown of a gyrus to bridge an interrupted sulcus. The posterio-lateral border for all three regions was the precentral sulcus (PCS), using the most posterior sulcus in cases of a forked termination or parallel sulci. The posterio-medial limit of the superior frontal gyrus was the paracentral sulcus (PaCS), which typically is an extension of the superior precentral sulcus and/or a branch of the cingulate sulcus. The inferio-medial border of the superior frontal gyrus was the cingulate sulcus (CiS), so that the more superior paracingulate sulcus was considered part of the superior frontal gyrus if present. Reference Fornito, Wood, Whittle, Fuller, Adamson and Saling22 The anterio-inferio-medial border of the superior frontal gyrus was the superior rostral sulcus (SRS) whose posterior aspect was extended to intersect the cingulate sulcus if necessary to complete the inferio-medial boundary of the superior frontal gyrus. Anterio-laterally, there is no consistent sulcal boundary to delimit prefrontal cortex from the cytoarchitectonically distinct frontal pole. Therefore, a frontal pole plane (dashed line) was defined as the coronal section (in an anterior/posterior-commissure oriented brain) passing through the anterior termination of the olfactory sulcus. Reference John, Wang, Moffitt, Singh, Gado and Csernansky21 This frontal pole plane defined the anterior limit of the superior and middle frontal gyrus (regardless of any naturally occurring sulci that infrequently might be present). Frequently the superior rostral sulcus does not extend to the frontal pole plane and in these cases the anterio-medial boundary of the superior frontal gyrus was completed by connecting the frontal pole plane to the superior rostral sulcus (along the superior edge where the surface transitions from the medial bank to the lateral convexity). Laterally, the superior frontal sulcus (SFS) and inferior frontal sulcus (IFS) defined the boundary between the superior/middle frontal gyri and middle/inferior frontal gyri respectively. The superior frontal sulcus nearly always intersects the frontal pole plane, but the inferior frontal sulcus typically had to be extended to the frontal pole plane to complete the anterio-inferior border of the middle frontal gyrus. The inferior and anterior border of the inferior frontal gyrus, moving from posterior to anterior, progressed from (a) the circular sulcus in the operculum to (b) the sulcus immediately ventral to the horizontal ramus (HR) of the lateral fissure to (c) the most prominent dorsally-progressing sulcus immediately anterior to the anterior termination of the horizontal ramus to (d) the inferior frontal sulcus. Connections between these sulci were bridged when necessary. Using the nomenclature of other authors, the sulci from stages (b)–(c) of this progression would represent the lateral frontomarginal and/or radiate sulcus of Petrides & Pandya Reference Petrides, Pandya, Paxinos and Mai23 or one of the variants of the fronto-orbital sulcus of Ono et al. Reference Ono, Kubik and Abernathey24 By this definition, the inferior frontal gyrus included a small portion of pars orbitalis immediately ventral to the horizontal ramus, but consisted primarily of pars opercularis and pars triangularis, similar to Buchanan et al. Reference Buchanan, Vladar, Barta and Pearlson3 (see online Fig. DS1 for a colour version of this figure.)
Prefrontal measures
The volume and thickness of each prefrontal subregion was calculated from labelled cortical distance maps. Reference Miller, Hosakere, Barker, Priebe, Lee and Ratnanather25,Reference Wang, Hosakere, Trein, Miller, Ratnanather and Barch26 Grey matter volume was determined as the volume represented by the grey matter-labelled voxels in the tissue-segmented volume for which the closest vertex on the overall frontal white matter surface was part of the delineated subsurface of interest (i.e. superior, middle or inferior frontal gyrus). The distance between each grey matter voxel and its associated subsurface was also computed to yield a thickness histogram, and the ninetieth percentile was chosen to represent cortical thickness. The area of each delineated subsurface was calculated from the triangulated graph of the white matter surface.
Anatomical covariates
To control for ‘global’ brain differences between groups, covariates were derived using FreeSurfer (version 3.0.4; http://surfer.nmr.mgh.harvard.edu), a software package for segmentation and cortical surface reconstruction. Reference Dale, Fischl and Sereno27,Reference Fischl, Sereno and Dale28 Separate covariates were derived for volume, area and thickness analyses to match the variable being analysed. Specifically, covariates for volume and area analyses were defined as FreeSurfer's estimate of total cortical grey matter volume or white matter surface area (summed across left and right hemispheres) respectively, minus total labelled cortical distance maps-derived volume or area summed across the superior, middle and inferior frontal gyri. This subtraction was done because the superior, middle and inferior frontal gyrus regions together constitute an appreciable portion of the total brain and thus including those regions in a covariate for brain size could remove variance specifically associated with the prefrontal cortex itself. An analogous calculation was not possible for thickness (since thickness is an ‘average’ rather than a summed measure); therefore, the covariate for thickness analyses was the FreeSurfer estimate of average thickness across the entire cortical grey matter. Thus, our analyses of thickness in the prefrontal cortex may be biased somewhat towards a negative result since the prefrontal cortex itself was included in the computation of the thickness covariate.
Statistical analysis
Group differences in volume, thickness, and area of the prefrontal cortex were assessed using mixed-models that estimated the covariance (correlation) in the residuals due to the sibling relationships as well as hemisphere (using PROC MIXED of SAS 9.1, SAS Institute Inc, Cary, North Carolina, USA). Group, hemisphere, group × hemisphere, gender and age were fixed-effect predictors, and a covariate for ‘global’ brain variation was also included (matched to the corresponding type of dependent variable; see above). IQ was not included as a covariate, since decreased cognitive performance is itself a feature of schizophrenia. Results for area and thickness are presented for each gyral region regardless of whether the volume differed across groups, since area and thickness have unique genetic influences. Reference Panizzon, Fennema-Notestine, Eyler, Jernigan, Prom-Wormley and Neale29 However, to partially control for multiple comparisons, we required the main effect of group to satisfy P≤0.01 for any of the three morphometric measures to be considered significant, after which pair-wise comparisons (two-tailed) between groups were examined. For the measures with a main effect of group, correlations with the psychopathology and neurocognitive scores were assessed in the schizophrenia group and schizophrenia-siblings group (separately) using non-parametric Spearman's correlations, partialling out ‘global’ brain variation, with P≤0.01 again used as the threshold to partially control for multiple correlations.
Results
Prefrontal cortex volume
There was a significant effect of group on grey matter volume of the middle and inferior, but not the superior frontal gyrus. The group effect for middle frontal gyrus volume was because of a reduced volume in the schizophrenia group (10–11%, Table 2 and Fig. 2) relative to the schizophrenia-siblings group and both the control groups (all P<0.02). In contrast, the group effect for inferior frontal gyrus volume was a result of reduced volume in both the schizophrenia group and schizophrenia-siblings group, with the volume of the latter falling intermediate between the schizophrenia group and the two control groups – 11% greater than the schizophrenia group (P = 0.06), but 7–10% less than the control-siblings group and the control group (P = 0.06 in a contrast of the schizophrenia-siblings group against the average of the two control groups). There was no effect of hemisphere (P>0.24), or group × hemisphere interaction (P>0.10) on volume of any of the three prefrontal cortex regions.
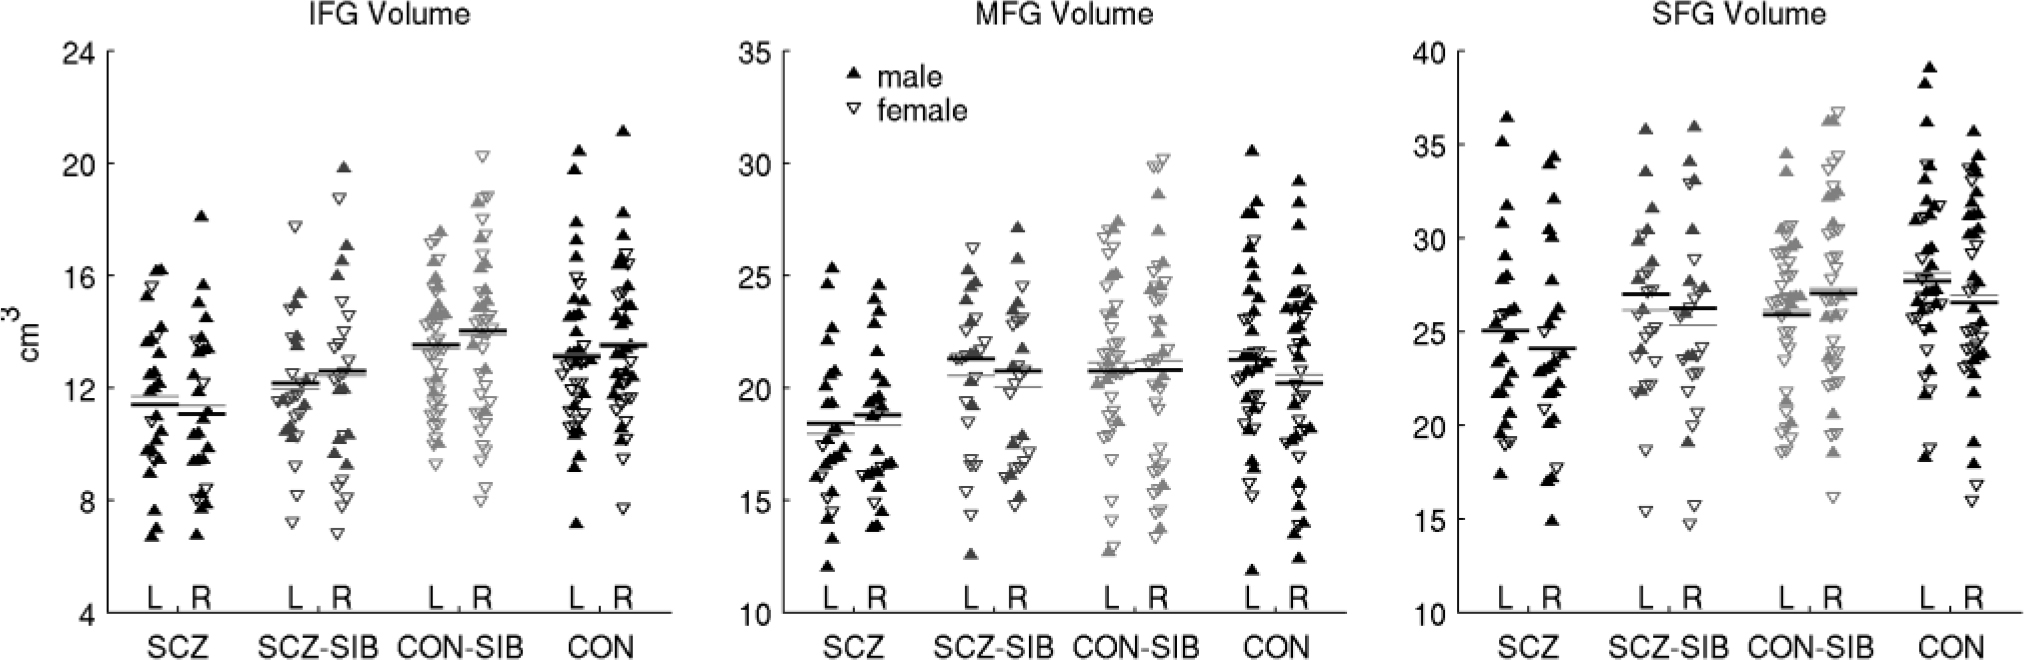
Fig. 2 Plots of raw inferior (IFG), middle (MFG) and superior frontal gyri (SFG) volumes separated by participant group and hemisphere.
Filled triangles are males; open triangles are females. Black horizontal lines indicate the predicted marginal means (‘least square means’) from the full statistical model, which included gender, age and non-prefrontal cortical grey matter volume as covariates. Thin grey lines indicate the mean of the raw values. L, left; R, right; SCZ, schizophrenia group; SCZ-SIB, schizophrenia-siblings group; CON, control group; CON-SIB, control-siblings group.
Table 2 Adjusted superior, middle and inferior frontal gyri measuresa

| Region | SCZ, least square mean (s.e) [% difference relative to the SCZ-SIB value] | SCZ-SIB, least square mean (s.e) | CON-SIB, least square mean (s.e) [% difference relative to the SCZ-SIB value] | CON, least square mean (s.e) [% difference relative to the SCZ-SIB value] | F | P |
|---|---|---|---|---|---|---|
| Superior frontal gyrus | ||||||
| Volume | 24.6 (0.86) [-7.5] | 26.6 (0.92) | 26.5 (0.66) [-0.4] | 27.1 (0.58) [1.9] | 2.0 | 0.13 |
| Area | 61.9 (1.98) [-2.8] | 63.7 (2.04) | 61.3 (1.50) [-3.8] | 63.5 (1.41) [-0.3] | 0.6 | 0.64 |
| Thickness | 3.58 (0.054) [-4.5] | 3.75 (0.060) | 3.77 (0.054) [0.5] | 3.77 (0.051) [0.5] | 2.5 | 0.06 |
| Middle frontal gyrus | ||||||
| Volumeb | 18.6 (0.56) [-11.4] | 21.0 (0.56) | 20.7 (0.58) [-1.4] | 20.7 (0.53) [-1.4] | 3.8 | 0.01 |
| Area | 51.5 (1.17) [-6.9] | 55.3 (1.24) | 53.3 (1.24) [-3.6] | 53.5 (1.15) [-3.3] | 1.8 | 0.16 |
| Thickness | 3.18 (0.052) [-3.6] | 3.30 (0.047) | 3.29 (0.046) [-0.3] | 3.29 (0.041) [-0.3] | 1.2 | 0.32 |
| Inferior frontal gyrus | ||||||
| Volumec | 11.2 (0.51) [-9.7] | 12.4 (0.52) | 13.8 (0.38) [11.3] | 13.3 (0.37) [7.3] | 4.7 | 0.005 |
| Area | 29.8 (1.08) [-4.8] | 31.3 (1.04) | 33.2 (0.78) [6.1] | 32.3 (0.77) [3.2] | 1.9 | 0.14 |
| Thickness | 3.39 (0.073) [-4.0] | 3.53 (0.064) | 3.63 (0.060) [2.8] | 3.62 (0.060) [2.5] | 2.3 | 0.08 |
We conducted a males-only analysis to examine whether the results for inferior and middle frontal gyrus volume might have been confounded because of gender differences across groups. The results of this analysis were consistent with the full cohort of participants; i.e. the main effect of group on grey matter volume remained significant in inferior frontal gyrus (F(3,24) = 5.7, P = 0.004) and trended towards significant in middle frontal gyrus (F(3,33) = 2.5, P = 0.08; see online supplement).
Prefrontal cortex area and thickness
The effect of group was not significant for either surface area or cortical thickness of any of the three regions. There was no group × hemisphere interaction for either measure for any of the three prefrontal cortex regions (P = 0.07 for area of superior frontal gyrus, otherwise P>0.23), and no main effect of hemisphere on area of any region (P>0.3). There was a strong main effect of hemisphere on thickness in all three regions (F>44, P<0.0001), with the direction of this asymmetry differing across the regions (left>right in superior frontal gyrus, right>left in middle and inferior frontal gyri).
Examination of the correlation between thickness and area, computed across all participants, indicated that these two measures yielded largely independent information regarding prefrontal morphometry (Spearman's r<0.2, for both hemispheres in all three regions). Nonetheless, at the level of the group averages, the patterns of both area and thickness values across groups were qualitatively similar to the volume differences across groups within the middle and inferior frontal gyri (i.e. smallest in the schizophrenia group; intermediate in the schizophrenia-siblings group for inferior frontal gyrus). However, only the volume measure, which is conceptually the product of area and thickness, detected statistically significant group differences in this study.
Covariates
The main effect of group on middle and inferior frontal gyrus volume remained significant when dichotomous covariates for lifetime history of substance dependence, mood disorders and anxiety disorders were included in the mixed model (middle frontal gyrus: F(3,67) = 4.1, P = 0.01; inferior frontal gyrus: F(3,64) = 3.9, P = 0.01). Furthermore, each of these covariates themselves had a non-significant influence on middle and inferior frontal gyrus volume (P>0.1 for all). These results, along with the similar aggregate lifetime histories of the schizophrenia-siblings group and control-siblings group on these variables, suggest that the inferior frontal gyrus deficit in the schizophrenia-siblings group cannot be simply attributed to the presence of non-psychotic Axis I disorders.
The groups differed on the three measures used as covariates to control for overall brain changes (at P<0.05, rather than P<0.01, for two of the measures; Table 1). Mixed model analyses of the prefrontal cortex measures without their associated brain covariate indicated at least trend-level evidence for group differences (P<0.1 for main effect of group) for all measures and regions except for area of the superior frontal gyrus, indicating that superior, middle and inferior frontal gyrus morphometry was broadly altered in these individuals, even if a portion of these differences reflected changes proportional to overall brain differences rather than regional changes.
Relationships of structural measures with psychopathology and neurocognition
The correlation of middle and inferior frontal gyrus volume (summed across left and right hemispheres) with duration of illness, crystallised IQ, the three domain scores of psychopathology and four neurocognition scores was separately assessed in the schizophrenia group and schizophrenia-siblings group. Correlations were controlled for non-prefrontal cortical grey matter volume. Duration of illness in the schizophrenia group was not correlated with volume of the middle or inferior frontal gyri (P>0.2). The only significant correlations (P≤0.01) were between middle frontal gyrus volume and disorganised symptoms in the schizophrenia-siblings group (Spearman's r = −0.51, P = 0.01) and between inferior frontal gyrus volume and negative symptoms in the schizophrenia group (r = −0.58, P = 0.003).
Discussion
Our results are consistent with regional abnormalities in the structure of the prefrontal cortex of individuals with schizophrenia and their siblings. Grey matter volume was reduced in both the middle and inferior frontal gyri in individuals with schizophrenia, relative to those in both control groups. However, only in the inferior frontal gyrus was the grey matter volume in the schizophrenia-siblings group also reduced, resulting in a volume intermediate between the schizophrenia group and both control groups. These group effects were demonstrated while controlling for ‘global’ brain changes in non-prefrontal cortical grey matter volume, which itself differed between groups.
Structural phenotypes for schizophrenia risk
Of the structural measures investigated in this study, grey matter volume of the inferior frontal gyrus was most clearly related to familial risk for schizophrenia. Additive genetic factors represent a likely source for the presence of inferior frontal gyrus deficits in both the affected and unaffected siblings, thus implicating inferior frontal gyrus volume as a potential endophenotype for schizophrenia. Reference Gottesman and Gould31 Although shared environmental factors (e.g. similar intrauterine factors) cannot be excluded as a source of these inferior frontal gyrus deficits, twin and adoption studies indicate that shared environmental factors have a negligible contribution to the manifestation of schizophrenia itself. Reference Cannon, Kaprio, Lonnqvist, Huttunen and Koskenvuo32,Reference Cardno, Marshall, Coid, Macdonald, Ribchester and Davies33 Middle frontal gyrus volume deficits were only observed in the schizophrenia group, which suggests that changes in middle frontal gyrus structure are related to the presence of disease rather than familial risk.
We are not aware of other studies that employed manual frontal parcellation (of either a magnetic resonance imaging volume or a sulcal/gyral surface model) to investigate the localisation of prefrontal cortical changes in the relatives of individuals with schizophrenia. However, regional brain morphometry in such unaffected family members has been investigated using automated whole-brain analysis tools. In one large cohort of individuals, assessed using both voxel-based morphometry and FreeSurfer, there was no evidence for decreased grey matter volume or thickness in the lateral frontal gyri of siblings without psychosis compared with healthy controls, even at exploratory thresholds. Reference Goldman, Pezawas, Mattay, Fischl, Verchinski and Chen34,Reference Honea, Meyer-Lindenberg, Hobbs, Pezawas, Mattay and Egan35 Similar null results in the lateral prefrontal cortex of relatives have been reported by others. Reference Job, Whalley, McConnell, Glabus, Johnstone and Lawrie36–Reference Fan, Gur, Gur, Wu, Shen and Calkins38 However, still other family studies have reported associations between genetic liability to schizophrenia and reduced grey matter in middle and inferior frontal gyri. Reference McIntosh, Job, Moorhead, Harrison, Whalley and Johnstone39–Reference Cannon, Thompson, van Erp, Toga, Poutanen and Huttunen41 Our results support a relationship between genetic risk and grey matter volume in the inferior, but not middle frontal gyrus. The discrepant results across studies could be a result of either variation in analysis methods or true cohort differences.
Prefrontal structural deficits in individuals with schizophrenia
At least six previous in vivo neuroimaging studies of individuals with schizophrenia have partitioned the prefrontal cortex into the superior, middle and inferior frontal gyri. Reference Goldstein, Goodman, Seidman, Kennedy, Makris and Lee2–Reference Crespo-Facorro, Kim, Andreasen, O'Leary and Magnotta7 Four of these six studies found evidence for deficits in inferior frontal gyrus volume in the individuals with schizophrenia, whereas two found evidence for middle frontal gyrus deficits, and only one found evidence for superior frontal gyrus deficits. Notably, voxel-based morphometry studies also report deficits more frequently in inferior than middle frontal gyri in individuals with schizophrenia compared with controls. Reference Honea, Crow, Passingham and Mackay42 Other automated whole-brain analyses provide further support for the existence of deficits in the inferior frontal gyrus, with comparatively spared middle frontal gyrus. Reference Davatzikos, Shen, Gur, Wu, Liu and Fan43–Reference Venkatasubramanian, Jayakumar, Gangadhar and Keshavan45 This suggests that grey matter reduction in lateral prefrontal cortex in schizophrenia is most prominent in the inferior frontal gyrus, and progressively less so in the middle and superior frontal gyri, a conclusion consistent with the present study.
Relationships with psychopathology and neurocognition
The observed correlation between smaller inferior frontal gyrus volumes and increased negative symptoms in the schizophrenia group is consistent with literature linking inferior frontal cortex to language function, motivation and goal-directed action generation. Reference Hagoort46–Reference Hamilton and Grafton49 Although the siblings of individuals with schizophrenia also exhibit increased negative symptoms, Reference Delawalla, Barch, Fisher Eastep, Thomason, Hanewinkel and Thompson17 a correlation between inferior frontal gyrus volume and negative symptoms was not evident in the schizophrenia-siblings group, suggesting that disease-specific factors could be driving this association in the affected siblings. Given the role of subregions of the middle frontal gyrus (i.e. Brodmann's area 46) in executive control and working memory, we had also hypothesised, but did not find, a correlation of middle frontal gyrus volume with either of these cognitive domains in the schizophrenia group (see Zuffante et al for a similar result). Reference Zuffante, Leonard, Kuldau, Bauer, Doty and Bilder50 Overall, more studies are necessary before firm conclusions can be drawn regarding the correlation (or lack thereof) of cognitive and clinical variables with structural measures at the level of sublobular (e.g. gyral) partitions.
Limitations
The sample size of this study was large enough to detect significant main effects of group for inferior and middle frontal gyrus volume (representing pair-wise group differences of 10–20%), but likely too small to reliably detect (e.g. with 80% power) differences on the order of 5–10% between groups. Reference Steen, Hamer and Lieberman51 Notably, however, there was not even trend-level evidence for either superior or middle frontal gyrus volume as an intermediate phenotype in the unaffected siblings since the volume of both gyri in the schizophrenia-siblings group was very similar to the controls. Formally testing the heritability of inferior frontal gyrus volume (i.e. ‘familiality’ in the context of our sibling study design) Reference Kendler and Neale52 could strengthen the case for inferior frontal gyrus volume as a potential endophenotype of genetic risk for schizophrenia. Also, the groups differed in their gender distribution, although gender was included as a covariate and a males-only analysis supported the results obtained using all participants.
The effects of antipsychotic medication on cortical tissue are a potential confound in interpreting studies of brain changes in schizophrenia. In one study involving monkeys, chronic exposure to either haloperidol or olanzapine reduced the weight of the frontal cortex compared with sham-treated monkeys. Reference Dorph-Petersen, Pierri, Perel, Sun, Sampson and Lewis53 However, available in vivo imaging data in humans suggests that people with first-episode schizophrenia taking atypical antipsychotics are less likely to exhibit frontal grey matter deficits relative to controls than people on typical antipsychotics. Reference Dazzan, Morgan, Orr, Hutchinson, Chitnis and Suckling54,Reference Lieberman, Tollefson, Charles, Zipursky, Sharma and Kahn55 It remains unknown whether this differential reflects a positive therapeutic effect of atypical antipsychotics or a possible neurotoxic effect of typical agents. Regardless, since atypical antipsychotics were the predominant medication of our schizophrenia group, the implication of these medication studies in humans is that the deficits observed in this group were if anything attenuated relative to a hypothetical sample of similarly aged but non-medicated individuals. Furthermore, our finding of decreased inferior frontal gyrus volume in the unaffected siblings cannot be attributed to medication effects since they had never been medicated.
In the current study, we partitioned prefrontal cortex by delineating gyral regions directly on a model of the white matter surface, which was helpful in visualising the variable folding patterns of prefrontal cortex. The manual nature of this gyral delineation was time consuming and might have introduced additional variability compared with more automated approaches. However, we demonstrated a high degree of both inter- and intrarater consistency in the delineation of the gyral boundaries, and studies using manual definition of regions of interest are still considered the ‘gold-standard’ by many investigators. Studies directly comparing the results of different analysis approaches on a common data-set are necessary in order to better understand the extent to which methodological differences may influence group comparisons.
Previously, we have reported on the structure of the thalamus, Reference Harms, Wang, Mamah, Barch, Thompson and Csernansky14 caudate, putamen and globus pallidus, Reference Mamah, Harms, Wang, Barch, Thompson and Kim15 and anterior and posterior cingulate gyrus Reference Calabrese, Wang, Harms, Ratnanather, Barch and Cloninger16 in largely overlapping cohorts of individuals, using analysis approaches specifically designed and validated for these structures. None of these previously examined structures exhibited a statistically significant effect of group on regional volumes after controlling for brain volume. Although the multiple structures raise a potential multiple comparisons issue, we note that we used a more stringent threshold (P≤0.01) for the group effect in the present study. Furthermore, the structures investigated in this study have already been implicated in other studies as potentially involved in the pathophysiology of schizophrenia, which partially ameliorates the multiple comparison problem. To further understand the regional specificity of our findings for inferior and middle frontal gyri, whole brain cortical mapping Reference Cannon, Thompson, van Erp, Toga, Poutanen and Huttunen41,Reference Kuperberg, Broome, McGuire, David, Eddy and Ozawa44 would permit localisation of the most prominent deficits across the whole cortex, and thus would be a useful complimentary analysis of the current cohort.
Funding
This work was supported by the National Institute of Mental Health (NIMH) (MH071616, MH056584) and the National Center for Research Resources (RR015241).
Acknowledgements
We thank the staff of the Administration/Assessment Core of the CCNMD at Washington University School of Medicine for collection of the clinical and imaging data, and the Biostatistical Core, directed by Paul A. Thompson and Xuan Huang, for data management and statistical consultation.


eLetters
No eLetters have been published for this article.