


Patients with severe depression exhibit marked neuropsychological impairment, Reference Porter, Gallagher, Thompson and Young1–Reference Elliott, Sahakian, McKay, Herrod, Robbins and Paykel3 some aspects of which may improve significantly with successful treatment. Reference Douglas and Porter4 In-patients with depression treated with antidepressant medication have shown early improvement (within 10 days) in observer-rated, but not systematically measured, neuropsychological functioning, and this predicted eventual response to treatment. Reference Katz, Koslow, Maas, Frazer, Bowden and Casper5 In addition, early (3–13 days) behavioural changes in response to antidepressant medication have been found to predict later clinical improvement in major depression. Reference Katz, Tekell, Bowden, Brannan, Houston and Berman6 Measures of facial emotion processing have also been proposed to be potentially useful objective indicators of treatment response in major depression. Reference Venn, Watson, Gallagher and Young7 Taken together, these studies suggest that measures of change in neuropsychological function and facial emotion processing may be a useful part of the assessment of clinical change, both early and later in the treatment of major depression.
The aim of this study was to investigate whether neuropsychological changes (on conventional neuropsychological tasks and facial emotion processing tasks) could represent early (10–14 days) and later (6 weeks) indicators of treatment response in in-patients with major depression. No previous published studies have examined neuropsychological changes in relation to treatment response at such an early stage of treatment.
Method
Participants
Consecutively admitted in-patients, aged between 18 and 60 years, with a DSM–IV 8 diagnosis of major depressive episode (unipolar or bipolar), were recruited from the Acute Inpatient Unit at Hillmorton Hospital (Christchurch, New Zealand). Reasons for exclusion were current serious alcohol misuse or dependence, comorbid endocrinological, neurological or chronic medical conditions, pregnancy, previous serious head injury, electroconvulsive therapy (ECT) in the past 12 months, or taking medications likely to interfere with neuropsychological functioning such as β-blockers or steroids. Severity of depression was measured using the Montgomery–Åsberg Depression Rating Scale (MADRS). Reference Montgomery and Åsberg9 The Structured Clinical Interview for DSM–IV Axis I Disorders (SCID–I) Reference First, Spitzer, Gibbon and Williams10 was used to assess the presence of all psychiatric conditions. Patients were treated as deemed appropriate by the treating psychiatrists.
The control group consisted of psychologically healthy individuals without a personal history, or a history in a first-degree relative, of major mental illness, including major depression. Personal current or past psychiatric conditions were screened using the Mini International Neuropsychiatric Interview (MINI). Reference Sheehan, Lecrubier, Sheehan, Amorim, Janavs and Weiller11 Controls were excluded from the study for the same reasons as patients with depression.
The depression and control groups were matched for age, gender, premorbid IQ (National Adult Reading Test, NART) Reference Nelson12 and years of education. Females were matched for phase of menstrual cycle. All participants were fluent in English.
Study design
Neuropsychological measures were administered three times over 6 weeks: at baseline (for patients, within 5 days of admission), 10–14 days after baseline (T 1) and 6 weeks after baseline (T 2). All testing sessions took place between 11.00 h and 15.00 h, and were approximately 80 min in duration. The MADRS (depression group only) was conducted by the primary investigator (K.M.D.), who was trained by a consultant psychiatrist (R.J.P.). The study was approved by the National Health and Disability Ethics Committee and all participants gave informed written consent.
Neuropsychological assessment
The neuropsychological testing battery was designed to test a wide range of neuropsychological functions, but was kept suitable for use in patients with very severe depression. Where patients were too unwell to perform the full testing battery, a shortened version was administered, thus there were missing data for some tasks. Pen-and-paper tasks were administered according to standardised instructions Reference Lezak, Howieson and Loring13 and computerised tasks according to the corresponding manual protocols (SuperLab Pro (www.cedrus.com) and CogState (www.cogstate.com)) on a PC laptop. Neuropsychological tasks were administered in a fixed sequence. These tasks are described below.
Verbal learning and memory
Rey Auditory–Verbal Learning Task (RAVLT). The RAVLT Reference Rey14 word lists (List A and Distracter List) were reduced from 15 to 12 words, to accommodate the severity of depression. As performance on the final two recall trials of List A depends on how well the words are learned initially, post-distracter scores were transformed as a percentage of the average number of words recalled on the first five trials.
Visuospatial learning and memory
Groton Maze Learning Test (GMLT). On a computer screen, participants navigated through a 28-step hidden pathway, within a 10-by-10 grid of squares. The process was repeated for three successive learning trials and one delayed trial after 20 min. On each trial, the number of errors was recorded. As the number of errors on the delay trial depends on how well the maze is learned initially, the delay score was transformed as a percentage of the average number of errors made on the first four learning trials (for detailed description of GMLT, see Snyder et al). Reference Snyder, Jackson, Piskulic, Olver, Norman and Maruff15
Attention and executive functioning
Stroop Task. The Stroop Task Reference Stroop16 is a measure of inhibition. Participants’ accuracy and reaction time (RT) when naming the colour of squares, neutral words and colour words were recorded.
Controlled Oral Word Association Test (COWAT). This measure of verbal fluency was administered at the first two neuropsychological assessments using the letters C-F-L and P-R-W. Reference Benton and Hamsher17 The number of words generated for each letter, in 90 s, was recorded and summed for the three letters.
Psychomotor speed
Simple Reaction Time Task (Simple RT Task). Participants were presented with numbers (1–6) and words (angry, happy, sad, neutral, fearful and disgusted) on the computer screen, and required to press a corresponding key as quickly and accurately as possible. Accuracy and response times were recorded.
Timed Chase Test. Participants chased a moving tile around a grid of squares on the computer screen for 30 s (see Snyder et al). Reference Snyder, Jackson, Piskulic, Olver, Norman and Maruff15 The number of correct moves made was recorded.
Facial emotion processing
Facial Expression Recognition Task. Participants were presented with individual faces displaying varying intensities (50% to 100% full emotion) of five basic emotions (angry, happy, sad, fearful and disgusted), and neutral expressions. Reference Harmer, Bhagwagar, Perrett, Vollm, Cowen and Goodwin18 Recognition accuracy, reaction time and neutral misinterpretation bias (the percentage of neutral expressions misclassified as an emotion) were recorded (for a more detailed description, see Douglas & Porter). Reference Douglas and Porter19
Statistical analysis
Statistical analyses were conducted using SPSS for Windows, version 13.0. Demographic and baseline neuropsychological data were assessed using chi-squared tests or analysis of variance (ANOVA), with group (depression or control) as the between-participants factor. Where tasks had more than one level, an additional within-participants factor was added and analysed by repeated measures ANOVA, within a general linear mixed model. Estimates of effect size (ES) were calculated using the formula (X̄ depressed group – X̄ control group)/S pooled. Reference Howell20
Two main statistical methods were used to examine longitudinal associations between changes in neuropsychological functioning and treatment response.
-
1 Repeated measures ANOVA with group (treatment responder, treatment non-responder or healthy control) as the between-participants factor and time (baseline, T 1 and T 2) as the within-participants factor. If a significant interaction between group and time was found, another repeated measures ANOVA was conducted including treatment responders and non-responders only, to determine whether the groups differed over the course of treatment. Post hoc analyses were conducted when differences among groups were observed. The Fisher least significant difference test for pair-wise comparisons, or separate one-way ANOVAs, were used to examine such differences.
-
2 Effect sizes were calculated for the difference in change between treatment responders and treatment non-responders from baseline to T 2 for all major neuropsychological measures.
Pearson's correlation (two-tailed) between change in performance on neuropsychological tasks and change in clinical state from baseline to T 2 was used as a secondary analysis when one or both of the above methods produced significant effects.
Results
Demographic and clinical characteristics
In total, 68 in-patients with depression and 50 healthy controls were recruited. The two groups did not differ in any demographic characteristics (Table 1). Females in the two groups did not differ in phase of menstrual cycle (follicular or luteal; χ2 1 = 1.3, P = 0.3). No participants in either group reported having used alcohol or marijuana in the 24 h prior to neuropsychological assessment. Because of the difference in the proportion of smokers in the depression and control groups (36.7% v. 14.0%; χ2 1 = 7.6, P = 0.006), smoking status (smoker or non-smoker) was added as a between-participants factor in all baseline neuropsychological analyses.
Table 1 Demographic and clinical characteristics of the depression and healthy control groups, and responder and non-responder groups
| Depression group (n = 68) | Control group (n = 50) | F/χ2 | P | Responders (n = 25) | Non-responders (n = 33) | F/χ2 | P | Completers (n = 58) | Non-completers (n = 10) | F/χ2 | P | |
|---|---|---|---|---|---|---|---|---|---|---|---|---|
| Age, years: mean (s.d.) | 39.2 (10.8) | 38.5 (11.6) | 0.11 | 0.74a | 39.3 (11.2) | 38.4 (10.3) | 0.1 | 0.8a | 39.0 (10.7) | 40.3 (12.3) | 0.1 | 0.7a |
| Gender, male:female | 26:42 | 18:32 | 0.06 | 0.80b | 12:13 | 10:23 | 2.1 | 0.1b | 22:36 | 4:6 | – | 1.0c |
| Predicted verbal IQ, mean (s.d.) | 106.6 (8.6) | 107.4 (6.6) | 0.33 | 0.57a | 106.7 (10.1) | 106.5 (7.6) | 0.0 | 1.0a | 106.8 (8.5) | 105.6 (9.4) | 0.2 | 0.7a |
| Secondary education, years: mean (s.d.) | 4.2 (0.8) | 4.5 (0.8) | 3.08 | 0.09a | 4.3 (0.9) | 4.2 (0.9) | 0.7 | 0.4a | 4.3 (0.8) | 4.1 (1.1) | 0.4 | 0.5a |
| Tertiary education, years: mean (s.d.) | 1.7 (1.8) | 1.6 (1.5) | 0.13 | 0.71a | 2.2 (2.0) | 1.5 (2.0) | 1.4 | 0.2a | 1.8 (2.0) | 1.1 (1.7) | 1.2 | 0.3a |
| Ethnicity, NZ European:other | 60:8 | 43:7 | 0.1 | 0.70b | 23:2 | 29:4 | – | 0.7c | 52:6 | 8:2 | – | 0.3c |
| Handedness, right:left | 62:6 | 41:9 | 2.18 | 0.13b | 22:3 | 31:2 | – | 0.6c | 53:5 | 9:1 | – | 1.0c |
| Smoker, yes:no | 25:43 | 7:43 | 7.6 | 0.006b | 8:17 | 11:22 | 0.1 | 0.8b | 19:39 | 4:6 | – | 0.2c |
| Baseline MADRS score, mean (s.d.) | 35.7 (8.4) | – | – | – | 35.6 (9.4) | 35.8 (8.5) | 0.0 | 0.9a | 35.7 (8.8) | 35.4 (8.4) | 0.0 | 0.9a |
| Age at depression onset, years: mean (s.d.) | 29.6 (12.2) | – | – | – | 32.0 (10.8) | 27.9 (11.2) | 2.0 | 0.2a | 30.0 (10.8) | 32.0 (15.6) | 0.2 | 0.6a |
| Years since depression onset, mean (s.d.) | 11.2 (9.3) | – | – | – | 7.7 (9.3) | 11.5 (9.3) | 1.9 | 0.2a | 9.0 (9.3) | 8.3 (7.6) | 0.1 | 0.8a |
| Number of previous hospitalisations, mean (s.d.) | 0.7 (1.4) | – | – | – | 0.6 (1.1) | 1.0 (1.7) | 1.1 | 0.3a | 0.8 (1.5) | 0.3 (0.4) | 1.6 | 0.2a |
| Previous episodes, single:recurrent | 22:46 | – | – | – | 12:13 | 8:25 | 3.7 | 0.06b | 20:38 | 2:8 | – | 0.5c |
| Unipolar:bipolar depression | 60:8 | – | – | – | 21:4 | 29:4 | – | 0.7c | 50:8 | 10:0 | – | 0.6c |
| Psychotic features, yes:no | 8:36 | – | – | – | 3:22 | 4:29 | – | 1.0c | 7:51 | 1:9 | – | 1.0c |
| Melancholic features, yes:no | 32:36 | – | – | – | 11:14 | 19:14 | 0.8 | 0.4b | 30:28 | 2:8 | – | 0.1c |
| Atypical features, yes:no | 3:65 | – | – | – | 1:24 | 2:31 | – | 1.0c | 3:55 | 0:10 | – | 1.0c |
Clinical characteristics of the depression group are displayed inTable 1. Twenty-two patients were unmedicated at baseline; they did not differ from medicated patients on any demographic or clinical variables (all P>0.2). The most prevalent comorbid psychiatric disorders in the depression group were: post-traumatic stress disorder (16.1%), panic disorder with agoraphobia (13.2%) and alcohol misuse (8.8%).
Baseline neuropsychological functioning
Patients with depression were impaired on all neuropsychological domains compared with healthy controls (Table 2). The largest differences (ES>0.80) were found for verbal learning (RAVLT List A first recall, total learning on Trials 1–5, and Distracter List recall), visuospatial memory (GMLT delayed recall), inhibition (Stroop Task reaction time in high interference condition), verbal fluency (COWAT total words generated) and psychomotor speed (Timed Chase Test correct moves per second). A specific deficit in the recognition of disgusted facial expressions was found in the depression group on the Facial Expression Recognition Task (previously published). Reference Douglas and Porter19 No differences in reaction time or neutral misinterpretation bias were found on the Facial Expression Recognition Task between the depression and control groups (all P>0.1).
Table 2 Means (s.d.) and effect sizes from the baseline neuropsychological assessment in the depression and healthy control groupsa
| Depression group (n = 68) | Control group (n = 50) | d b | Responders (n = 25) | Non-responders (n = 33) | d b | |
|---|---|---|---|---|---|---|
| Verbal learning and memory | ||||||
| Trial 1, no. of words | 5.5 (1.4) | 6.6 (1.4) | 0.80 | 5.5 (1.5) | 5.6 (1.3) | 0.08 |
| Total Trial 1–5, no. of words | 40.9 (7.3) | 46.2 (6.0) | 0.81 | 41.7 (7.7) | 39.0 (7.2) | 0.33 |
| Distracter List, no. of words | 5.1 (1.8) | 6.4 (1.9) | 0.69 | 5.5 (1.9) | 5.0 (2.0) | 0.25 |
| Trial 6, transformed % | 96.8 (21.8) | 105.7 (16.6) | 0.44 | 92.8 (21.6) | 100.1 (22.7) | 0.30 |
| Trial 7, transformed % | 88.5 (27.2) | 103.2 (15.7) | 0.64 | 88.3 (24.2) | 91.4 (30.6) | 0.11 |
| List A recognition, % | 83.8 (11.6) | 89.4 (11.4) | 0.49 | 84.4 (12.4) | 83.5 (11.7) | 0.07 |
| List B recognition, % | 53.9 (23.0) | 75.2 (16.7) | 1.07 | 57.6 (22.7) | 50.5 (22.1) | 0.28 |
| Visuospatial learning and memory | ||||||
| Trial 1, no. of errors | 18.1 (5.9) | 16.3 (4.0) | 0.35 | 18.9 (7.9) | 17.7 (4.8) | 0.18 |
| Total Trial 1–4, no. of errors | 47.3 (15.4) | 38.4 (10.8) | 0.64 | 48.5 (16.5) | 46.5 (15.5) | 0.12 |
| Trial 5, transformed % | 78.0 (36.0) | 52.4 (24.9) | 0.81 | 82.3 (37.3) | 72.0 (35.4) | 0.28 |
| Attention and executive functioning | ||||||
| Stroop control, ms | 1073.7 (179.4) | 946.6 (164.5) | 0.74 | 1095.3 (147.3) | 1069.8 (213.6) | 0.13 |
| Stroop neutral, ms | 1164.6 (273.5) | 967.1 (214.8) | 0.81 | 1207.1 (223.3) | 1135.3 (308.6) | 0.27 |
| Stroop colour, ms | 1352.6 (322.3) | 1110.1 (253.8) | 0.84 | 1405.4 (324.1) | 1305.9 (293.5) | 0.32 |
| COWAT, no. of words | 47.0 (14.3) | 61.0 (11.7) | 1.08 | 49.8 (14.5) | 46.9 (13.4) | 0.20 |
| Psychomotor speed | ||||||
| Simple RT Task, ms | 694.3 (183.5) | 559.6 (207.5) | 0.68 | 723.7 (211.1) | 697.9 (148.3) | 0.14 |
| Timed Chase Test, no. of moves | 42.4 (9.7) | 51.9 (12.9) | 0.85 | 43.3 (7.2) | 42.1 (10.6) | 0.13 |
| Facial emotion processing, % | ||||||
| Anger recognition | 34.7 (18.2) | 42.4 (21.0) | 0.40 | 31.3 (20.3) | 40.1 (16.3) | 0.44 |
| Happy recognition | 85.9 (11.4) | 84.6 (11.1) | 0.13 | 86.0 (10.6) | 85.4 (12.1) | 0.05 |
| Sad recognition | 22.5 (11.9) | 24.6 (8.2) | 0.19 | 23.2 (9.1) | 22.3 (13.7) | 0.08 |
| Fear recognition | 49.3 (17.1) | 54.5 (19.7) | 0.29 | 47.9 (14.4) | 51.6 (18.5) | 0.22 |
| Disgust recognition | 28.3 (15.1) | 40.4 (19.0) | 0.72 | 28.3 (12.9) | 29.5 (18.0) | 0.07 |
| Neutral recognition | 56.9 (19.6) | 59.8 (19.8) | 0.14 | 56.0 (21.5) | 57.5 (19.8) | 0.06 |
Effects of demographic and clinical factors
Gender
Gender effects were observed on some neuropsychological tasks, but there were no significant group × gender interactions. Females outperformed males on RAVLT recognition (F 1,108 = 8.4, P = 0.005, ES = 0.43), whereas males generated more words than females on the COWAT (F 1,110 = 6.2, P = 0.01, ES = 0.40).
Smoking status
No main effects of smoking status were found in baseline neuropsychological analyses. However, performance on the Timed Chase Test was differentially influenced by smoking status in the depression and control groups (smoking status × group interaction; F 1,109 = 5.0, P = 0.03). Non-smokers in the control group were significantly faster than smokers, but this difference was not observed in the depression group.
Antidepressant medication
To examine the influence of medication on neuropsychological functioning, the performance of unmedicated patients with depression (n = 22) was compared with medicated patients with depression (n = 46) on all neuropsychological measures. No significant differences were found.
Depression subtype
Primary outcome measures were reanalysed after omitting the eight patients diagnosed with bipolar depression and nine patients diagnosed with psychotic depression (depression group, n = 53; control group, n = 50). All ES values remained within 0.05 of the original values shown inTable 2 and the profile of neuropsychological impairment in the depression group did not alter.
Clinical changes over the course of treatment
Eight patients did not complete the second neuropsychological assessment at T 1 because of starting ECT (n = 3), loss to follow-up (unable to be contacted, n = 2), withdrawal of consent (n =2) or being hospitalised with a serious physical injury (n = 1). Two further patients discontinued prior to the final assessment at 6 weeks (T 2) because of relocating away from Christchurch. Thus, 58 patients with depression completed all assessments. Completers (n = 58) were comparable to non-completers (n = 10) on all demographic and clinical variables (Table 1).
After baseline, patients were treated as deemed appropriate by the treating psychiatrists (Fig. 1).
A reduction of >50% on the MADRS between baseline and T 2 was used to categorise treatment outcome, resulting in 25 responders and 33 non-responders. Between-group comparisons on demographic or clinical variables are shown inTable 1 and baseline neuropsychological measures inTable 2. No significant differences were found (all P>0.1).
There was an early significant difference in MADRS scores at T 1 (F 1,57 = 11.7, P = 0.001; ES = 0.94) between patients with depression who would go on to respond to treatment at 6 weeks and those patients with depression who would not respond to treatment. A significant positive correlation was found between change in MADRS from baseline to T 1 and change from baseline to T 2 (r = 0.47; P<0.0001), indicating that those showing an early improvement in clinical state were also likely to have improved further at T 2.
Neuropsychological changes over the course of treatment
Data from performance on the main neuropsychological measures over the course of treatment (baseline to T 1 to T 2) are presented inTable 3. Gender and smoking status were not included as additional between-participant factors, as minimal effects were observed in baseline analyses.
Table 3 Means (s.d.), interactions (group × time) and effect sizes for changes in the main neuropsychological measures between baseline and 6 weeks in non-responders, responders and healthy controlsa
| Non-responders | Responders | Control group | Group × time b | d c | |
|---|---|---|---|---|---|
| Verbal learning and memory | |||||
| Trial 1, no. of words | 0.1 (0.2) | 0.8 (0.3) | 0.3 (0.2) | 0.3 | 0.80 |
| Total Trial 1–5, no. of words | 0.5 (1.1) | 1.7 (1.4) | 1.4 (0.7) | 0.8 | 0.17 |
| Distracter List, no. of words | 0.4 (0.3) | 0.4 (0.4) | – 0.1 (0.2) | 0.2 | 0.00 |
| Trial 6, transformed % | – 1.1 (5.4) | – 0.2 (6.1) | 1.8 (2.7) | 0.8 | 0.03 |
| Trial 7, transformed % | – 6.7 (6.5) | – 3.7 (6.7) | – 3.8 (1.8) | 0.6 | 0.09 |
| List A recognition, % | – 6.8 (2.7) | – 4.6 (3.4) | 0.2 (1.8) | 0.2 | 0.18 |
| List B recognition, % | 3.2 (4.2) | 3.2 (4.6) | 0.0 (2.7) | 0.8 | 0.04 |
| Visuospatial learning and memory | |||||
| Trial 1, no. of errors | 0.8 (1.2) | 3.9 (1.4) | 1.4 (0.6) | 0.05 | 0.44 |
| Total Trial 1–4, no. of errors | 0.0 (2.3) | 2.6 (2.5) | 4.1 (1.4) | 0.2 | 0.20 |
| Trial 5, transformed % | 3.4 (9.5) | 0.1 (9.3) | 5.9 (5.7) | 0.7 | 0.06 |
| Attention and executive functioning | |||||
| Stroop control, ms | 60.5 (30.8) | 96.6 (30.7) | 45.9 (17.8) | 0.6 | 0.23 |
| Stroop neutral, ms | 75.6 (38.6) | 167.9 (53.8) | 61.1 (19.2) | 0.2 | 0.40 |
| Stroop colour, ms | – 127.4 (40.4) | 236.4 (65.6) | 108.2 (18.1) | 0.1 | 0.41 |
| COWAT,d no. of words | 1.0 (1.4) | 2.9 (1.6) | 0.4 (1.0) | 0.4 | 0.25 |
| Psychomotor speed | |||||
| Simple RT Task, ms | 24.1 (26.1) | 136.7 (29.7) | 23.8 (16.7) | 0.003 | 0.77 |
| Timed Chase Test, no. of moves | 1.5 (1.3) | 1.9 (1.4) | 1.4 (1.0) | 0.8 | 0.05 |
| Facial expression recognition, % | |||||
| Anger recognition | – 2.8 (3.3) | 9.3 (3.7) | 5.9 (2.4) | 0.002 | 0.65 |
| Happy recognition | – 2.8 (2.0) | – 0.2 (1.4) | – 2.5 (1.3) | 0.6 | 0.27 |
| Sad recognition | – 1.4 (1.9) | 0.0 (2.0) | 3.1 (0.8) | 0.1 | 0.13 |
| Fear recognition | – 2.8 (2.7) | 0.0 (3.4) | – 0.4 (2.6) | 0.5 | 0.17 |
| Disgust recognition | 8.5 (3.3) | 7.8 (4.2) | 4.0 (2.2) | 0.3 | 0.04 |
| Neutral recognition | 6.7 (3.9) | – 1.8 (3.5) | – 0.9 (3.3) | 0.06 | 0.39 |
Verbal learning and memory
Repeated measures ANOVA (responders, non-responders and healthy controls) of RAVLT word recall on the five learning trials produced a significant trial × group × time interaction (F 16,840 = 2.0, P = 0.04). This interaction remained significant when including responders and non-responders only in the ANOVA (F 8,448 = 2.7, P = 0.01).
No group × time interaction was found for the first recall of List A (verbal working memory; F 4,210 = 1.2, P = 0.3), although the effect size of the difference in verbal working memory over time between responders and non-responders was large (0.80,Table 3 andFig. 2). The correlation between improvement in verbal working memory and improvement in MADRS score over time was significant also (r = 0.27, P = 0.04). No other measures from the RAVLT (recall or recognition) showed evidence of sensitivity to treatment response.
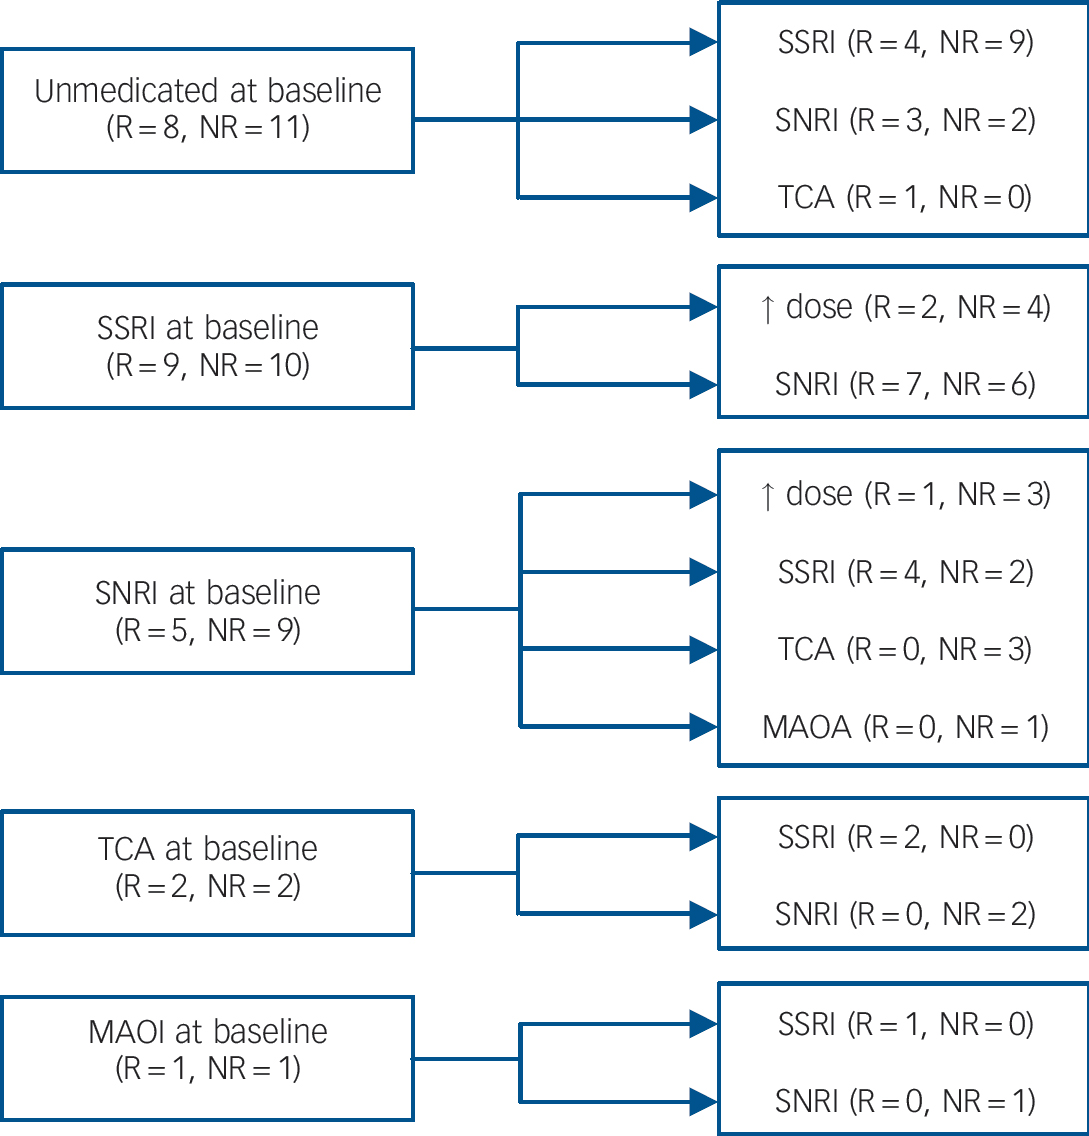
Fig. 1 Antidepressant treatment profile of patients with depression who completed the study (n = 58).
R, responders; NR, non-responders; SSRI, selective serotonin reuptake inhibitor; SNRI, serotonin noradrenaline reuptake inhibitor; TCA, tricyclic antidepressant; MAOI, monoamine oxidase inhibitor. At baseline, 19 patients were unmedicated (8 responders and 11 non-responders) and 39 patients were medicated (17 responders and 22 non-responders). After baseline, patients were commenced on an antidepressant, had their antidepressant changed or had their existing antidepressant increased in dose (↑ dose).
Visuospatial learning and memory
A significant trial × group × time interaction (F 12,624 = 2.7, P = 0.003) was found for the number of errors on the four learning trials of the GMLT. Further repeated measures ANOVA without the healthy control group showed no significant trial × group × time interaction (F 6,330 = 1.8, P = 0.1), indicating that the total number of errors on the GMLT did not differ over time between responders and non-responders. Performance on the transformed delay trial of the GMLT did not change differentially over time in responders and non-responders.
Attention and executive functioning
No group × time interactions were found for Stroop Task performance or COWAT performance among the three groups (responders, non-responders and healthy controls). Additionally, no trial × group × time interaction was observed on the Stroop Task (accuracy: F 8,396 = 1.6, P = 0.1; reaction time: F 8,396 = 0.7, P = 0.6).
Psychomotor speed
A significant group × time interaction was found for Simple RT Task performance (F 4,208 = 3.0, P = 0.003). With the responder and non-responder groups only, the interaction remained significant (F 2,110 = 5.6, P = 0.005) (Fig. 3). A moderate effect size for change over time in Simple RT Task performance between responders and non-responders was found (ES = 0.77). Improvement on the Simple RT Task from baseline to T 2 was significantly correlated with improvement in MADRS scores over the same time period (r = 0.40, P = 0.003).
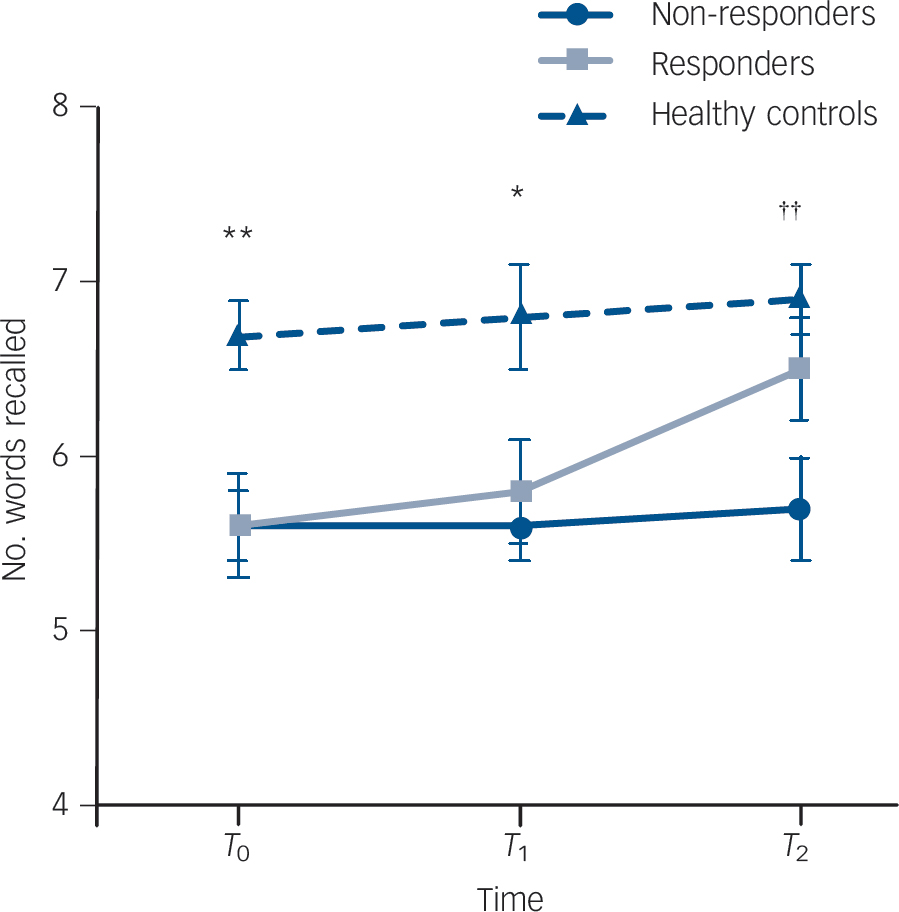
Fig. 2 Mean (s.e.m.) number of words recalled for the first presentation of List A on the Rey Auditory–Verbal Learning Task over time in non-responders (n = 33), responders (n = 25) and healthy controls (n = 50).
*P = 0.01, healthy controls recall significantly more words than responders and non-responders; **P = 0.001, healthy controls recall significantly more words than responders and non-responders;†† P = 0.001, healthy controls recall significantly more words than non-responders.
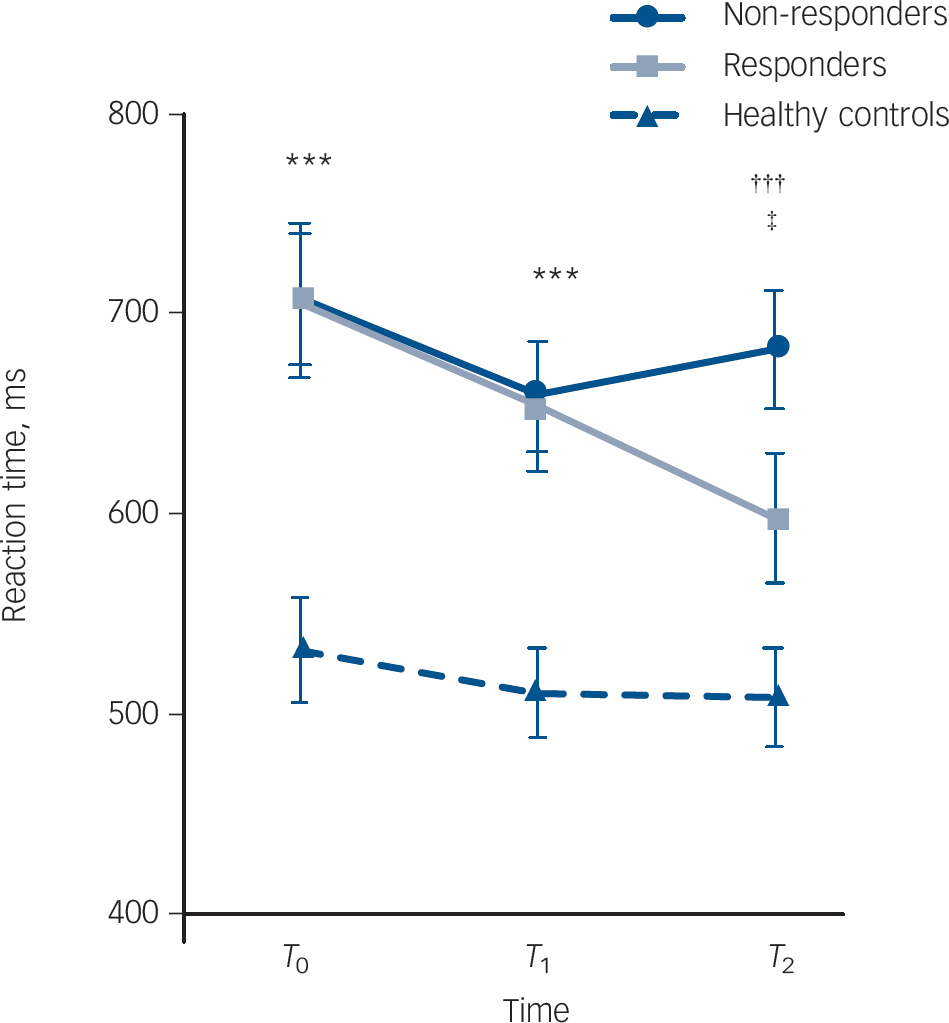
Fig. 3 Mean (s.e.m.) reaction time on the Simple Reaction Time Task in non-responders (n = 33), responders (n = 24) and healthy controls (n = 50) over time.
***P<0.0001, healthy controls significantly faster than responders and non-responders;††† P<0.0001, healthy controls significantly faster than non-responders; ‡ P = 0.08, trend for responders to be faster than non-responders.
Repeated measures ANOVA of Simple RT Task accuracy over time was conducted. No effect of group was found (F 2,104 = 2.0, P = 0.1), nor was there a group × time interaction (F 2,104 = 1.3, P = 0.3), indicating that speed was not being traded-off for accuracy.
No significant change over time was found on the Timed Chase Test across the three groups (Table 3).
Facial emotion processing
Facial expression recognition accuracy. Repeated measures ANOVA of facial emotion recognition accuracy showed a significant emotion × group × time interaction (F 20,1040 = 2.2, P = 0.004). Repeated measures ANOVA including responder and non-responder groups only, found the interaction to remain significant (F 10,550 = 2.8, P = 0.005), indicating that responders and non-responders were changing differently over time in the recognition of one or more facial expressions.
On the basis of this, a repeated measures ANOVA was conducted for each emotion. Recognition of happy, sad, fearful and neutral faces was not significantly different between groups over time (Table 3). A significant group effect was found for the recognition of disgusted faces (F 2,104 = 4.7, P = 0.01), in keeping with our previous report, Reference Douglas and Porter19 but the recognition of disgusted faces did not change differently over time among the three groups (F 4,208 = 1.3, P = 0.3).
A significant interaction between group and time was found for anger recognition (F 4,208 = 2.8, P = 0.02;Fig. 4), with the interaction remaining when analysis was repeated in responder and non-responder groups only (F 2,110 = 4.9, P = 0.009, ES = 0.65). Correlation between change in anger recognition and change in MADRS scores from baseline to T 2 was not significant (r = 0.22; P = 0.09).
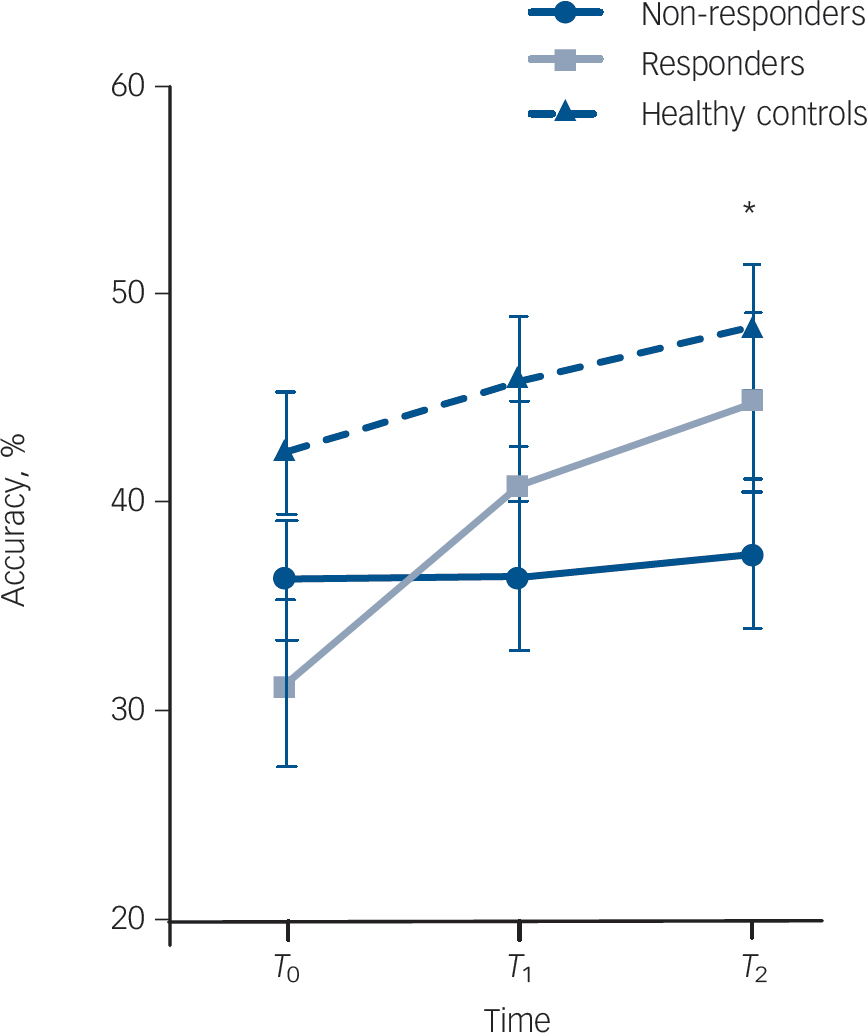
Fig. 4 Mean (s.e.m.) accuracy for recognising angry facial expressions on the Facial Expression Recognition Task over time in non-responders (n = 33), responders (n = 24) and healthy controls (n = 50).
*P<0.05, healthy controls significantly more accurate than non-responders.
Facial expression recognition reaction time. No group × time (F 4,208 =0.6, P =0.7) or trial × group × time interaction (F 20,1040 = 1.0, P = 0.4) was found for reaction time on the Facial Expression Recognition Task.
Neutral misinterpretation bias. Repeated measures ANOVA of the five misinterpreted emotions (i.e. the emotions neutral faces were misinterpreted as) produced a trend towards an interaction between group and time (F 4,208 = 2.2, P = 0.07) and a significant interaction between emotion, group and time (F 16,832 = 2.2, P = 0.01). The emotion × group × time interaction persisted when a repeated measures ANOVA was conducted in responder and non-responder groups only (F 8,440 = 2.5, P = 0.02).
On the basis of the significant interaction between emotion, group and time, misinterpreted emotions were analysed separately with five repeated measures ANOVAs. Analysis of the misinterpretation of neutral expressions as sad produced a significant interaction between group and time (F 4,208 = 3.3, P = 0.01). Post hoc analysis found responders, non-responders and healthy controls to be comparable in their tendencies to misclassify neutral faces as sad at baseline (F 2,106 = 1.5, P = 0.2) and at T 2 (F 2,106 = 0.2, P = 0.8). At T 1, non-responders were significantly less likely to interpret neutral faces as sad compared with responders (P = 0.008) but not compared with healthy controls (P = 0.1). Misinterpretation of neutral faces to the four other emotions was not different between groups over time.
Discussion
The aim of this study was to investigate whether early changes (10–14 days) in neuropsychological functioning were markers for early treatment response in in-patients with major depression. Additionally, study findings were expected to clarify the profile of neuropsychological changes that occur with improved clinical state after 6 weeks of standard treatment for major depression.
Neuropsychological functioning in severe depression
Widespread neuropsychological impairment was found in the group with severe depression compared with the well-matched, healthy control group. Impairment was exhibited in verbal and visuospatial learning and memory, attention, executive functioning, psychomotor speed and facial emotion processing. As would be expected in severe depression, many effect sizes were moderate to large (0.6–1.1). In a previous report, Reference Burt, Zembar and Niederehe21 direct comparison of memory functioning in out-patients and in-patients with depression produced effect sizes of 0.40 and 0.78 respectively, which is comparable with the results of the current study.
Changes in clinical and neuropsychological functioning during treatment
In previous studies, improvement in motor retardation has been observed soon after the commencement of antidepressant treatment and differentiated patients with depression who showed response from those not responding to treatment at 6 weeks. Reference Katz, Tekell, Bowden, Brannan, Houston and Berman6 However, in the current study, none of the measures used, including those of psychomotor speed, showed differential early (10–14 days) improvement in responders compared with non-responders. This is despite the fact that there was early clinical improvement in the MADRS, which correlated with longer-term improvement in clinical state. This then fails to support the suggestion that neuropsychological measures, particularly psychomotor speed, may change earlier than mood.
At 6 weeks, a few measures did improve differentially in treatment responders compared with non-responders.
Psychomotor speed and verbal learning
Performance on the Simple RT Task changed differentially between responders and non-responders over time. Responders, but not non-responders, improved to the level of healthy controls at 6 weeks. In an in-patient sample with depression of similar severity to the current sample, Reppermund et al Reference Reppermund, Zihl, Lucae, Horstmann, Kloiber and Holsboer22 found that a simple measure of psychomotor speed improved significantly in remitters compared with non-remitters.
There was some evidence that verbal working memory was sensitive to change in clinical state, which is consistent with the findings of our review of longitudinal changes in neuropsychological function. Reference Douglas and Porter4 This review also suggested that, at least in the elderly, psychomotor speed may improve with clinical response.
Facial emotion processing
The Facial Expression Recognition Task produced an interesting pattern of results over time. The pronounced deficit in recognising facial expressions of disgust persisted over time, regardless of treatment response. On the other hand, the recognition of angry faces improved in responders compared with non-responders, although a significant correlation with improvement in clinical state was not found. Our finding of a neutral misinterpretation bias reported previously in this group Reference Douglas and Porter19 was relatively weak and did not withstand the addition of gender and smoking to this analysis. However, this is a reasonably consistent finding in depression research Reference Leppanen, Milders, Bell, Terriere and Hietanen23,Reference Surguladze, Young, Senior, Brebion, Travis and Phillips24 and it has been suggested that an early change in this may be an important factor in improvement in depression. Reference Harmer, Goodwin and Cowen25 The only other study to have assessed facial emotion processing changes early in the treatment of major depression was conducted by Harmer et al. Reference Harmer, O'Sullivan, Favaron, Massey-Chase, Ayres and Reinecke26 In this study, however, facial emotion processing was not measured in relation to treatment response, but only very soon after administration of reboxetine.
In the current study, anger recognition improved in line with treatment response but change in misinterpretation of neutral faces, particularly to ‘sad’, were complex and difficult to interpret. Recently, it has been reported that unmedicated patients with depression display increased left amygdala activation when processing angry and fearful faces, compared with healthy controls. Reference Peluso, Glahn, Matsuo, Monkul, Najt and Zamarripa27 It may be that responders in the current sample were improving in anger recognition due to normalisation of amygdala function during treatment. Clearly, further research using more sensitive and numerous facial stimuli, particularly increased numbers of neutral stimuli, is needed to determine whether facial emotion processing measures do change in line with treatment response in major depression.
Methodological limitations
The patient sample in this study was heterogeneous in antidepressant use before and after admission to hospital. Individual antidepressants may result in clinical remission via different biological pathways, which may then give rise to inconsistent findings in this study. However, the current study did not aim to examine the neuropsychological effects of particular antidepressant medications; rather, it focused on broad treatment response. The follow-up interval for this study was also relatively brief. It could be that the performance of responders and non-responders would have diverged more significantly had the follow-up assessment been conducted later.
Future directions
This is the first study to examine neuropsychological changes as they relate to treatment response at such an early stage of treatment in major depression. Data do not support the hypothesis that neuropsychological tasks can measure early, biological changes in patients with major depression who will go on to respond to treatment. However, particularly in the area of emotion processing, we believe that the study shows sufficient preliminary evidence of changes associated with treatment response to warrant further investigation. As noted, for example, increasing the number of faces in the Facial Expression Recognition Task may help to improve sensitivity and lead to clearer findings. This may lead to a greater understanding of the neurobiology of response to treatment and the possibility of such tasks being used in clinical trials or as adjuncts to clinical assessment.
Funding
This study was supported by a Bright Future Doctoral Scholarship from the New Zealand Tertiary Education Commission.
Acknowledgements
We thank the patients and staff of Hillmorton Hospital for their cooperation in this study.


eLetters
No eLetters have been published for this article.