


This review seeks to contribute to the important debate on the usefulness of prodromal symptoms in identifying people at high risk of developing schizophrenia. Research suggests that schizophrenia has a prodromal period where significant changes from premobid functioning can be observed. Reference Knowles and Sharma1 Prodromal symptoms of schizophrenia are defined as early specific and non-specific symptoms preceding the first psychotic episode. Reference Yung, Phillips, Yuen, McGorry, Ward and Donovan2–Reference Phillips, Yung and McGorry4 They consist of behavioural abnormalities, pseudoneurotic signs and subtle cognitive and affective changes. Reference Phillips, Yung and McGorry4 In general, it is believed that individuals who will go on to develop schizophrenia go though a variety of abnormal, subjective experiences that progressively develop during pre-puberty and puberty. Reference Yung, Phillips, Yuen, McGorry, Ward and Donovan2 However, an individual could present with the same prodromal symptoms without necessarily developing a psychotic illness. Reference Phillips, Yung and McGorry4
There are generally two viewpoints pertaining to the subject of prodromal symptoms, Reference Olsen and Rosenbaum5 the basic-symptoms Reference Gross, Huber and Klosterkotter6 approach and the ultra-high-risk approach. Reference Yung, Phillips, Yuen, McGorry, Ward and Donovan2,Reference McGlashan, Miller, Woods, Rosen, Hoffman and Davidson7 The basic-symptoms approach refers to the validity of particular neuropsychological symptoms, describing disturbances prior to the onset of psychosis. Reference Olsen and Rosenbaum5 These disturbances are assessed in the domains of perception, cognition, motor functioning, will, energy level and stress tolerance. Reference Gross, Huber and Klosterkotter6 The ultra-high-risk criteria are composed of the following three alternative risk syndromes: attenuated positive symptoms, brief limited intermittent psychotic symptoms (BLIPS) and trait and state risk factors. Reference Yung, Phillips, Yuen, McGorry, Ward and Donovan2 Attenuated positive symptoms is used when the individual has symptoms that deviate from normal phenomena but that are not yet frankly psychotic. Reference Yung, Phillips, Yuen, McGorry, Ward and Donovan2 Brief limited intermittent psychotic symptoms is used when the symptoms are of psychotic intensity but they are very infrequent, or have a total duration of less then 7 days before resolving spontaneously. Reference Yung, Phillips, Yuen, McGorry, Ward and Donovan2 Whereas the term trait and state risk factors is used when there are non-specific symptoms such as lowered mood or anxiety symptoms plus some trait risk-factors for psychotic disorder, either schizotypal personality disorder or a family history of psychotic disorder in a first-degree relative. Reference Yung, Phillips, Yuen, McGorry, Ward and Donovan2 With both approaches (basic symptoms and ultra-high risk), at this stage, neither the recognition nor the description of the period preceding psychosis allows for the effective prediction of psychosis. Reference Miller, McGlashan, Rosen, Cadenhead, Ventura and McFarlane3
Consideration of the predictive validity of prodromal symptoms is important for both researchers and clinicians; it evokes a lot of debate on the usefulness and accuracy of prodromal screening instruments given the ethical implications that comes with it. Reference Marshall, Lewis and Lockwood8–Reference McGlashan, Addington, Cannon, Heinimaa, McGorry and O'Brien10 The risk of negative effects for the large numbers of people who screen false positive (people who do not covert to schizophrenia) are considerable. The rate of false positives in some studies has been as high as 60–90% Reference Haroun, Dunn, Haroun and Cadenhead11 leading to unfavourable risk to benefit ratios in studies with lower conversion rates. These risks include unnecessary fear of illness, restriction of life goals, use of medication and their side-effects, stigmatisation and loss of confidentiality and insurability. Reference Haroun, Dunn, Haroun and Cadenhead11,Reference Warner12 However, early identification and intervention during the prodromal phase of the illness promises to reduce the economic burden caused by schizophrenia. Ruhrmann et al further contributed to this debate by suggesting that the majority of help-seeking at-risk people fulfil DSM-IV general criteria for mental disorders and have a need for and right to treatment. Reference Ruhrmann, Schultze-Luther and Klosterkotter13 They argue for prodromal symptoms to be classified as psychosis-spectrum disorder in DSM-5. Reference Ruhrmann, Schultze-Luther and Klosterkotter13
Method
Search method
A comprehensive search of electronic databases for diagnostic research reports was carried out. The following electronic health-related databases were comprehensively searched, CINAHL (1982–2010), EMBASE (1980–2010) MEDLINE (1950–2010) and PsycINFO (1806–2010). The search terms were identified using the population, intervention, comparison and outcome method. Reference Schardt, Adams, Owens, Keitz and Fontelo14 We used the following MeSH terms: schizophrenia, psychosis disorders and prodrome, together with the text terms: prodromal symptoms, prodromal scales, prodrom$, early-intervention and screening. These were used in combination with the search terms recommended for diagnostic reviews: Reference Deville, Bunxix, Bouter, Montori, De Vet and Van Der15 sensitivity, negative-predictive-values, positive-predictive-values, likelihood-ratios, ROC curves and diagnostic odds ratios. Reference lists of articles obtained were checked to identify relevant reports. This was done in a systematic way following up references from one article to another to identify possible studies.
Selection criteria
We included studies with prospective or cohort designs and cross-sectional designs. The primary studies had a clearly specified population, from which a prodromal criterion was administered to identify clearly those with prodromal symptoms from those without. The two groups were then followed up for a number of months and assessed again with a diagnostic instrument to determine those who had converted to schizophrenia. The exclusion criteria were the presence of psychotic disorder (as we were interested in assessing those at risk of psychotic disorder), known organic cause of presentation and known intellectual disability. The gold standard (reference standard) for this review was DSM–IV. 16
Validity assessment
Data were independently extracted by two researchers. We took care to avoid the ‘double counting’ of evidence, particularly where the same first authors were quoted in several validation studies. We assessed study quality in line with accepted guidelines. Reference Bossuyt, Reitsma, Bruns, Gatsonis, Glasziou and Irwig17,Reference Whiting, Rutjes, Reitsma, Bossuyt and Kleijnen18 In particular we sought information on the application of a diagnostic standard independent of the knowledge of scores on the prodromal criteria (‘masked’). Lack of masking is a potential source of bias within cross-sectional validation studies, since foreknowledge of test scores by those applying a diagnostic gold standard can create an exaggerated level of agreement. 19 We paid particular attention to the description of the study population and of the diagnostic tests, since bias in estimation of test accuracy has been associated with poor description of these. Reference Sackett and Haynes20 The use of the appraisal tools helps in guarding against different forms of bias, for example, inappropriate use of the reference standard, lack of masking and a case–control study design. Reference Sackett and Haynes20 Where possible raw data rather than percentages or measures of effect were extracted from primary studies; this helps in avoiding hidden errors in data extraction. In the case of missing data during the data extraction process, the original authors of the primary studies were contacted for clarification. Data requiring manipulation were first extracted in their original form and then transformed in subsequent steps. Reference Deville, Bunxix, Bouter, Montori, De Vet and Van Der15,Reference Sackett and Haynes20
Quantitative data synthesis
We first constructed 2×2 tables for all studies. From these we calculated sensitivity, specificity, likelihood ratios (positive and negative), diagnostic odds ratio (OR) and a summary receiver operator characteristic (ROC) curve using Meta-Disc software version 1.4 for Windows (www.hrc.es/investigacion/metadisc_en.htm). Reference Zamora, Abraira, Muriel, Khan and Coomarasamy21 The likelihood ratio represents a measure of the predictive ability of a test that, unlike positive predictive value, is a fundamental predictive attribute of the instrument, which does not vary according to the baseline prevalence of the disorder in question. Reference Sackett and Haynes20 The diagnostic OR is the ratio of the odds of a positive test among those with the disorder to the odds of a positive result among those without the disorder. Reference Deville, Bunxix, Bouter, Montori, De Vet and Van Der15,Reference Sackett and Haynes20 This is the recommended metric in diagnostic meta-analyses. Reference Sackett and Haynes20 Receiver operator characteristic curves are the most informative way of representing the inherent trade-off between sensitivity and specificity for a test of a diagnostic instrument. Reference Walter22 We therefore created a single plot of sensitivity and specificity in ROC space summarising each study, weighted by study size. Summary ROC Reference Walter22 curves were then constructed using a bivariate model to produce a 95% confidence ellipse within ROC space. Reference Sackett and Haynes20 Unlike a traditional ROC plot that explores the effect of a varying threshold on sensitivity and specificity in a single study, each data point in the summary ROC space represents a separate study. Reference Walter22 Between-study heterogeneity was assessed using the I 2 statistic of the pooled diagnostic OR, Reference Higgins, Thompson, Deeks and Altman23 which describes the percentage of total variation across studies that is caused by heterogeneity rather than chance. The I 2 statistic has several advantages over other measures of heterogeneity (such as chi-squared), including greater statistical power to detect clinical heterogeneity when fewer studies are available. Reference Higgins, Thompson, Deeks and Altman23 As a guide, I 2 values of 25% may be considered ‘low’, 50% ‘moderate’ and 75% ‘high’. Where there was significant between-study heterogeneity, we sought to explore the causes of this heterogeneity. Reference Higgins, Thompson, Deeks and Altman23
Results
Literature search
Our searches identified 584 potential studies. The titles of the 584 were read by two reviewers and 417 of the citations were excluded at this stage as they did not meet our inclusion criteria. The titles and abstracts for the remaining 167 articles were read by one reviewer (J.C.). Out of these, 127 studies were excluded with reasons ranging from the articles not being diagnostic studies to articles investigating reliability of instruments rather than the diagnosis accuracy of the criteria. Of the 40 studies selected from examination of the complete text, 24 studies were excluded because they did not meet the criteria in the following areas: index test, gold standard, study design aspects and outcome type. Of these, two were excluded because of multiple publications. Two papers by Miller et al reported the same study in different journals under different titles; we included one paper Reference Miller, McGlashan, Rosen, Cadenhead, Ventura and McFarlane3 instead of both. Similarly, a study by Klosterkötter et al was published twice and we included only one report Reference Klosterkötter, Hellmich, Steinmeyer and Schultze-Lutter24 instead of both.
Methodological quality of studies
All studies included in this review were assessed against the standard for reporting of diagnostic accuracy (STARD) Reference Bossuyt, Reitsma, Bruns, Gatsonis, Glasziou and Irwig17 checklists. One investigator assessed the quality of all included studies. To evaluate the inter-observer variability in the rating of the STARD criteria, a second investigator examined three randomly selected publications, masked to the results of the first investigator. Six studies Reference Yung, Phillips, Yuen, Francey, McFarlane and Hallgren25–Reference Lemos, Vanilla, Fernandez, Ortega, Garcia and Gutierrez30 did not describe in detail the number, training, and expertise of the persons executing and reading the index tests and the reference standard (STARD item 10). All studies Reference Miller, McGlashan, Rosen, Cadenhead, Ventura and McFarlane3,Reference Klosterkötter, Hellmich, Steinmeyer and Schultze-Lutter24–Reference Riecher-Rossler, Pflueger, Aston, Borgwart, Brewer and Gschwandtner37 did not specify whether investigators were masked to the results of the other test (index test or reference test; item 11 of the STARD checklist). One of the main requirements for the assessment of the predictive validity of diagnostic studies is the inclusion of participants not meeting prodromal criteria yet similarly recruited as those fulfilling the criteria to avoid spectrum bias Reference Bossuyt, Reitsma, Bruns, Gatsonis, Glasziou and Irwig17 (STARD item 16). Three studies Reference Cannon, Cadenhead, Cornblatt, Woods, Addington and Walker31,Reference Ruhrmann, Schultze-Lutter, Salokangas, Heinimaa, Linszen and Dingermanns34,Reference Riecher-Rossler, Pflueger, Aston, Borgwart, Brewer and Gschwandtner37 did not systematically enrol participants who tested negative to the prodromal criteria. We identified only three studies Reference Klosterkötter, Hellmich, Steinmeyer and Schultze-Lutter24,Reference Yung, Nelson, Stanford, Simmons, Cosgrave and Killackey29,Reference Woods, Addington, Cadenhead, Cannon, Cornblatt and Heinssen33 with sufficient sample sizes and well-defined control groups similarly recruited to those fulfilling prodromal criteria.
Study characteristics
We found 13 prospective evaluation studies Reference Miller, McGlashan, Rosen, Cadenhead, Ventura and McFarlane3,Reference Klosterkötter, Hellmich, Steinmeyer and Schultze-Lutter24–Reference Cannon, Cadenhead, Cornblatt, Woods, Addington and Walker31,Reference Woods, Addington, Cadenhead, Cannon, Cornblatt and Heinssen33–Reference Lencz, Smith, Auther, Correl and Cornblatt35,Reference Riecher-Rossler, Pflueger, Aston, Borgwart, Brewer and Gschwandtner37 meeting our inclusion criteria and with sufficient data (reported in 15 publications, Reference Miller, McGlashan, Rosen, Cadenhead, Ventura and McFarlane3,Reference Yung, Phillips, Yuen, Francey, McFarlane and Hallgren25–Reference Schultze-Lutter, Ruhrmann, Berning, Maier and Klosterkötter38 see online Table DS1). Twelve studies examined the predictive validity of the ultra-high-risk criteria, Reference Miller, McGlashan, Rosen, Cadenhead, Ventura and McFarlane3,Reference Yung, Phillips, Yuen, Francey, McFarlane and Hallgren25–Reference Lemos, Vanilla, Fernandez, Ortega, Garcia and Gutierrez30,Reference Woods, Addington, Cadenhead, Cannon, Cornblatt and Heinssen33–Reference Lencz, Smith, Auther, Correl and Cornblatt35 two studies examined the predictive validity of the basic-symptoms criteria. Reference Klosterkötter, Hellmich, Steinmeyer and Schultze-Lutter24,Reference Schultze-Lutter, Ruhrmann, Klosterkötter, Johannesen, Martidale and Cullberg36 All included studies made a reference to a DSM diagnosis of schizophrenia, established according to standardised methods by a trained research worker or mental health professional. Three studies Reference Miller, McGlashan, Rosen, Cadenhead, Ventura and McFarlane3,Reference Lemos, Vanilla, Fernandez, Ortega, Garcia and Gutierrez30,Reference Lencz, Smith, Auther, Correl and Cornblatt35 had very small sample sizes of 34, 30 and 34 participants respectively, however, with similarly recruited control groups to the high-risk group. All identified prospective studies Reference Miller, McGlashan, Rosen, Cadenhead, Ventura and McFarlane3,Reference Yung, Phillips, Yuen, Francey, McFarlane and Hallgren25–Reference Schultze-Lutter, Ruhrmann, Berning, Maier and Klosterkötter38 were from specialised early detection assessment settings that suggest selection bias and therefore makes it difficult to generalise the predictive validity of these studies across different clinical setting.
Meta-analysis of ultra-high risk criteria for predicting schizophrenia
We pooled 12 studies (1918 participants: 402 confirmed with schizophrenia by DSM gold standard). Reference Miller, McGlashan, Rosen, Cadenhead, Ventura and McFarlane3,Reference Yung, Phillips, Yuen, Francey, McFarlane and Hallgren25–Reference Cannon, Cadenhead, Cornblatt, Woods, Addington and Walker31,Reference Woods, Addington, Cadenhead, Cannon, Cornblatt and Heinssen33–Reference Lencz, Smith, Auther, Correl and Cornblatt35,Reference Riecher-Rossler, Pflueger, Aston, Borgwart, Brewer and Gschwandtner37 When we combined psychometric attributes across studies, we found a low level of between-study heterogeneity Reference Higgins, Thompson, Deeks and Altman23 (combined diagnostic OR I 2 = 35.5%). Pooled sensitivity was 0.66 (95% CI 0.61–0.70) and specificity was 0.73 (95% CI 0.71–0.75). The likelihood ratio for a positive test was 3.53 (95% CI 2.66–4.69), and the likelihood ratio for a negative test was 0.33 (95% CI 0.22–0.51). When we summarised individual studies within ROC space, we found that the majority of studies were gathered within an informative top left-hand corner with an area under curve (AUC) of 0.85 (Fig. 1). However, two studies were obvious ‘outliers’: a multisite longitudinal study predicting psychosis in youth at high risk Reference Cannon, Cadenhead, Cornblatt, Woods, Addington and Walker31 and a prospective European prediction of psychosis study. Reference Ruhrmann, Schultze-Lutter, Salokangas, Heinimaa, Linszen and Dingermanns34 These studies each had relatively low sensitivity. The omission of these studies eliminated the level of between-study heterogeneity from combined diagnostic OR I 2 = 35.5% to I 2 = 0.0% as shown in Fig. 2. Heterogeneity was therefore explained by the recruitment methods used in the two studies; Reference Cannon, Cadenhead, Cornblatt, Woods, Addington and Walker31,Reference Ruhrmann, Schultze-Lutter, Salokangas, Heinimaa, Linszen and Dingermanns34 both studies did not systematically enrol participants who were ultra-high-risk criteria negative. The predictive values in these studies were calculated from adjunctive criteria, such as demographics, functioning and family history among the ultra-high-risk positive population. The overall pooled result was substantially altered
Table 1 Diagnostic attributes for ultra-high-risk prodromal criteria against a standardised diagnosis of DSM-IV schizophrenia

| Study | n | Follow-up Months | Sensitivity (95% CI) | Specificity (95% CI) | Positive likelihood ratio (95% CI) | Negative likelihood ratio (95% CI) |
|---|---|---|---|---|---|---|
| Yung et al 2003 Reference Yung, Phillips, Yuen, Francey, McFarlane and Hallgren25 | 48 | 12 | 0.65 (0.41–0.83) | 0.92 (0.73–0.99) | 8.45 (2.15–33.25) | 0.38 (0.21–0.69) |
| Yung et al 2004 Reference Yung, Phillips, Yuen and McGorry26 | 104 | 12 | 0.61 (0.44–0.76) | 0.93 (0.83–0.93) | 8.37 (3.44–20.10) | 0.42 (0.28–0.60) |
| Mason et al 2004 Reference Mason, Startup, Halpin, Schall, Conrad and Carr27 | 74 | >12 | 0.84 (0.67–0.93) | 0.86 (0.70–0.95) | 6.2 (2.7–14.18) | 0.2 (0.09–0.40) |
| Yung et al 2005 Reference Yung, Phillips, Yuen, McGorry, Kelly and Dell'olio28 | 150 | 6 | 0.83 (0.36–0.99) | 0.74 (0.65–0.80) | 3.16 (2.01–4.95) | 0.22 (0.04–1.30) |
| Yung et al 2008 Reference Yung, Nelson, Stanford, Simmons, Cosgrave and Killackey29 | 292 | 24 | 0.91 (0.68–0.98) | 0.63 (0.57–0.69) | 2.45 (1.99–3.02) | 0.15 (0.04–0.57) |
| Woods et al 2009 Reference Woods, Addington, Cadenhead, Cannon, Cornblatt and Heinssen33 | 638 | 30 | 0.89 (0.81–0.94) | 0.60 (0.56–0.64) | 2.44 (1.98–2.53) | 0.18 (0.10–0.32) |
| Miller et al 2003 Reference Miller, McGlashan, Rosen, Cadenhead, Ventura and McFarlane3 | 34 | 24.7 | 1.00 (0.60–1.00) | 0.73 (0.45–0.91) | 3.75 (1.62–8.62) | 0 |
| Lemos et al 2006 Reference Lemos, Vanilla, Fernandez, Ortega, Garcia and Gutierrez30 | 30 | 12 | 0.75 (0.47–0.92) | 0.91 (0.64–0.99) | 10.5 (1.5–70.9) | 0.27 (0.11–0.64) |
| Lencz et al 2003 Reference Lencz, Smith, Auther, Correl and Cornblatt35 | 34 | 24 | 0.78 (0.40–0.96) | 0.68 (0.46–0.84) | 2.43 (1.24–4.75) | 0.33 (0.09–1.15) |
| Riecher–Rossler et al 2009 Reference Riecher-Rossler, Pflueger, Aston, Borgwart, Brewer and Gschwandtner37 | 53 | 84 | 0.81 (0.58–0.94) | 0.78 (0.60–0.91) | 3.7 (1.86–7.36) | 0.16 (0.06–0.40) |
| Ruhrmann et al 2010 Reference Ruhrmann, Schultze-Lutter, Salokangas, Heinimaa, Linszen and Dingermanns34 | 183 | 18 | 0.42 (0.25–0.59) | 0.98 (0.94–1.00) | 19.9 (6.06–65.4) | 0.60 (0.45–0.80) |
| Cannon et al 2008 Reference Cannon, Cadenhead, Cornblatt, Woods, Addington and Walker31 | 291 | 30 | 0.34 (0.25–0.44) | 0.89 (0.84–0.93) | 3.1 (1.90–5.01) | 0.74 (0.64–0.86) |
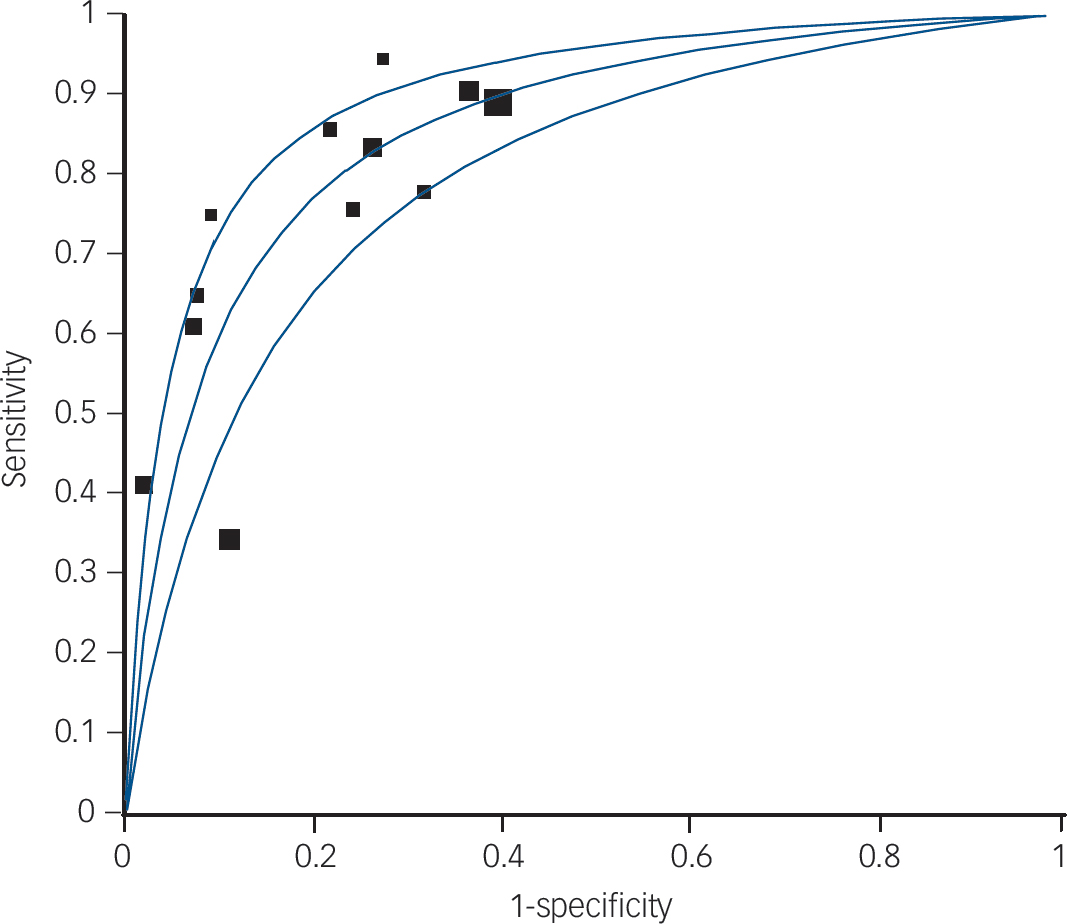
Fig. 1 Summary receiver operator characteristic (ROC) curve for ultra-high-risk criteria.
Symmetric summary ROC: area under curve (AUC) = 0.8537, s.e. = 0.232; Q* = 0.7847, s.e. = 0.0221.
by the exclusion of these studies. When these outliers were omitted the pooled sensitivity was 0.81 (95% CI 0.76–0.85) and specificity was 0.67 (95% CI 0.64–0.70). The average follow-up period for 11 of the included studies Reference Miller, McGlashan, Rosen, Cadenhead, Ventura and McFarlane3,Reference Yung, Phillips, Yuen, Francey, McFarlane and Hallgren25–Reference Cannon, Cadenhead, Cornblatt, Woods, Addington and Walker31,Reference Woods, Addington, Cadenhead, Cannon, Cornblatt and Heinssen33–Reference Lencz, Smith, Auther, Correl and Cornblatt35 was 18.6 months and one of the included studies Reference Riecher-Rossler, Pflueger, Aston, Borgwart, Brewer and Gschwandtner37 had a longer follow-up period of 84 months. However, the overall pooled result was not substantially altered by the inclusion or exclusion of this study. Table 1 shows the diagnostic attributes for ultra-high-risk prodromal criteria against a standardised diagnosis of schizophrenia (DSM-IV), whereas Table 2 shows the diagnostic performance of ultra-high-risk criteria at varying cut-off points.
Properties of basic-symptoms criteria in predicting schizophrenia
We identified only one study (160 participants: 79 confirmed with schizophrenia) reported in two publications. Reference Klosterkötter, Hellmich, Steinmeyer and Schultze-Lutter24,Reference Schultze-Lutter, Ruhrmann, Klosterkötter, Johannesen, Martidale and Cullberg36 The study had a sensitivity of 0.97 (95% CI 0.91–1.00), specificity of 0.59 (95% CI 0.48–0.70) and an average follow-up period of 9.6 years. The likelihood ratio for a positive test was 2.39 (95% CI 1.84–3.12) and the likelihood ratio for a negative test was 0.04 (95% CI 0.01–1.17). The cut-off point for these results was the presence of at least 1 of 66 basic symptoms at baseline. The study results at two different cut-off points were also available. The second cut-off point was the presence of at least one of the ten cognitive perceptive (COPER) basic symptoms. Reference Schultze-Lutter, Ruhrmann, Klosterkötter, Johannesen, Martidale and Cullberg36 This had a sensitivity of 0.87, a specificity of 0.54, a positive likelihood ratio of 1.9 and a
Table 2 Diagnostic performance of ultra-high-risk criteria at varying cut-off points a

| Study and cut-off/result description | Sensitivity | Specificity | Predictors/index tests |
|---|---|---|---|
| Yung et al 2003, Reference Yung, Phillips, Yuen, Francey, McFarlane and Hallgren25 presence of at least one of four potential predictors | 0.65 | 0.93 | SCID for DSM-IV, Reference First, Spitzer, Gibbon and Williams40 QLS, Reference Heinrichs, Hanlon and Carpenter41 BPRS, Reference McGorry, Goodwin and Stuart42 SANS, Reference Andreasen43 HRSD, Reference Hamilton44 HRSA, Reference Hamilton45 MRS Reference Young, Biggs, Ziegler and Meyer46 |
| Yung et al 2004 Reference Yung, Phillips, Yuen and McGorry26 | SCID for DSM-IV, QLS, BPRS, SANS, HRSD, HRSA, MRS, GAF Reference Hall47 | ||
| Trait + attenuated symptoms | 0.60 | 0.93 | |
| Presence of at least one of four potential predictors | 0.61 | 0.93 | |
| Mason et al 2004 Reference Mason, Startup, Halpin, Schall, Conrad and Carr27 | PSA, Reference Cannon-Spoor, Potkin and Wyatt48 QLS, SRE, Reference Amundson, Hart and Holmes49 BPRS, SANS, GAF, HRSD, HRSA | ||
| Unusual thought content, magical ideation | 0.84 | 0.84 | |
| Schizotypal personality disorder | 0.76 | 0.76 | |
| Yung et al 2005, Reference Yung, Phillips, Yuen, McGorry, Kelly and Dell'olio28 presence of at least one of four potential predictors | 0.83 | 0.74 | SCID for DSM-IV, CAARMS Reference Yung, Phillips, Yuen, McGorry, Ward and Donovan2 |
| Yung et al 2006, Reference Yung, Stanford, Cosgrave, Killackey, Phillips and Nelson32 2008, Reference Yung, Nelson, Stanford, Simmons, Cosgrave and Killackey29 presence of at least one of four potential predictors | 0.92 | 0.62 | SCID for DSM-IV, CAARMS, GAF |
| Woods et al 2009, Reference Woods, Addington, Cadenhead, Cannon, Cornblatt and Heinssen33 ultra-high-risk positive | 0.89 | 0.60 | SIPS, Reference Miller, McGlashan, Rosen, Cadenhead, Ventura and McFarlane3 SOPS, Reference Miller, McGlashan, Rosen, Cadenhead, Ventura and McFarlane3 GAF |
| Miller et al 2003, Reference Miller, McGlashan, Rosen, Cadenhead, Ventura and McFarlane3 SIPS positive | 1.0 | 0.73 | SIPS, SCID for DSM-IV, SOPS, GAF, COPS, POPS |
| Lemos et al 2006 Reference Lemos, Vanilla, Fernandez, Ortega, Garcia and Gutierrez30 | SCID for DSM-IV, SOPS, SIPS | ||
| Positive symptoms | 0.75 | 0.91 | |
| Negative symptoms | 1.00 | 0.96 | |
| Disorganised symptoms | 1.00 | 0.86 | |
| General symptoms | 0.75 | 0.93 | |
| Lencz et al 2003 Reference Lencz, Smith, Auther, Correl and Cornblatt35 | SCID for DSM-IV, SOPS, SIPS | ||
| Total score of 10+ | 0.70 | 0.72 | |
| Total score 15+ | 0.79 | 0.69 | |
| Highest item score 5 | 0.80 | 0.59 | |
| Highest item score >3 | 0.81 | 0.78 | |
| Riecher–Rossler et al 2009 Reference Riecher-Rossler, Pflueger, Aston, Borgwart, Brewer and Gschwandtner37 | BSIP, Reference Riecher-Rössler, Aston, Ventura, Merlo, Borgwardt and Gschwandtner50 BPRS, SANS | ||
| Positive symptoms (BPRS) suspiciousness | 0.70 | 0.72 | |
| Negative symptoms (SANS) alogia, anhedonia-asociality | 0.79 | 0.69 | |
| Neuropsychology | 0.80 | 0.59 | |
| Combined model | 0.81 | 0.78 | |
| Ruhrmann et al 2010, Reference Ruhrmann, Schultze-Lutter, Salokangas, Heinimaa, Linszen and Dingermanns34 SIPS positive score >16 | 0.42 | 0.98 | SIPS, GAF |
| Cannon et al 2008, Reference Cannon, Cadenhead, Cornblatt, Woods, Addington and Walker31 genetic risk and GAF reduction of ≥10%, unusual thought content, and paranoid ideation | 0.34 | 0.89 | SIPS, GAF |
SCID for DSM-IV, Structured Clinical Interview for DSM-IV; QLS, Quality of Life Scale; BPRS, Brief Psychiatric Rating Scale; SANS, Scale for the Assessment of Negative Symptoms; HRSD, Hamilton Rating Scale for Depression; HRSA, Hamilton Rating Scale for Anxiety; MRS, Mania Rating Scale; PSA, Premorbid Social Adjustment scale; SRE, Schedule of Recent Experience; GAF, Global Assessment of Functioning; CAARMS, Comprehensive Assessment of at Risk Mental States; SIPS, Structured Interview for Prodromal Syndromes; SOPS, Scale of Prodromal Symptoms; COPS, Criteria of Prodromal Syndromes; POPS, Presence of Psychotic Syndromes; BSIP, Basel Screening Instrument for Psychosis.
a Ruhrmann et al in addition to using ultra-high-risk criteria also assessed cognitive disturbance (COGDIS).
negative likelihood ratio of 0.2. Reference Schultze-Lutter, Ruhrmann, Klosterkötter, Johannesen, Martidale and Cullberg36 The third cut-off point was the presence of at least one of nine cognitive disturbance (COGDIS) basis symptoms. Reference Schultze-Lutter, Ruhrmann, Klosterkötter, Johannesen, Martidale and Cullberg36 The sensitivity, specificity, positive likelihood ratio and negative likelihood ratio of this criteria was 0.67, 0.83, 3.9 and 0.4 respectively.
Discussion
Key findings
We found 12 predictive diagnostic studies with 1918 participants where a diagnostic gold standard was independently applied. Ultra-high-risk criteria were able to correctly predict schizophrenia (sensitivity 81%) while being able to exclude this condition with some certainty (specificity 67%). The AUC for the summary ROC was 0.85, suggesting that the ultra-high-risk criteria can predict the conversion to schizophrenia with moderate precision. Reference Streiner and Norman39
We only identified one study Reference Klosterkötter, Hellmich, Steinmeyer and Schultze-Lutter24 investigating the diagnostic properties of basic-symptoms criteria against a DSM-IV gold standard. The study had a very good sensitivity of 0.97, moderate specificity of 0.59 and a follow-up period of over 9.6 years.
Strength and limitations
An interesting finding in relation to ultra-high-risk criteria is the observation period. The identified studies had an average follow-up period of 18.6 months; a recent retrospective study Reference Schultze-Lutter, Ruhrmann, Berning, Maier and Klosterkötter38 estimated that the pre-psychotic period can continue for up to 7 years. This suggests that some people identified as false positives by the prodromal criteria may remain at risk of developing schizophrenia in the future. Treating those who remain at high risk of developing schizophrenia at the end of the study period as false positives may have the effect of underestimating the diagnostic properties of prodromal criteria. The argument that false positives may represent individuals who remain at risk of developing schizophrenia is only true for a true prodrome. True schizophrenia prodrome is defined as a state inevitably and continuously progressing into the manifest of schizophrenia disorder. Reference Ruhrmann, Schultze-Luther and Klosterkotter13 However, this argument is not true for self-restricting, non-progressive episodes of an ‘at risk mental state’ (also known as outpost syndrome) that have recently been reported to frequently occur in adolescents. Reference Ruhrmann, Schultze-Luther and Klosterkotter13,Reference Simon and Umbricht51 Outpost syndrome therefore represents true false positives (people identified by the test as at high risk but who do not convert to schizophrenia). The prevalence of these self-restricting episodes without subsequent development of psychosis is not known. Reference Ruhrmann, Schultze-Luther and Klosterkotter13
The strength of the identified study using basic-symptoms criteria was that it had a long follow-up period of 9.6 years and an adequate sample size (160 participants). The follow-up period of 9.6 years allows for a sufficient time to observe the participants at ‘at high risk’ throughout the pre-psychotic phase, unlike those
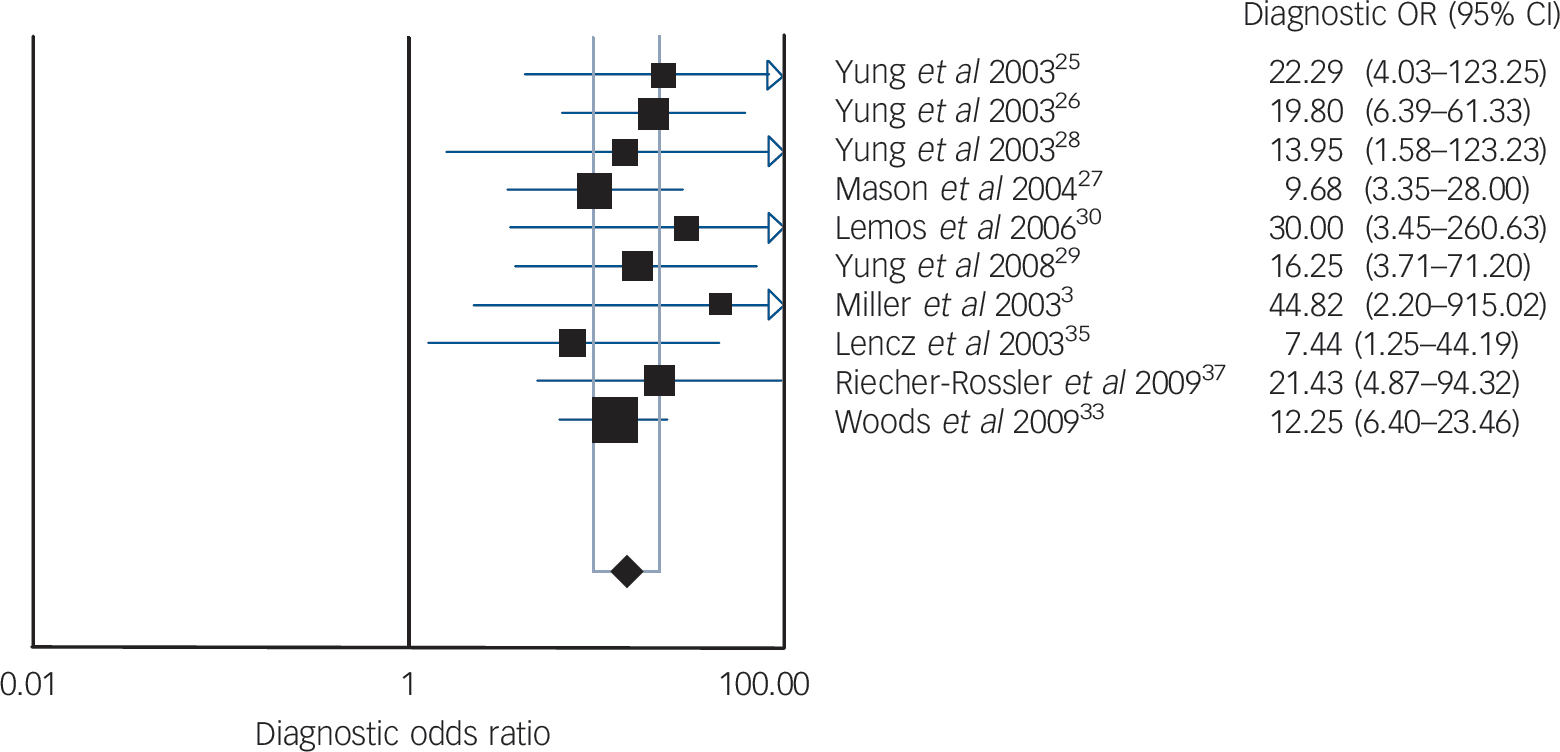
Fig. 2 Diagnostic odds ratio (OR) for ultra-high-risk criteria.
Random effects model: pooled diagnostic OR = 14.32 (95% CI 9.57–21.44). Cochran Q = 3.15, d.f. = 9, P = 0.9581. Inconsistency I = 0.0%, τ = 0.0000.
using ultra-high-risk criteria, which had an average follow-up of 18.6 months. The psychometric attributes of basic-symptoms criteria need to be subject to a much wider range of validation studies across different clinical settings and patient populations before its validity can be assumed.
The methodological quality of several studies was poor according to our main chosen criterion of masked application of a diagnostic gold standard. All studies Reference Miller, McGlashan, Rosen, Cadenhead, Ventura and McFarlane3,Reference Klosterkötter, Hellmich, Steinmeyer and Schultze-Lutter24–Reference Cannon, Cadenhead, Cornblatt, Woods, Addington and Walker31,Reference Woods, Addington, Cadenhead, Cannon, Cornblatt and Heinssen33–Reference Lencz, Smith, Auther, Correl and Cornblatt35,Reference Riecher-Rossler, Pflueger, Aston, Borgwart, Brewer and Gschwandtner37 did not specify whether investigators were masked to the results of the other test (index test or reference test; item 11 of the STARD checklist). All identified prospective studies Reference Miller, McGlashan, Rosen, Cadenhead, Ventura and McFarlane3,Reference Klosterkötter, Hellmich, Steinmeyer and Schultze-Lutter24–Reference Cannon, Cadenhead, Cornblatt, Woods, Addington and Walker31,Reference Woods, Addington, Cadenhead, Cannon, Cornblatt and Heinssen33–Reference Lencz, Smith, Auther, Correl and Cornblatt35,Reference Riecher-Rossler, Pflueger, Aston, Borgwart, Brewer and Gschwandtner37 were from specialised early detection assessment settings, which suggests selection bias and therefore makes it difficult to generalise these studies to the general population.
Implications
Findings from this systematic review suggest that ultra-high-risk and basic-symptoms criteria are valid tools in predicting the future development of schizophrenia among the ‘at-risk population’. More long-term studies need to be undertaken using the ultra-high-risk criteria to eliminate the possibility of false positives given the possible long duration of a prodromal state. The predictive validity of basic-symptoms criteria was supported by one study; we recommend future research applying the basic-symptoms criteria in different settings and cultures.
Acknowledgements
We are grateful to Professor Simon Gilbody for comments on an earlier draft of this manuscript. We also thank Professor Martin Bland for his comments and assistance with statistical methods used in the analysis of this study.


eLetters
No eLetters have been published for this article.