


Chronic adult-onset schizophrenia is associated with smaller whole thalamic volume Reference Adriano, Spoletini, Caltagirone and Spalletta1 and post-mortem findings point to selective thalamic deficits in the anterior and mediodorsal nuclei and the pulvinar. Reference Byne, Hazlett, Buchsbaum and Kemether2 The thalamus is a relay station that contains abundant efferent and afferent connections to the cortex. Therefore, structural alterations to the thalamus can cause a disruption in the thalamic–cortical–thalamic circuitry, leading to the typical psychosis-like cognitive and clinical symptoms. Reference Jones3 A recent meta-analysis concluded that few studies investigated thalamus deficits in individuals with first-episode psychosis. Reference Adriano, Spoletini, Caltagirone and Spalletta1 Given that antipsychotic medication may alter thalamic volume Reference Gur, Maany, Mozley, Swanson, Bilker and Gur4 it makes sense to measure thalamic volume in individuals with first-episode psychosis, particularly in adolescents with a short duration of illness and low doses of antipsychotic medication. Furthermore, studying these early-onset groups provides information about whether the thalamic abnormalities seen in adolescents are consistent with or different from the ‘adult’ expression of these disorders. Reference Frazier, Hodge, Breeze, Giuliano, Terry and Moore5 Early-onset psychosis will convert into different diagnostic categories, such as adolescent-onset schizophrenia and early-onset bipolar I disorder, over time. These diagnoses may share some degree of underlying pathology as evidenced by common volume deficits in cortical structures such as the insular, anterior cingulate and orbitofrontal cortex Reference Janssen, Reig, Parellada, Moreno, Graell and Fraguas6 and subcortical structures such as the hippocampus. Reference Frazier, Chiu, Breeze, Makris, Lange and Kennedy7 A smaller thalamic volume has been found in early-onset schizophrenia Reference Kumra, Giedd, Vaituzis, Jacobsen, McKenna and Bedwell8 although the results for early-onset bipolar disorder are inconsistent. Reference Dasari, Friedman, Jesberger, Stuve, Findling and Swales9,Reference Terry, Lopez-Larson and Frazier10 In adolescents with psychosis it is unclear whether volumetric thalamic abnormalities are specific to particular thalamic nuclei as opposed to affecting the entire thalamus uniformly. In this study we examined total and regional thalamus volume between male adolescents (younger than 18 years of age) with early-onset first-episode psychosis (duration of positive symptoms less than 6 months) and healthy male controls. This study sample eliminates the potentially confounding effects of gender.
Method
Participants
The participants were 80 males: 46 with first-episode psychosis (psychosis group) and 34 healthy controls (control group). The psychosis group were recruited from the two child and adolescent psychiatry in-patient units in Madrid (Hospital General Universitario Gregorio Marañón and Hospital Universitario Infantil Niño Jesús). These two units serve a population of approximately five million people. All males consecutively seen at these facilities between April 2002 and November 2005 who fulfilled the inclusion criteria described below were invited to participate in the study. At baseline, 58 individuals were eligible for the study. Seven of these refused the magnetic resonance imaging (MRI) scan because of fear. Furthermore, two individuals were excluded because of insufficient image quality for neuroimaging analyses. At follow-up, three participants were excluded because they no longer fulfilled diagnostic inclusion criteria for psychosis (see Clinical assessment), thus leaving a sample of 46 individuals. The inclusion criteria for the psychosis group were: male, presence of positive psychotic symptoms within a DSM-IV 11 psychotic disorder (including schizophrenia, bipolar I disorder, schizoaffective disorder, schizophreniform disorder, delusional disorder, shared psychotic disorder, brief psychotic disorder, psychotic disorder not otherwise specified (NOS), major depression with psychotic features) before the age of 18 years and a maximum 6-month history of positive symptomatology at the time of enrolment. Exclusion criteria were: presence of other concomitant Axis I disorder at the time of evaluation that might account for the psychotic symptoms (such as autism-spectrum disorders, post-traumatic stress disorder or acute stress disorder), mental retardation per the DSM-IV criteria, including not only an IQ score Reference Wechsler12,Reference Wechsler13 below 70 but also impaired functioning, neurological disorders, and a history of head trauma with loss of consciousness. We excluded individuals that fulfilled criteria for presence of substance misuse or dependence at baseline. All potential participants had a careful assessment of drug-use history and drug urine analysis at baseline. If the assessment was positive individuals were included in the study only if positive symptoms persisted 14 days after a negative urine analysis. Six individuals had a history of cannabis use at baseline, but the distribution of their thalamus volumes within the psychosis group was even (not biased to smaller or larger values). Urine test analyses were repeated at various time points during a 2-year clinical follow-up. All participants in the psychosis group had a thorough medical examination as part of our standard clinical guidelines protocol.
The control group consisted of 34 healthy males recruited from the same schools and residential areas as the psychosis group. The inclusion criteria for controls were similar age and coming from the same geographical areas as those in the psychosis group, no current and previous psychiatric disorder as measured by the Kiddie Schedule for Affective Disorders and Schizophrenia, Present and Lifetime version (K-SADS-PL), Reference Kaufman, Birmaher, Brent, Rao, Flynn and Moreci14 and no neurological disorders, or head trauma or mental retardation (per the DSM-IV criteria). Further information regarding the inclusion and exclusion criteria can be found in Castro-Fornieles et al. Reference Castro-Fornieles, Parellada, Gonzalez-Pinto, Moreno, Graell and Baeza15
The study was approved by the institutional review boards of both participating clinical centres. After the study was thoroughly explained to the participants, written informed consent was obtained from both the legal representatives and the individuals. All of the participants met MRI safety criteria.
Clinical assessment
Diagnosis was made according to the DSM-IV criteria using the K-SADS-PL. Clinical diagnostic interviews were performed during the initial hospitalisation by four experienced psychiatrists trained in this interview. Diagnostic consensus was reached in cases where presence or absence of psychiatric diagnoses was in doubt. Psychotic symptoms were assessed using the validated Spanish version of the Positive and Negative Syndrome Scale (PANSS). Reference Kay, Fiszbein and Opler16 Four psychiatrists participated in the PANSS rating. Single-rater intraclass correlation coefficients for the PANSS ratings were calculated separately for the fixed set of four psychiatrists by comparing each psychiatrist with a gold standard on a randomly selected sample of ten participants. Reference Bartko17 Intraclass correlation coefficients ranged from 0.72 to 0.96. Given that among early-onset first-episode psychoses most diagnostic changes occur during the first year after onset of positive symptoms, we used a 2-year follow-up diagnosis to ensure diagnostic reliability. Reference Fraguas, de Castro, Medina, Parellada, Moreno and Graell18 At baseline, 9 participants had schizophrenia, 11 had bipolar I disorder, and 29 had another psychotic disorder. At the 2-year follow-up, 13 participants had schizophrenia, 17 had bipolar I disorder and 16 had another psychotic disorder (5 individuals with schizoaffective disorder, 2 with schizophreniform disorder, 1 with major depression with psychotic features, 6 with psychotic disorder NOS and 2 with brief psychotic disorder). Three participants were excluded from the study because they did not fulfil K-SADS-PL criteria for psychosis at the 2-year follow-up, leaving a total sample size of 46 individuals in the psychosis group. The parental socioeconomic status was measured using the Hollingshead–Redlich scale. Reference Hollingshead and Redlich19 Assessment of handedness was performed as described in Castro-Fornieles. Reference Castro-Fornieles, Parellada, Gonzalez-Pinto, Moreno, Graell and Baeza15
The age at onset of psychosis was defined as the age at which the participant experienced positive psychotic symptoms for the first time (delusions or hallucinations of any kind that qualify for a DSM-IV diagnosis). Information about age at onset was assessed using the K-SADS-PL interview by asking the individual and their parents/legal guardians retrospectively about the first appearance of delusions and/or hallucinations. The individual and parents/legal guardians were interviewed separately. If possible, other relatives that were not present at the interview were consulted for confirmation of the gathered information about age at onset. Duration of psychosis was defined as the time difference between age at onset of psychosis and scan acquisition. Duration of treatment was defined as the time between initiation of antipsychotic treatment and scan acquisition.
Medication
At the time of the baseline assessment, all of those in the psychosis group were on antipsychotic medication. In total 80% (n = 39) of the sample (n = 49) were receiving only one antipsychotic, and the remaining 20% (n = 10) were receiving two antipsychotics simultaneously. With the exception of two individuals, the group were receiving a second-generation antipsychotic. Distribution of the antipsychotic treatment was as follows: 51% (n = 25) risperidone, 33% (n = 16) quetiapine, 29% (n = 14) olanzapine, 4% (n = 2) ziprasidone, and 4% (n = 2) haloperidol. The chlorpromazine equivalent dose was calculated from the dose of antipsychotics received (Table 1). Reference Woods20 The mean daily antipsychotic dose in chlorpromazine equivalents was 282.4 mg (s.d. = 194.7).
MRI Acquisition
All participants were scanned on the same 1.5 T Philips MRI scanner (Philips Gyroscan; Philips Medical Systems, Best, The Netherlands). Two magnetic resonance sequences were applied to all the participants: a T 1-weighted, three-dimensional, gradient echo scan with 1.5 mm slice thickness (echo time (TE) = 4.6 ms, repetition time (TR) = 9.3 ms, flip angle 30°, field of view (FOV) = 256 mm, and in-plane voxel size 0.98 × 0.98 mm2) and a T 2-weighted turbo spin echo scan with 3.5 mm slice thickness (turbo factor 15, TE = 120 ms, TR = 5809 ms, FOV = 256 mm, and in-plane voxel size 0.98 × 0.98 mm2). Both T 1- and T 2-weighted images were used for clinical neurodiagnostic evaluation by an independent neuroradiologist. No participants showed clinically significant brain pathology.
Image analysis
Intracranial volume assessment
The assessment of intracranial volume has been described before. Reference Janssen, Reig, Parellada, Moreno, Graell and Fraguas6 Brain-extracted images were obtained using the Fmrib Software Library (FSL)-Brain Extraction Tool (version 2) algorithm, Reference Smith21 and then manually edited to remove remaining non-intracranial tissue voxels using in-house Unix software. Reference Desco, Pascau, Reig, Gispert, Santos and Benito22
Whole thalamic volume assessment
Assessment of thalamic volume was performed by using the FreeSurfer (v4.4. http://surfer.nmr.mgh.harvard.edu) package. Reference Fischl, Salat, Busa, Albert, Dieterich and Haselgrove23 To confirm that our volume findings were independent of the preprocessing method, automated assessment of thalamus volume was also performed using the FSL-FIRST (v4.1.4) package. Reference Patenaude, Smith, Kennedy and Jenkinson24 In the current study we focus on the volumes obtained by FreeSurfer. The pattern of detected group differences was similar when using the FSL-FIRST and FreeSurfer methods. Both methods detected a significant volume reduction in the psychosis group and both methods found larger volume differences for the right compared with the left side. This is detailed in online supplement 1. Thalamus segmentation using FreeSurfer has been validated through comparison with manual tracing and has been used before in studies assessing thalamic volume. Reference Fischl, Salat, Busa, Albert, Dieterich and Haselgrove23 Automatic segmentation by FreeSurfer is done by automatic labelling of subcortical tissue classes using an atlas-based Bayesian segmentation procedure. FreeSurfer comes with a participant-independent probabilistic atlas in Talairach space that was pre-computed from a training set of individuals whose brains were manually labelled. FreeSurfer image preprocessing steps included an affine registration with Talairach space, intensity normalisation, skull strip and a high dimensional non-linear volumetric alignment to the probabilistic atlas in Talairach space. Importantly, as normalisation into Talairach space is an internal component of the FreeSurfer pipeline, the thalamic segmentations are returned in the native space of the individual. FreeSurfer calculated the probability of a class at each voxel location as the probability that the given class appeared at that location in the training set × the likelihood of getting the participant-specific intensity value from that class. An initial segmentation was generated by assigning each point to the class for which the above probability was greatest. The neighbourhood function was then used to recalculate the class probabilities and re-segment the data using the new class probabilities. This procedure was repeated until the result converged. Reference Fischl, Salat, Busa, Albert, Dieterich and Haselgrove23 FreeSurfer assessment of thalamus volume follows neuroanatomical criteria described in Frazier et al. Reference Frazier, Chiu, Breeze, Makris, Lange and Kennedy7 Briefly, the criteria state that assessment includes all thalamic nuclei except for lateral and medial geniculate bodies. The medial border is the third ventricle, cerebrospinal fluid (CSF) or the cerebral exterior midline. The lateral border is the internal capsule. The anterior border is the interventricular foramen (foramen of Monroe), and posteriorly the thalamus overlaps the midbrain and is bordered by CSF. The inferior border is the hypothalamic fissure, or the hippocampus in the most posterior extent. Superiorly the thalamus assessment is bordered by the transverse cerebral fissure, lateral ventricle, white matter, or in the anterior portion, the caudate. All segmentations were found accurate after visual inspection.
Regional thalamic volume assessment
Regional thalamic volume was assessed by generating thalamic surfaces based on Spherical Harmonics Decomposition Point Distribution Models (SPHARM-PDM) (v1.8, www.nitrc.org/projects/spharm-pdm). Reference Brechbuhler, Gerig and Kubler25,Reference Styner, Oguz, Xu, Brechbuehler, Pantazis and Levitt26 This method has been used before in studies investigating regional subcortical volume deficits in people with late-life depression, Alzheimer’s disease, schizophrenia and individuals at increased genetic risk for schizophrenia. Reference Gerardin, Chetelat, Chupin, Cuingnet, Desgranges and Kim27–Reference Zhao, Taylor, Styner, Steffens, Krishnan and MacFall30 The purposes of SPHARM-PDM are: to establish a correspondence between the thalamic surfaces of individuals in an unbiased way, i.e. without using a template (other than for alignment and flipping); to provide a uniform sampling across the surfaces, such that subsequent statistical tests are valid; and to smooth the surfaces by removing high-frequency contributions. Using the method, three parameters are defined by the user: a voxel resolution, SPHARM degree and subdivision level. For the current study an isotropic voxel resolution of 0.5 mm, a SPHARM-PDM degree of 15, and a subdivision level of 10 was chosen. To ensure that our choice for the three parameters was adequate we investigated the effect of modifications of these three parameters on the SPHARM-PDM-based thalamus surface; this is detailed in online supplement 2.
The inputs for the method were the thalamus segmentations generated by FreeSurfer. The pipeline consisted of the following steps: first, the three-dimensional thalamus masks were resampled to an isotropic voxel resolution and processed to fill any isolated empty voxels inside the mask. These masks were then converted to boundary surface meshes, and a spherical parameterisation was computed from the mesh using an area-preserving, distortion-minimising spherical mapping. Reference Brechbuhler, Gerig and Kubler25 Second, the surfaces of the masks were represented on the sphere in terms of SPHARM-based shape descriptions. Reference Styner, Oguz, Xu, Brechbuehler, Pantazis and Levitt26 These shape descriptions characterise the surfaces by sets of coefficients weighting the SPHARM basis functions, i.e. the SPHARM coefficients, up to a certain SPHARM degree. Using the first-order ellipsoid from the SPHARM coefficients, the spherical parameterisations of all participants were aligned to establish correspondence across the surfaces. This alignment was achieved by rotation of the parameterisation, such that the spherical equator, 0° and 90° longitudes coincide with those of the first-order ellipsoid. However, the first-order ellipsoid can be flipped along any of its axes with the same result. We therefore used a ‘flip’ template (the first surface of our sample, described by SPHARM coefficients) to test all possible flips along the first-order ellipsoid axis and select the one whose reconstruction had minimal distance to the ‘flip’ template. Third, the SPHARM-based surfaces of all participants were subdivided into an equal number of surface points (SPHARM-PDM) via an icosahedron subdivision level. Although each surface point has a one-to-one correspondence across participants, the surfaces are in the native image space. Therefore, the surfaces must all be aligned to a common space prior to investigating any group differences. To achieve this, a mean thalamus surface computed over all participant’s first-order ellipsoid-aligned thalamus surfaces was calculated. Thereafter the first-order ellipsoid-aligned SPHARM-PDM-based thalamus surfaces were aligned to the mean surface using Procrustes alignment (translation and rotation to minimise least-square residuals of corresponding three-dimensional points in the image). Reference Bookstein31 Finally, for the statistical analysis a mean SPHARM-PDM-based thalamic surface was estimated from the Procrustes aligned surfaces for each group separately.
Statistical analyses
Statistical analyses examined whether (a) demographic data, (b) intracranial volume, (c) total thalamus volume and (d) distances between the average thalamic surfaces were different between the psychosis group and the control group. Comparison four was performed on a point-by-point basis across the entire thalamic surface to address the specificity of regional thalamic volume changes in early-onset psychosis.
Demographic and clinical data
To test for group differences in demographic data, the Student’s t-test was used for the continuous variables and chi-square for discrete categorical variables.
Group-wise analysis of whole thalamus volume
To test whether whole thalamic volume reductions were associated with early-onset psychosis, we used the general linear model with diagnostic group (psychosis group, control group) as the independent variable. To test whether whole thalamic volume reductions were associated with schizophrenia or bipolar disorder, we used the general linear model with diagnostic group (schizophrenia, bipolar disorder) as the independent variable. Left and right thalamic volumes were included as repeated measures to evaluate possible interactions between diagnosis and hemisphere. Intracranial volume and age were included as covariates in the analyses as they are known to be related to structural brain measures. Chlorpromazine equivalent dose was examined as a potential covariate but not included because of a lack of significance, i.e. it did not correlate with whole or regional
TABLE 1 Demographic and clinical variables of the adolescent males with early-onset psychosis and the adolescent male controls
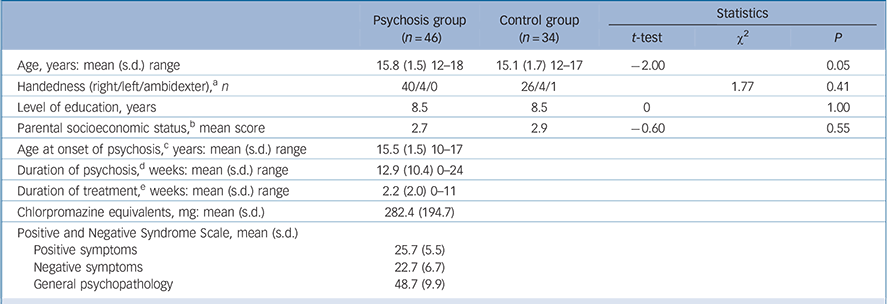
| Psychosis group (n = 46) | Control group (n = 34) | Statistics | |||
|---|---|---|---|---|---|
| t-test | χ 2 | P | |||
| Age, years: mean (s.d.) range | 15.8 (1.5) 12–18 | 15.1 (1.7) 12–17 | –2.00 | 0.05 | |
| Handedness (right/left/ambidexter), a n | 40/4/0 | 26/4/1 | 1.77 | 0.41 | |
| Level of education, years | 8.5 | 8.5 | 0 | 1.00 | |
| Parental socioeconomic status, b mean score | 2.7 | 2.9 | –0.60 | 0.55 | |
| Age at onset of psychosis, c years: mean (s.d.) range | 15.5 (1.5) 10–17 | ||||
| Duration of psychosis, d weeks: mean (s.d.) range | 12.9 (10.4) 0–24 | ||||
| Duration of treatment, e weeks: mean (s.d.) range | 2.2 (2.0) 0–11 | ||||
| Chlorpromazine equivalents, mg: mean (s.d.) | 282.4 (194.7) | ||||
| Positive and Negative Syndrome Scale, mean (s.d.) | |||||
| Positive symptoms | 25.7 (5.5) | ||||
| Negative symptoms | 22.7 (6.7) | ||||
| General psychopathology | 48.7 (9.9) | ||||
a Missing data for five participants.
b Parental socioeconomic status was measured using the Hollingshead–Redlich scale.
c Age at onset of psychosis was defined as the age at which positive symptoms appeared for the first time.
d The duration of psychosis was defined as the time between first appearance of positive symptoms and scan acquisition. Missing data for one participant.
e The duration of treatment was defined as the time between start of antipsychotic treatment and scan acquisition.
thalamic volume. Effect size is given as Cohen’s d. For all analyses, we inspected the distribution of the dependent measures to ensure they did not deviate from normality.
Group-wise analysis of regional thalamus volume
To test for regional thalamic volume differences, shapeAnalysisMANCOVA (version 1.0) (http://www.nitrc.org/projects/shape_mancova) was used. Reference Looi, Walterfang, Styner, Svensson, Lindberg and Ostberg32–Reference Walterfang, Looi, Styner, Walker, Danek and Niethammer34 ShapeAnalysisMANCOVA uses a permutation-based approach to compute the local significance values. At each permutation a general linear model-based MANCOVA metric (the Hotelling trace coefficient) is computed for every surface (x,y,z) coordinate, which constitutes the local statistic value of the group difference. The distributions sampled via the permutation approach yield the local P-values. This nonparametric approach allows testing for significance even if the surface coordinates are not normally distributed. Reference Paniagua, Styner, Macenko, Pantazis and Niethammer33 Intracranial volume and age were included as covariates in the tests. There were 1002 surface points. Owing to the 1002 comparisons, a correction for multiple comparisons was necessary. ShapeAnalysisMANCOVA outputs two results that are corrected for multiple comparisons, false discovery rate (FDR with q = 0.05) corrected results Reference Genovese, Lazar and Nichols35 and Bonferroni corrected results. The magnitude in millimetres and direction (i.e. surface inflation or deflation) of the distances before and after correction for multiple comparisons were mapped onto the averaged left and right thalamic surface models of the entire group. To assess whether thalamic measures were related to clinical variables, correlation coefficients were computed.
Results
Demographic and clinical data
There were no significant group differences in handedness, years of education, and parental socioeconomic status (Table 1). Age was slightly older in the psychosis group. Intracranial volumes were not significantly different in the psychosis group compared with the control group (t = –0.56 (d.f. = 81), P = 0.58). Mean intracranial volumes for each group are shown in Table 2.
Whole thalamic volume
A main effect of diagnosis was observed for overall thalamic volumes after covarying for intracranial volume and age
TABLE 2 Intracranial volume and total left and right thalamus volume of the adolescent males with early-onset psychosis and controls
| Mean (s.d.) | ||
|---|---|---|
| Psychosis group (n = 46) | Control group (n = 34) | |
| Intracranial volume, cc | 1517.7 (112.2) | 1511.8 (115.0) |
| Thalamus volume, cc | ||
| Left | 8.5 (0.8) | 8.7 (0.8) |
| Right | 8.0 (0.7) | 8.3 (0.8) |
(F(1,76) = 5.68, P = 0.02, d = –0.35). No significant interactions with hemisphere were observed. That is, the psychosis group showed significant thalamic volume reductions in both the left and right hemispheres after correction for age and intracranial volume (left: F(1,76) = 3.78, P = 0.05, d = –0.29, right: F(1,76) = 6.57, P = 0.01, d = –0.41) (Fig. 1).
Comparing the schizophrenia and bipolar subgroups for overall thalamic volumes while covarying for intracranial volume and age gave no main effect of diagnosis (F(1,26) = 0.64, P = 0.43, d = –0.20) (Fig. 2).
Regional thalamic volume
Before correction for multiple comparisons, widespread bilateral regional thalamic volume differences were observed (online Fig. DS4).
Only right-sided regional differences survived correction for multiple comparisons (online Fig. DS5). Three clusters comprising a total of 24 surface points showed a significant surface deflation in the psychosis group that ranged from 0.39 to 1.05 mm after FDR correction. Mean surface deflation over the three clusters was 0.66 mm (s.d. = 0.20). Comparing the schizophrenia and bipolar subgroups revealed no significant differences in regional thalamic volumes after correction for multiple comparisons.
Correlation with clinical variables
Within the psychosis group, both total and regional thalamic measures were not significantly related to age at onset of
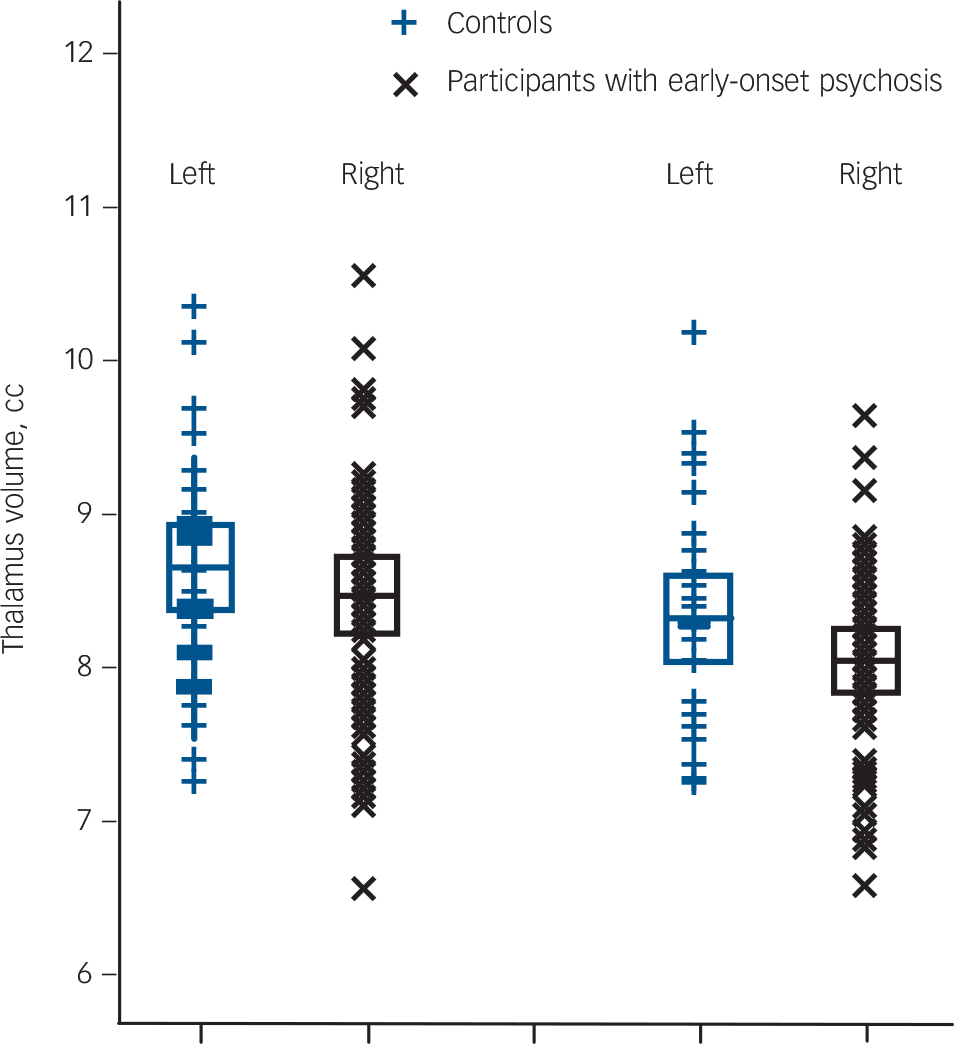
Fig. 1 Left and right total thalamus volume of the 46 adolescent males with early-onset psychosis and the 34 adolescent male healthy controls.
Values are in cm, the error bars represent 1 standard deviation. Thalamus volumes were obtained using FreeSurfer software (see the Method for details).
psychosis, duration of psychosis, duration of treatment and PANSS scores.
Discussion
The main findings of this study were, first, that male adolescents with early-onset first-episode psychosis showed a bilateral whole thalamus volumetric deficit. Second, the psychosis group demonstrated statistically significant right-sided regional thalamic volume differences in areas corresponding to the anterior mediodorsal and pulvinar nuclei when compared with the control group.
Whole thalamus volume
Our findings are congruent with previous MRI reports of smaller total thalamus volume in adolescents with early-onset schizophrenia. Reference Frazier, Hodge, Breeze, Giuliano, Terry and Moore5,Reference Kumra, Giedd, Vaituzis, Jacobsen, McKenna and Bedwell8,Reference Dasari, Friedman, Jesberger, Stuve, Findling and Swales9,Reference Ellison-Wright and Bullmore36 For early-onset bipolar disorder prior findings are inconsistent. Reference Frazier, Hodge, Breeze, Giuliano, Terry and Moore5,Reference Dasari, Friedman, Jesberger, Stuve, Findling and Swales9,Reference Chang, Karchemskiy, Barnea-Goraly, Garrett, Simeonova and Reiss37 The present study contrasts with previous early-onset bipolar disorder reports in that those studies examined mixed diagnostic samples including individuals with non-psychotic bipolar disorder and individuals with a longer duration of illness and extensive medicinal treatment, including lithium. These differences, in particular the prolonged use of medication, may explain the discrepancy in results because exposure to typical and atypical antipsychotics was shown to have rapid opposite effects on thalamic volume in adults with first-episode psychosis and schizophrenia and cerebral biochemical changes were found after treatment with lithium and risperidone in early-onset bipolar disorder. Reference Terry, Lopez-Larson and Frazier10,Reference Dazzan, Morgan, Orr, Hutchinson, Chitnis and Suckling38 These results indicate that prolonged medication use can change cerebral structure. The current results denote that volumetric thalamic deficits are present shortly after symptom onset in minimally treated adolescents with psychosis who go on to develop schizophrenia and bipolar I disorder.
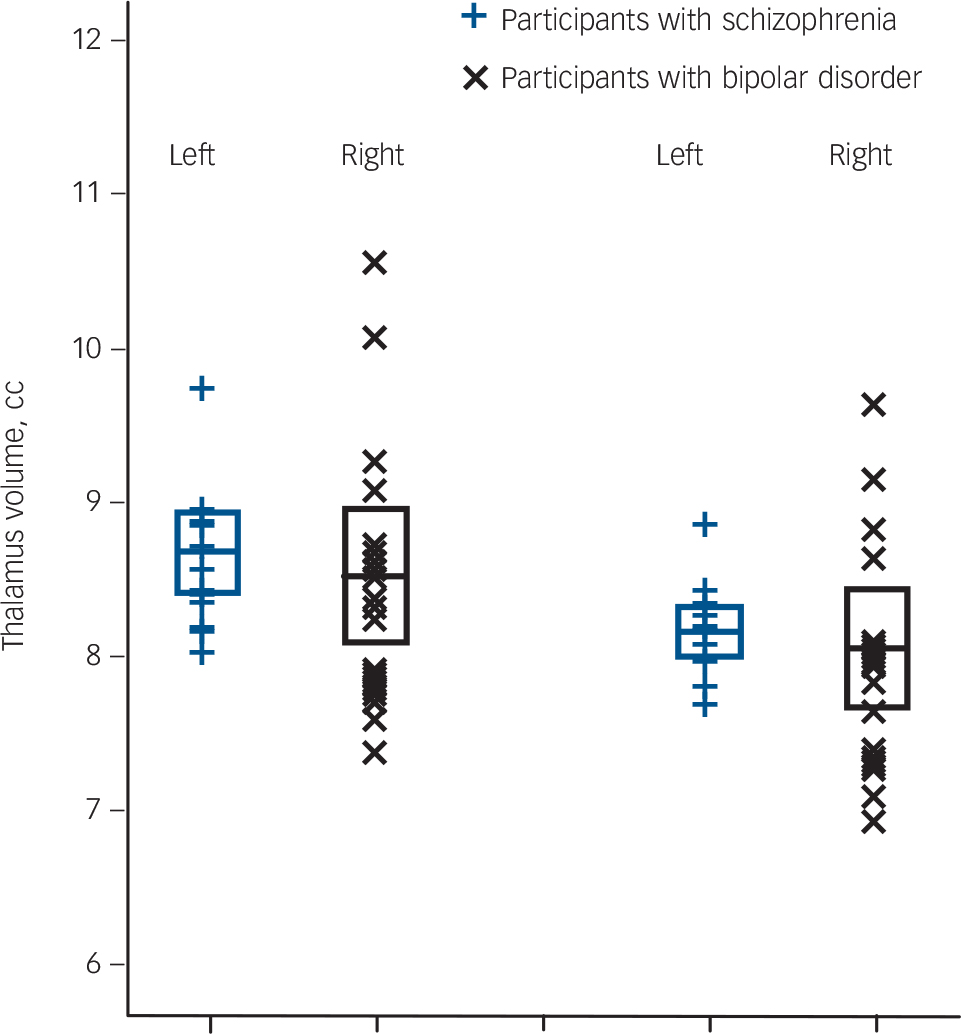
Fig. 2 Left and right total thalamus volume of 13 adolescent males with schizophrenia and 17 adolescent males with bipolar I disorder.
Values are in cm, the error bars represent 1 standard deviation. Thalamus volumes were obtained using FreeSurfer software.
Although there was no interaction between diagnosis and hemisphere, the effect size of the left side was lower compared with the right side. The effect of limited sample sizes on detection of subtle thalamic volume differences has been noted and may also be a plausible explanation for the difference in effect sizes. Reference Byne, Hazlett, Buchsbaum and Kemether2 Arole for brain asymmetry in the aetiology of psychosis has been suggested but larger left than right thalamus volumes and the reverse have been reported, making it difficult to conclude whether lateralised thalamus volume deficits have any role in this pathology. Reference Gur, Maany, Mozley, Swanson, Bilker and Gur4,Reference Crow39,Reference Flaum, Swayze, O'Leary, Yuh, Ehrhardt and Arndt40
Regional thalamus volume
The surface-based analysis showed statistically significant regional volume differences in the anterior mediodorsal and pulvinar regions between those in the psychosis group and the control group. The psychosis group showed surface deflation relative to the control group in these areas, which indicates a smaller volume. Structural abnormalities in these regions, including reduced volume, have been reported in post-mortem and in in vivo MRI studies in medicated and medication-naive adults with first-episode psychosis and schizophrenia. Reference Coscia, Narr, Robinson, Hamilton, Sevy and Burdick41,Reference Harms, Wang, Mamah, Barch, Thompson and Csernansky42 As can be seen in online Fig. DS1, the statistically uncorrected maps indicated widespread bilateral differences between the psychosis group and the control group, including anterior and pulvinar regions. These results must, however, be interpreted with caution as they are not appropriately corrected for multiple comparisons.
Anterior mediodorsal thalamic region and pulvinar
The thalamus is an important hub in the communication network between distinct associative cortical areas. With regard to psychosis, the anterior mediodorsal and pulvinar regions combined occupy approximately one-third of the total thalamus volume and both anterior and posterior thalamic regions have abundant reciprocal connections with the prefrontal, temporal, parieto-occipital and the entorhinal cortex. Reference Behrens, Johansen-Berg, Woolrich, Smith, Wheeler-Kingshott and Boulby43,Reference Romanski, Giguere, Bates and Goldman-Rakic44 Functional and structural prefrontal impairments are hallmark deficits of psychosis. These deficits may be associated with the regional structural thalamic impairments seen in the current study. In an explorative analysis we found significantly smaller prefrontal cortex volume in individuals with early-onset psychosis when compared with controls, although prefrontal cortex volume and thalamus volume were not correlated (results not shown). A relationship between prefrontal structural impairment and thalamic impairment thus remains speculative but evidence in favour of such a relationship is coming from studies measuring the integrity of prefrontothalamic white matter connections using diffusion tensor imaging. These studies show that smaller volume of prefrontal grey matter structures is associated with deficits of the adjoining corticothalamic white matter tracts in adolescents with first-episode schizophrenia. Reference Douaud, Smith, Jenkinson, Behrens, Johansen-Berg and Vickers45 Furthermore, changes in prefrontal dopaminergic neurotransmission are marked in individuals with psychosis and recent studies in humans and non-human primates have shown that the anterior mediodorsal area is a thalamic region with a particularly high level of dopaminergic innervation. Reference Garcia-Cabezas, Rico, Sanchez-Gonzalez and Cavada46 Dopaminergic projections to the thalamus and prefrontal cortex have the same origin and the thalamic and prefrontal regions that receive these projections are highly reciprocally connected. Speculatively, alterations in prefrontal dopaminergic neurotransmission may thus influence dopaminergic receptivity in the thalamic anterior mediodorsal region that could lead to impairment of corticothalamic circuits in individuals with psychosis. Reference Alelu-Paz and Gimenez-Amaya47
Thalamic structural abnormalities in adolescents with early-onset psychosis, together with findings of smaller thalamus volume in young individuals with an increased genetic risk for psychosis, suggest that thalamic volumetric deficits are a vulnerability marker for the disease. Reference Ettinger, Picchioni, Landau, Matsumoto, van Haren and Marshall48 This interpretation is supported by longitudinal studies that have reported baseline thalamic volume deficits to be non-progressive, Reference James, James, Smith and Javaloyes49 although others have not replicated this. Reference Rapoport, Giedd, Kumra, Jacobsen, Smith and Lee50 In the current study, the reported effect sizes for whole thalamic volume reduction are small to moderate (Cohen’s d –0.3 to –0.4). These effect sizes are comparable with previous meta-analytically estimated effect sizes for reduction of thalamus and hippocampal volume but considerably lower than effect sizes of increased lateral ventricle volume (d = 0.7) in adults with first-episode and chronic schizophrenia. Reference Adriano, Spoletini, Caltagirone and Spalletta1,Reference Wright, Rabe-Hesketh, Woodruff, David, Murray and Bullmore51 The cross-sectional design of the current study impedes an interpretation as to whether thalamic volume deficits represent increased sensitivity for psychosis or whether the deficits are a consequence of psychosis or related variables.
Regarding the effect of patient subgroups, we know of only two prior studies that compared volume of subcortical brain structures between youths with early-onset bipolar disorder, schizophrenia and healthy controls. Reference Frazier, Hodge, Breeze, Giuliano, Terry and Moore5,Reference Janssen, Reig, Parellada, Moreno, Graell and Fraguas6 Frazier et al Reference Frazier, Hodge, Breeze, Giuliano, Terry and Moore5 reported a smaller right-sided thalamic volume in the schizophrenia group whereas the other study did not find a group difference in thalamic volume. Reference Janssen, Reig, Parellada, Moreno, Graell and Fraguas6 In the current study no group differences were found between the bipolar and schizophrenia subgroups. Recent and older meta-analyses indicate a modest effect size (Cohen’s d =0.4) for thalamicvolumereduction in schizophrenia. Reference Adriano, Spoletini, Caltagirone and Spalletta1,Reference Konick and Friedman52 Therefore the reduced sample size when comparing patients only is too small to detect differences of d = 0.4 with high statistical power.
Limitations
There are several limitations to this study. First, we did not have manual tracings of the thalamus to use as a gold standard in order to estimate the accuracy of the automated segmentations. However, volume differences between groups were confirmed by two different automated methods, thus strengthening the reliability of our findings. Second, the patient subgroups comparison suffers from insufficient statistical power because of the small sample sizes. Third, post-mortem studies are necessary in relating markers to the underlying disease process and the ultimate proof can only be provided by pathological validation of these markers.
Funding
This study is supported by the Instituto de Salud Carlos III, the Juan de la Cierva Program of the Spanish Ministry of Science and Innovation, the Fundación Alicia Koplowitz, and Caja Navarra. Part of the computations of this work was done at the ‘High Capacity Cluster for Physical Techniques’ of the Universidad Complutense de Madrid (UCM), funded in part by the European Union (Fondo Europeo de Desarrollo Regional program) and UCM.
Acknowledgements
The authors would like to thank all the study participants and their families.


eLetters
No eLetters have been published for this article.