


Data from different parts of the world indicate increasing prescriptions for drugs used for mental disorders, particularly antidepressants and antipsychotics. Data from the USA found an increase in the proportion of people prescribed antidepressants from 5.84% in 1996 to 10.12% in 2005. Reference Olfson and Marcus1 Recent data from New Zealand Reference Exeter, Robinson and Wheeler2 and Europe Reference Deambrosis, Chinellato, Terrazzani, Pullia, Giusti and Skaper3 also show substantial increases. Studies of antipsychotic prescribing show increases over the past two decades in a variety of countries. Reference Verdoux, Tournier and Begaud4 Use of stimulants has also increased in many parts of the world, including North America Reference Castle, Aubert, Verbrugge, Khalid and Epstein5 and Europe. Reference Knellwolf, Deligne, Chiarotti, Auleley, Palmieri and Boisgard6 It is not clear, however, whether there has been an overall increase in the use of prescribed psychopharmaceuticals, or whether there has been a compensatory reduction in the use of some classes of drugs, such as benzodiazepines.
The rising costs of prescription drugs has caused concern in many countries, 7,Reference Cunningham8 and can be accounted for both by wider usage and the use of more expensive drugs. Reference Zuvekas9 Data from the USA suggest that several types of psychiatric drug, notably antipsychotics, antidepressants and drugs for attention-deficit hyperactivity disorder (ADHD), have consistently ranked among the most costly classes of prescription drugs in the past few years, 10 and that costs of psychotropic medications have risen faster than costs of other drugs. Reference Zuvekas9
There is evidence that some psychiatric medications like antipsychotics are frequently prescribed ‘off-label’, for indications for which they have not had regulatory approval. Reference Verdoux, Tournier and Begaud4 In the USA, antidepressants are frequently prescribed to people who have no diagnosable mental disorder. Reference Olfson and Marcus1 In view of emerging evidence of the serious adverse effects associated with atypical antipsychotics Reference De Hert, Detraux, van Winkel, Yu and Correll11 and antidepressants, Reference Moret, Isaac and Briley12 as well as the financial costs of psychiatric medication, it would seem to be important to establish how these drugs are being used, and if their use is changing. In this paper, we examine trends in prescribing of all the major classes of drugs prescribed for mental disorders in England between 1998 and 2010, based on data on prescriptions issued in the community collected in the annual Prescription Cost Analysis survey. We compare trends in different classes of medication to establish whether there has been an overall increase in the use of medications for psychiatric disorders. We also examine the costs of different classes of drugs, and analyse the contribution of individual drugs within the major classes of psychiatric medication.
Method
The Prescription Cost Analysis provides details of the number of prescription items and the net ingredient cost of all National Health Service (NHS) prescriptions dispensed in the community in England. The data do not cover items dispensed in hospital or on private prescriptions (prescriptions issued by private practitioners to non-NHS patients). A prescription item is defined as a single drug prescribed by a doctor on a prescription form. The net ingredient cost refers to the cost of the drug before discounts and does not include any dispensing costs or fees. A breakdown of individual preparations dispensed according to dosage is also presented. The Prescription Cost Analysis is conducted annually by the government-funded NHS Information Centre, with data collated from submissions by dispensers for reimbursement of prescription costs. It is internally audited to 97.5% accuracy. 13 All data are published on the internet. 14
In the Prescription Cost Analysis, drugs are classified according to British National Formulary (BNF) 15 chapters, sections and paragraphs. We used these categories except for drugs used in psychosis and related disorders, Section 4.2, which we separated into ‘antipsychotics’ and drugs used in bipolar disorder, which we refer to as ‘mood stabilisers’ for convenience. Anti-psychotics included oral and depot preparations. We included lithium and valproic acid, which are listed in BNF Section 4.2, in the category of mood stabilisers, and we also added sodium valproate preparations from BNF Section 4.8.1 on ‘antiepileptics’. We included sodium valproate since it is the most commonly used anti-epileptic drug in psychiatric hospital practice, Reference Ventriglio, Vincenti, Centorrino, Talamo, Fitzmaurice and Baldessarini16 and data from other countries indicates a substantial increase in use of anti-epileptic drugs for psychiatric conditions. Reference Johannessen, Larsson, Rytter and Johannessen17 We did not include lamotrigine, despite indications that its use in mood disorders is increasing, Reference Johannessen, Larsson, Rytter and Johannessen17 or other anti-epileptic medications, including carbamazepine, because of uncertainty about the prevalence of their use for this indication in the UK. All prescriptions for quetiapine and olanzapine were included in ‘antipsychotic drugs’, although they are also licensed for use in bipolar disorder. All drugs were included in only one category.
For analysis and presentation of costs, we adjusted for inflation in years prior to 2010, using the inflation calculator from the Bank of England website. 18 We computed the proportion of total prescription numbers and costs accounted for by all psychiatric medication combined in both 1998 and 2010, and we examined the contribution made by different categories of psychiatric medication to prescriptions and costs in both years. We also examined trends in both prescriptions and costs of different categories of drugs over the whole 13-year period. We used linear regression analysis with year as the independent variable and prescription items or costs as the dependent variable, using data from each year. We calculated the average annual percentage increase by dividing the regression coefficient by the baseline prescriptions or cost from 1998. We also examined trends in the proportion of total prescriptions and costs accounted for by psychiatric medications.
Results
As shown in Table 1, psychiatric drugs made up 8.6% of all prescription items in 2010 compared with 8.3% in 1998. By 2010, psychiatric drugs accounted for 10% of all prescription drugs costs compared with 8.5% in 1998. Antidepressants were the most commonly prescribed form of psychiatric medication in both years, followed by hypnotic and anxiolytic drugs, and then antipsychotics. In terms of costs, antipsychotics overtook anti-depressants as the most costly class of psychiatric medication by 2010, accounting for 32% of costs of psychiatric medication in that year.
TABLE 1 Prescriptions and costs of psychiatric drugs 1998 and 2010
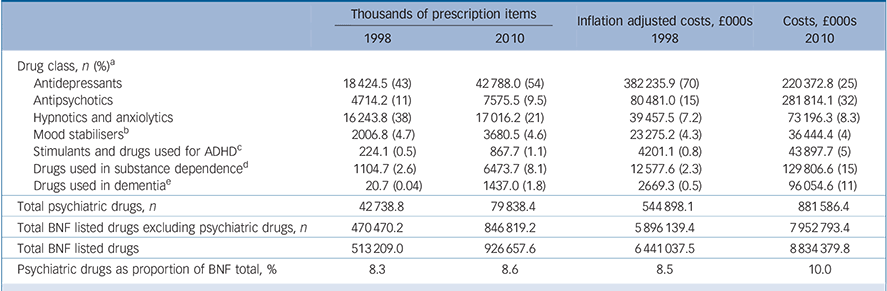
| Thousands of prescription items | Inflation adjusted costs, £000s | Costs, £000s | ||
|---|---|---|---|---|
| 1998 | 2010 | 1998 | 2010 | |
| Drug class, n (%)Footnote a | ||||
| Antidepressants | 18 424.5 (43) | 42 788.0 (54) | 382 235.9 (70) | 220 372.8 (25) |
| Antipsychotics | 4714.2 (11) | 7575.5 (9.5) | 80 481.0 (15) | 281 814.1 (32) |
| Hypnotics and anxiolytics | 16 243.8 (38) | 17 016.2 (21) | 39 457.5 (7.2) | 73 196.3 (8.3) |
| Mood stabilisersFootnote b | 2006.8 (4.7) | 3680.5 (4.6) | 23 275.2 (4.3) | 36 444.4 (4) |
| Stimulants and drugs used for ADHDFootnote c | 224.1 (0.5) | 867.7 (1.1) | 4201.1 (0.8) | 43 897.7 (5) |
| Drugs used in substance dependenceFootnote d | 1104.7 (2.6) | 6473.7 (8.1) | 12 577.6 (2.3) | 129 806.6 (15) |
| Drugs used in dementiaFootnote e | 20.7 (0.04) | 1437.0 (1.8) | 2669.3 (0.5) | 96 054.6 (11) |
| Total psychiatric drugs, n | 42 738.8 | 79 838.4 | 544 898.1 | 881 586.4 |
| Total BNF listed drugs excluding psychiatric drugs, n | 470 470.2 | 846 819.2 | 5 896 139.4 | 7 952 793.4 |
| Total BNF listed drugs | 513 209.0 | 926 657.6 | 6 441 037.5 | 8 834 379.8 |
| Psychiatric drugs as proportion of BNF total, % | 8.3 | 8.6 | 8.5 | 10.0 |
ADHD, attention-deficit hyperactivity disorder; BNF, British National Formulary.
a. Percentage is the % of all psychiatric prescription items.
b. Lithium plus sodium valproate and valproic acid.
c. Stimulants plus atomoxetine.
d. Acamprosate, disulfiram, bupropion, nicotine preparations, varenicline, buprenorphine, lofexidine, methadone, naltrexone.
e. Donepezil, galantamine, memantine, rivastigmine.
Regression analysis
The regression analysis presented in Table 2 indicates that overall, prescriptions for psychiatric medication increased by 6.8% (95% CI 6.4–7.3) per year on average between 1998 and 2010, which was in line with increases in all other prescription drugs. There were highly statistically significant upward trends in prescriptions of all classes of psychiatric medication, except for hypnotics and anxiolytics, which increased slightly, but not to a statistically significant degree. Antidepressants increased by an average of 10% (95% CI 9.0–11.1) a year, a total of 130% over the 13 years examined. Antipsychotic prescriptions increased by 5.1% (95% CI 4.3–5.9) per year on average, a total of 66.1%. Stimulants, drugs for substance misuse and anti-dementia drugs showed dramatic increases, but overall prescriptions were fewer. Figure 1 illustrates trends in the four major classes of psychiatric drugs: antidepressants, antipsychotics, hypnotics and anxiolytics, and mood stabilisers.
The cost of psychiatric medication rose by 4.9% (95% CI 2.3–7.5) per year on average between 1998 and 2010, a total of 63.7%, whereas costs of other prescription drugs rose by 2.6% (95% CI 0.96–4.3) or 33.8% overall. The proportion of costs represented by psychiatric drugs increased (P = 0.001) (Table 2). Costs of all classes of psychiatric drugs rose to a statistically significant degree, except for antidepressants, which fell, after peaking at £400 681 700 in 2004. Costs of antipsychotic drugs rose by 22% (95% CI 16.7–27.4) per year, a total of 286.4% over the 13 years.
Antipsychotics
Figure 2 shows trends in prescriptions for the most commonly prescribed antipsychotics. Thioridazine was the most commonly prescribed drug by a considerable margin, until the restrictions imposed on its use in late 2000. 19 In 2010, the bulk of antipsychotic prescribing was for olanzapine, quetiapine and risperidone, which accounted for 24%, 23% and 17% of anti-psychotic prescription items respectively. In terms of expenditure, olanzapine accounted for 42% of the total expenditure on anti-psychotics in 2010 and quetiapine accounted for 34%. The next largest was aripiprazole, costing 13% of the total despite only making up only 5% of the number of prescription items. Risperidone (oral and injectable) accounted for only 6% of the total expenditure in 2010, since the patent on oral preparations expired in 2007.
TABLE 2 Regression analysis of yearly trends in prescriptions and costs
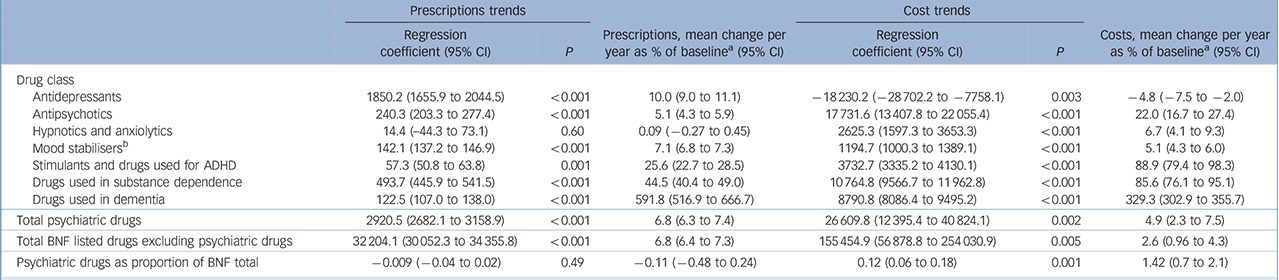
| Prescriptions trends | Cost trends | |||||
|---|---|---|---|---|---|---|
| Regression coefficient (95% CI) |
P | Prescriptions, mean
change per year as % of baselineFootnote a (95% CI) |
Regression coefficient (95% CI) |
P | Costs, mean change
per year as % of baselineFootnote a (95% CI) |
|
| Drug class | ||||||
| Antidepressants | 1850.2 (1655.9 to 2044.5) | <0.001 | 10.0 (9.0 to 11.1) | –18 230.2 (–28 702.2 to –7758.1) | 0.003 | –4.8 (–7.5 to –2.0) |
| Antipsychotics | 240.3 (203.3 to 277.4) | <0.001 | 5.1 (4.3 to 5.9) | 17 731.6 (13 407.8 to 22 055.4) | <0.001 | 22.0 (16.7 to 27.4) |
| Hypnotics and anxiolytics | 14.4 (–44.3 to 73.1) | 0.60 | 0.09 (–0.27 to 0.45) | 2625.3 (1597.3 to 3653.3) | <0.001 | 6.7 (4.1 to 9.3) |
| Mood stabilisersFootnote b | 142.1 (137.2 to 146.9) | <0.001 | 7.1 (6.8 to 7.3) | 1194.7 (1000.3 to 1389.1) | <0.001 | 5.1 (4.3 to 6.0) |
| Stimulants and drugs used for ADHD | 57.3 (50.8 to 63.8) | 0.001 | 25.6 (22.7 to 28.5) | 3732.7 (3335.2 to 4130.1) | <0.001 | 88.9 (79.4 to 98.3) |
| Drugs used in substance dependence | 493.7 (445.9 to 541.5) | <0.001 | 44.5 (40.4 to 49.0) | 10 764.8 (9566.7 to 11 962.8) | <0.001 | 85.6 (76.1 to 95.1) |
| Drugs used in dementia | 122.5 (107.0 to 138.0) | <0.001 | 591.8 (516.9 to 666.7) | 8790.8 (8086.4 to 9495.2) | <0.001 | 329.3 (302.9 to 355.7) |
| Total psychiatric drugs | 2920.5 (2682.1 to 3158.9) | <0.001 | 6.8 (6.3 to 7.4) | 26 609.8 (12 395.4 to 40 824.1) | 0.002 | 4.9 (2.3 to 7.5) |
| Total BNF listed drugs excluding psychiatric drugs | 32 204.1 (30 052.3 to 34 355.8) | <0.001 | 6.8 (6.4 to 7.3) | 155 454.9 (56 878.8 to 254 030.9) | 0.005 | 2.6 (0.96 to 4.3) |
| Psychiatric drugs as proportion of BNF total | –0.009 (–0.04 to 0.02) | 0.49 | –0.11 (–0.48 to 0.24) | 0.12 (0.06 to 0.18) | 0.001 | 1.42 (0.7 to 2.1) |
ADHD, attention-deficit hyperactivity disorder; BNF, British National Formulary.
a. % change was calculated by dividing the regression coefficient by baseline prescriptions or costs from 1998 as given in Table 1.
b. Lithium plus sodium valproate and valproic acid.
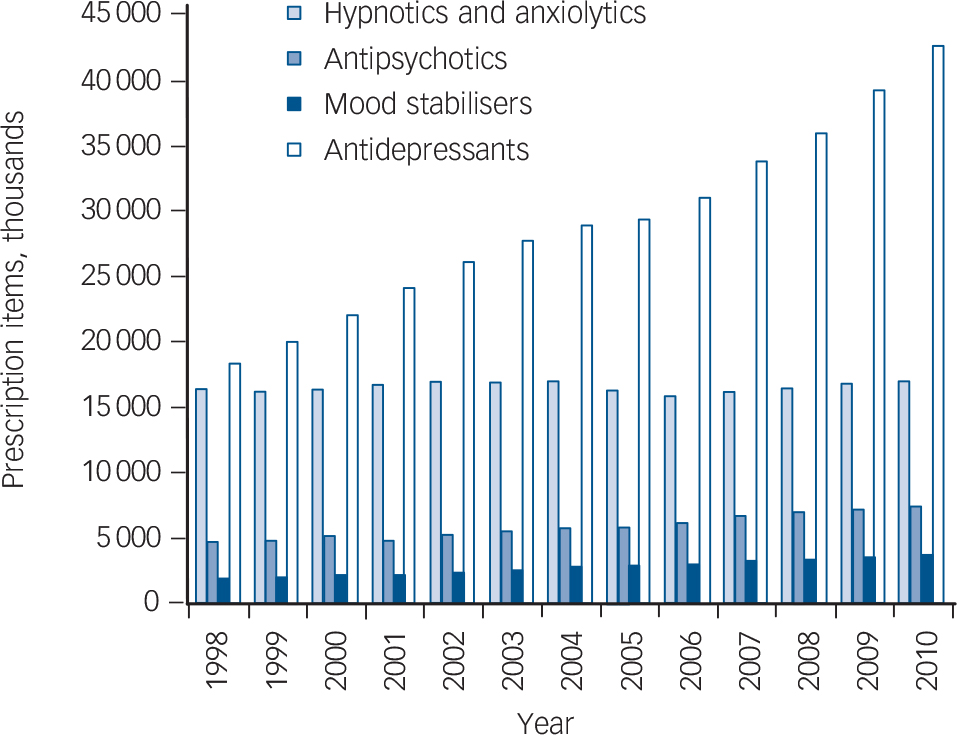
FIG. 1 Trends in prescriptions of major classes of psychiatric drugs 1998–2010.
Because of the high number of prescriptions for thioridazine in the late 1990s, we examined the dose of tablets prescribed. This does not indicate the overall dose prescribed, since we do not know how many of these tablets may have been prescribed to each individual, but the use of low-dose tablets is likely to indicate low overall doses where the normal therapeutic dose range is well above the quantity contained in the tablet. In 2000, 44% of tablets dispensed were 10 mg tablets, 37% were 25 mg, 14% were 50 mg and only 4% were 100 mg. The situation was only slightly different for chlorpromazine. In 2010, 46% of tablets dispensed were 25 mg, 34% were 50 mg and 20% were 100 mg. For haloperidol in 2010, 49% were 500 mcg tablets, 24% were 1.5 mg tablets and 26% were for 5 mg or 10 mg tablets. Preparations of olanzapine, quetiapine and risperidone were also predominantly low dose. For quetiapine, 54% of items were for 25 mg tablets, for olanzapine, 48% of items were for tablets of dose 5 mg or lower and 57% of risperidone prescriptions were for 1 mg or 500 mcg tablets.
Antidepressants
Figure 3 shows trends in individual antidepressants. In 1998, amitriptyline and dothiepin were the most commonly prescribed antidepressants, with fluoxetine and paroxetine being the most commonly prescribed selective serotonin reuptake inhibitors. In 2010, citalopram was the most commonly prescribed drug, followed by amitriptyline. Venlafaxine prescriptions reached a peak in 2004 and have since declined. In terms of costs, venlafaxine was the most costly drug in 2010, despite falling prescription numbers, accounting for 30% of total antidepressant spending in this year.

FIG. 2 Prescriptions items (thousands) of most commonly used antipsychotics 1998–2010.

FIG. 3 Prescription items (thousands) of most commonly used antidepressants 1998–2010.
Examining doses of amitriptyline dispensed in 2010 revealed that 52% of tablets dispensed were 10 mg, 32% were 25 mg and 15% were 50 mg. The situation was different for dothiepin, with equal proportions of 25 mg and 75 mg tablets.
Other drug categories
In the category of mood stabilisers, sodium valproate was more commonly prescribed than lithium in both 1998 and 2010, and showed the greatest increase over the period. Prescriptions for sodium valproate showed a highly statistically significant increase (b = 128.3, 95% CI 122.9–133.6, P<0.001), with an average increase of 9.6% (95% CI 9.2–10.0) per year, or 124.8% overall. Lithium prescriptions also increased by a highly significant amount (b = 14.7, 95% CI 13.6–15.8, P<0.001), with an average increase of 2.1% (95% CI 2.0–2.3) or 28.3% overall. Sodium valproate accounted for 96.5% of costs in 2010.
Diazepam was the most frequently prescribed hypnotics and anxiolytics drug in 1998, but was overtaken by the ‘Z’ drugs (zopiclone, zolpidem tartrate and zaleplon) in 2010. Prescriptions for ‘Z’ drugs combined increased significantly (b = 296.1, 95% CI 263.7–328.4, P<0.001), by 12.8% (95% CI 11.5–14.3) a year on average to 6 038 210 in 2010. Prescriptions of diazepam also rose by a significant amount (b = 77.7, 95% CI 47.5–107.9, P<0.001) to 5 148 360 items in 2010. The average yearly increase was 1.9% (95% CI 1.2–2.7), making a total increase of 25.3%. These rises were compensated for by a fall in prescriptions for nitrazepam and temazepam of around 3.5 million. The most costly drug in this class in 2010 was melatonin, which accounted for 22.4% of costs, followed by lorazepam (13.5%) and ‘Z’ drugs (12.6%).
Among stimulants and drugs for ADHD, methylphenidate was the most commonly prescribed drug over all years. Prescriptions increased significantly (b = 46.6, 95% CI 43.2–50.0, P<0.001) by 36.8% (95% CI 34.1–39.5) per year on average to 661 463 in 2010. In 2010, the majority of the cost in this class was accounted for by methylphenidate (57%), followed by modafinil (22%) and atomoxetine (18%).
Among drugs for substance misuse, methadone was the most frequently prescribed drug in both 1998 and 2010. Prescriptions increased significantly (b = 179.8, 95% CI 158.2–201.5, P<0.001) by 17.6% (95% CI 15.5–19.7) per year, reaching 3 012 419 prescription items by 2010. Prescription of nicotine replacement and varenicline also increased substantially over the period, reaching a total of 2 505 134 prescription items in 2010. Major contributors to the costs of these drugs in 2010 were methadone (27.8%), varenicline (25.0%), nicotine replacement (24.0%) and buprenorphine (16.7%).
Discussion
Limitations
The Prescription Cost Analysis provides comprehensive data on NHS community prescriptions and prescription costs in England, and is not based on a sample. However, the data consist of prescriptions issued, and there are no details of the indications for the prescriptions, nor about the people the prescriptions are issued to, either in terms of demographics or diagnosis. Rising prescriptions do not therefore necessarily indicate a rising number or proportion of medication users, since longer-term use and an increase in population size would also increase prescription numbers. The population of England increased from an estimated 49.5 million in 1998 to 52.2 million in 2010. This represents an increase of 2.7 million, or 5.5% of the 1998 value, an average annual increase of 0.42% during the period examined.
Data on dose, which we have used to provide some indication of how the drugs are used, is also limited by the fact that we do not know how many tablets of each strength are specified in each prescription.
The Prescription Cost Analysis only covers prescriptions issued in the community, and hence excludes drugs issued to patients in hospitals. Since psychiatric patients are hospitalised for longer periods than other patients, Reference Pillay and Moncrieff20 the data may underestimate total psychiatric medication use relative to use of other medication groups. It will particularly underrepresent the use and costs of antipsychotic drugs, since most long-term psychiatric in-patients will be taking these drugs.
The way we have categorised mood stabilisers is necessarily imprecise, since this is not a category used in the Prescription Cost Analysis. Including all prescriptions of sodium valproate will overestimate the use of this drug for mental disorders, since we could not distinguish prescriptions issued for the treatment of epilepsy. The exclusion of other anti-epileptics used for mental health conditions, however, is likely to have the opposite effect. The omission of lamotrigine, in particular, is likely to lead to an underestimate of the use of these drugs for psychiatric problems, since evidence from elsewhere indicates that it is increasingly prescribed for mood disorders. Reference Johannessen, Larsson, Rytter and Johannessen17 Some other drugs may also be used for non-psychiatric purposes, such as amitriptyline for chronic pain (see below) and diazepam for muscle spasm. Nevertheless, the current analysis is the first to examine data on all classes of psychiatric drugs, and to use statistical techniques to explore and compare trends over time.
Main findings
The current data indicate rising trends in prescriptions for psychiatric drugs, including antidepressants and antipsychotics, with no compensatory reduction in prescriptions for anxiolytics and hypnotics. The findings are consistent with data from other parts of the world showing rises in use of antidepressants and antipsychotics. Reference Olfson and Marcus1–Reference Verdoux, Tournier and Begaud4,Reference Arias, Lobato, Ortega, Velasco, Carvajal and del Pozo21–Reference Alexander, Gallagher, Mascola, Moloney and Stafford23 Some classes of drugs less commonly prescribed, including stimulants, drugs used in substance misuse and anti-dementia drugs have shown considerable increases over the past 13 years. The trends are in line with rises in prescriptions of drugs for all other medical conditions, but the costs of psychiatric medication have risen more rapidly, and psychiatric drugs currently make up a greater proportion of drug costs than they did in 1998. Antipsychotics have overtaken antidepressants as the most costly class of psychiatric drug, despite their lower prescription numbers, and two drugs, olanzapine and quetiapine currently account for three-quarters of these costs.
There are a number of possible explanations for the trends observed in prescriptions of psychiatric medications. Population increase may account for some of the rising trends, but at 0.4% per year, this is unlikely to explain the trends completely. Increased long-term prescribing may be a significant factor, and data from the UK General Practice database suggests that people with depression and schizophrenia are both receiving drug treatment for longer periods than before. Reference Moore, Yuen, Dunn, Mullee, Maskell and Kendrick24,Reference Osborn, Levy, Nazareth, Petersen, Islam and King25 The study of people with depression found no evidence that rates of diagnosis had increased, but other research indicates that more than 40% of antidepressant prescriptions are issued to people who are not diagnosed with depression, Reference Ornstein, Stuart and Jenkins26 and many antidepressants have been marketed for anxiety disorders over recent years. Data from the USA suggest that the majority of people receiving antidepressant prescriptions do not have a diagnosable mental disorder. Reference Olfson and Marcus1 The low dose of amitripyline preparations suggests that it may be employed as a non-specific sedative, consistent with evidence from the USA of the frequent use of sedative antidepressants for insomnia. Reference Lai, Tan and Lai27 Increasing rates of chronic pain may also contribute to the rising use of amitriptyline. Reference Freburger, Holmes, Agans, Jackman, Darter and Wallace28
There are no recommended levels of prescriptions for anti-depressants or other psychiatric medications, and the increasing prescriptions for antidepressants may reflect increasing awareness of depression and other mental disorders among the general public and prescribers that most would welcome. On the other hand, the size of the increase is considerable, at 10% per year, and, as well as concerns about overdiagnosis and treatment, the increase in long-term prescribing for people with depression is not likely to be beneficial for everyone, and may suggest that the drugs are difficult to stop, or that they are not being reviewed regularly. It is also notable that there has been no reduction in prescribing levels, as might have been expected, since the Increasing Access to Psychological Therapies (IAPT) programme was established in the UK in 2006, increasing the provision of cognitive–behavioural therapy for depression and other common mental health problems.
Trends in antipsychotic prescriptions may reflect longer duration of use by people diagnosed with schizophrenia and psychosis, including earlier treatment associated with early intervention services. An analysis of data from the UK General Practice research database from 1991 to 2000, however, found that less than 10% of new antipsychotic prescriptions were for people with psychosis, with 50% issued to people with anxiety or depression and 15% to people with dementia. Reference Kaye, Bradbury and Jick29 Evidence from other countries also suggests that antipsychotics are frequently prescribed to people who are not diagnosed with psychosis or schizophrenia. Reference Verdoux, Tournier and Begaud4 In the USA in 2008, only 24% of visits resulting in a prescription of an atypical antipsychotic involved people with a diagnosis of schizophrenia, see for example Alexander et al. Reference Alexander, Gallagher, Mascola, Moloney and Stafford23 Between 1995 and 2008 there was a substantial increase in the use of atypical antipsychotics for ‘off-label’ uses, which included depression and dementia, and for bipolar disorder. Reference Alexander, Gallagher, Mascola, Moloney and Stafford23 Although some antipsychotics are now licensed for the treatment of bipolar I disorder, it seems unlikely that the increase can be accounted for by this relatively rare condition alone. Anecdotally, the sedative antipsychotic quetiapine is also said to be widely used for insomnia. Reference Herper30
Although it is difficult to draw conclusions from the data on dosage in the current study, the predominantly low doses of many antipsychotics prescribed, especially thioridazine, chlorpromazine and quetiapine, may also reflect the use of these drugs for non-psychotic disorders and for their tranquillising properties for non-diagnosis-specific symptoms such as insomnia and agitation.
Dramatic increases in less commonly prescribed drugs are likely to reflect a variety of factors. Trends in stimulant prescriptions are consistent with those reported from the USA where increasing numbers of adults and children are being diagnosed with ADHD. Reference Castle, Aubert, Verbrugge, Khalid and Epstein5 Increasing prescriptions of lithium and sodium valproate may also reflect the increasing diagnosis of bipolar disorder Reference Moreno, Laje, Blanco, Jiang, Schmidt and Olfson31 and are consistent with the reported popularity of sodium valproate in psychiatric hospital practice. Reference Ventriglio, Vincenti, Centorrino, Talamo, Fitzmaurice and Baldessarini16 Increased use of drugs for substance use disorders reflects public policies to encourage smoking cessation and methadone treatment.
The fact that there was no change in prescriptions for anxiolytics and hypnotics is surprising in view of efforts to reduce the long-term use of these drugs, but reflects previous findings in the UK. 32 The current data suggest that reductions in prescription of some benzodiazepines have been balanced by increases in use of ‘Z’ drugs and diazepam.
Further research is needed into prescription patterns to clarify what indications different psychiatric drugs are used for in practice, using data on patients that include diagnosis, indications and length of treatment. It is particularly important to explore the uses of psychiatric medication for unlicensed indications that do not relate to specific diagnoses, where evidence of efficacy and effectiveness is likely to be limited.
There is international concern about the rising bill for prescription medicines, and the current data indicate that psychiatric drugs make a substantial and increasing contribution to these costs. Whether this situation will change when olanzapine and quetiapine come off patent, or whether sales of other new drugs will rise to fill the gap, remains to be seen. Attempts to contain costs and ensure rational and effective use of medication need to be informed by evidence of prescribing patterns, including the extent of ‘off-label’ uses of drugs such as antipsychotics.
Acknowledgements
The authors would like to thank Khadija Rantell of the Biostatistics Group, Joint University College London/University College London Hospital/Royal Free Hospital Research Support Centre, University College London, for statistical advice.


eLetters
No eLetters have been published for this article.