


There is now a sizeable literature on the incidence of schizophrenia and other psychoses among migrant and minority ethnic groups, particularly in the UK and The Netherlands. Although in the main, the evidence suggests the incidence is elevated in most of the migrant and minority ethnic groups that have been studied, Reference Bourque, van der Ven and Malla1 the evidence is stronger and more consistent for some groups, and the extent to which rates are increased varies markedly between groups. In Britain, for example, elevated incidence rates for psychosis have been noted in Black African and Black Caribbean populations, Reference Fearon, Kirkbride, Morgan, Dazzan, Morgan and Lloyd2 with less elevated risks among Irish and Indian Reference Cochrane and Bal3 and Pakistani populations, Reference King, Coker, Leavey, Hoare and Johnson-Sabine4 and specifically, among Pakistani and Bangladeshi women. Reference Kirkbride, Barker, Cowden, Stamps, Yang and Jones5 The most recent literature review further suggests that among some groups the incidence is greater among second-generation than first-generation migrants (such as Black Caribbean people in the UK). Reference Bourque, van der Ven and Malla1 These patterns of risk suggest that there may be strong social risk factors related to the post-migration settlement context, such as experiences of discrimination, Reference Bourque, van der Ven and Malla1,Reference Veling, Selten, Susser, Laan, Mackenbach and Hoek6 neighbourhood context, Reference March, Hatch, Morgan, Kirkbride, Bresnahan and Fearon7 and specifically ethnic density Reference Boydell, Van Os, McKenzie, Allardyce, Goel and McCreadie8 that may account for this variation.
The neighbourhood may function as ‘a reservoir of risk or resilience’ in the aetiology of psychosis. Reference March, Hatch, Morgan, Kirkbride, Bresnahan and Fearon7 However, there have been few studies directly examining this notion. One study suggested that neighbourhood-level ethnic group density may buffer residents from experiences of racism and discrimination that may in turn be associated with less psychotic experiences, Reference Bécares, Nazroo and Stafford9 but there have been no studies examining interactions of individual-level experiences of social support and chronic adversity with ethnic density and psychosis. Most previous work has tended to group ethnic minorities together Reference Boydell, Van Os, McKenzie, Allardyce, Goel and McCreadie8,Reference Kirkbride, Morgan, Fearon, Dazzan, Murray and Jones10 or has used service contact data, Reference Boydell, Van Os, McKenzie, Allardyce, Goel and McCreadie8,Reference Veling, Susser, van Os, Mackenbach, Selten and Hoek11,Reference Schofield, Ashworth and Jones12 to ascertain psychosis. Given the different settlement experiences of migrant groups in Britain, and the complex pathways to care reported in the literature for minority ethnic groups Reference Bhui, Stansfeld, Hull, Priebe, Mole and Feder13 this has been a limitation of previous work. With this in mind, using a nationally representative community-level data-set, we hypothesised that minority ethnic groups living in areas of lower own-group density would be more likely to report previous-year psychotic experiences relative to people living in areas of higher own-group density. In this population-based survey we used the Psychosis Screening Questionnaire (PSQ) Reference Bebbington and Nayani14 to screen for previous-year self-reported psychotic experiences. Although the relationship between population-level self-reported psychotic experiences and case-definition psychotic disorders remains controversial, associations between the two have been noted with similar demographic correlates between clinical psychosis and psychotic experiences. Reference van Os, Hanssen, Bijl and Vollebergh15 Associations between the reporting of community-level psychotic experiences and impairment of functioning Reference King, Nazroo, Weich, McKenzie, Bhui and Karlson16 have also been noted. Additionally, psychotic experiences may convert to clinical psychosis, particularly in adolescent and young adults. Reference Dominguez, Wichers, Lieb, Wittchen and Van Os17 Therefore, examining ethnic density associations with psychotic experiences within this data-set had the advantage of understanding the experiences of minority ethnic groups within a community survey of private households, potentially helping to illuminate the broader aetiology of psychosis. We hypothesised that relative to people living in areas of a greater ethnic density, people resident in areas of lower own-group density would be more likely to report adverse psychosocial factors potentially associated with onset and course of psychosis. Finally, we aimed to test for ‘buffering’ effects of density; that is whether adverse associations of discrimination, chronic strains and poorer social support with psychotic experiences might be aggravated by living in areas of lower own-group density. Reference Bécares, Nazroo and Stafford9,Reference Morgan, Charalambides, Hutchinson and Murray18
Method
Survey design
Data from the Ethnic Minorities Psychiatric Illness Rates in the Community (EMPIRIC) survey, a cross-sectional, nationally representative survey of adults (aged 16–74) undertaken in England in 2000, was used. Reference Sproston and Nazroo19 The survey was a follow-up of two previous representative community-based surveys conducted in England (the Health Survey for England (HSE) 1998 and 1999). 20 Weights were used to account for the differing probability of selection: by postcode sector, for households within sectors and adults from within households. 20
Of the 7009 individuals who originally took part and who were contacted for re-interview in 2000, there were 4281 achieved interviews (68.2% of individuals eligible for re-interview). Regression models using data from the HSE were used to derive non-response weights. 20 Wherever possible, these survey weights for non-response, and weights to account for differing probabilities of selection in the original surveys have been retained. Further details are available in the main report. Reference Sproston and Nazroo19
Structured interviews were conducted in individuals’ homes, by trained lay interviewers matched wherever possible to the respondent's gender. Reference Sproston and Nazroo19 Whenever survey respondents could not complete the interview in English, an interviewer fluent in their preferred language was provided. Reference Sproston and Nazroo19 Surveys were translated into Hindi, Gujarati, Bengali, Punjabi and Urdu by a professional translation service. Reference Sproston and Nazroo19
Individual-level variables
Ethnicity for Indian, Bangladeshi, Pakistani, Black Caribbean and White British respondents was defined according to self-report criteria from previous UK censuses. 21 Irish ethnicity was determined according to country of birth or country of parent's birth. Reference Sproston and Nazroo19 ‘Generational status’ was determined using country of birth and self-ascribed ethnicity. People who reported that they belonged to a minority ethnic group and were born in England, Scotland or Wales were categorised as ‘second/later generation’, and people reporting they were born outside of these countries but had migrated to England, Scotland or Wales within the same life-course were ‘first generation’. Occupational social class was determined according to Registrar General Social Class. Respondents were asked about their highest educational qualifications, age, gender and marital status.
Experiences of racism, discrimination Reference Bhui, Stansfeld, McKenzie, Karlsen, Nazroo and Weich22 and chronic strains and difficulties Reference Pearlin and Schooler23 were assessed using structured instruments. Social support was assessed using the Close Person's Questionnaire, a structured validated instrument that assesses social support provided from one's closest nominated person. Reference Stansfeld and Marmot24 More details about these measures can be found in the online supplement.
Neighbourhood-level measures
Area-level measures were carried out at the middle super output-area (MSOA) level (an administrative area with a minimum population of 5000 and a mean population of approximately 7200 people 25 ). Index of Multiple Deprivation from 2000, in quintiles, was used to assess area-level deprivation and linked to MSOA. Reference Noble, Wright, Smith and Dibben26 Ethnic density was defined as the ‘percentage of minority ethnic people living within each MSOA’. To protect confidentiality, ‘random noise’ was added per case; the correlation between the ‘true’ ethnic density value and provided values was 0.975.
Assessment of psychotic experiences: the Psychosis Screening Questionnaire
To assess psychotic experiences, we used the PSQ. Reference Bebbington and Nayani14 This is an interviewer-administered structured instrument that assesses psychotic experiences within the previous year. It includes five symptom domains: auditory hallucinations, persecutory delusions, hypomania, a feeling that ‘something strange’ is going on that others might find hard to believe and thought interference. Each section begins with an introductory stem question with interviewers directing respondents to further questions if a ‘yes’ response is endorsed. In order to screen positive on a symptom domain, respondents needed to answer ‘yes’ to all questions within that section. Respondents answered all questions in each domain.
The measure has a sensitivity of 96.9% and specificity of 95.3% against the Schedules for Clinical Assessment in Neuropsychiatry (SCAN), Reference Wing, Babor, Brugha, Burke, Cooper and Giel27 in clinical samples. Reference Bebbington and Nayani14 It has also been validated in two national surveys from Britain. Reference Nazroo28,Reference Singleton, Bumpstead, O'Brien, Lee and Meltzer29 Notably, the UK National Psychiatric Morbidity Survey assessed respondents who were screen-positive on the PSQ as well as a random sample of screen-negatives in a second-stage interview, Reference Singleton, Bumpstead, O'Brien, Lee and Meltzer29 using the SCAN. In this setting the PSQ was estimated to have a sensitivity of 0.49 and specificity of 0.96. Reference Prince30 We took the reporting of one or more symptoms on the PSQ as indicative of having experienced psychotic experiences within the previous year.
Statistical analysis
Analyses were performed in STATA 10 for Windows. For analyses not involving area-level measures, data were weighted and took into account survey structure, using the design-based Wald test to assess the strength of associations.
To account for intracluster correlation, and to enable the modelling of variance at both area-level and individual-level, a multilevel analysis of unweighted data was performed, with MSOA specified as the grouping variable, with individuals nested within these areas. Two-level multilevel models with random intercepts and fixed effects for each predictor variable were specified. Each model assumed that prevalence of psychotic experiences varied by neighbourhood and was run separately for each minority ethnic group. We repeated analyses retaining survey weights and using robust standard errors to account for geographical clustering. Sensitivity analyses comparing the two approaches suggested less than 5% difference in coefficients, using either approach. Therefore, findings from multilevel models are presented here.
We assessed cross-level interactions between own-group density and each of the measures for racism and discrimination, social support and chronic strains. The strength of cross-level interactions was assessed using likelihood ratio tests (LRTs).
Analysis plan
A priori confounders were age, gender, social class, marital status, education and area-level deprivation. Using multivariable logistic regression we assessed the association of interpersonal racism and discrimination, chronic strains and social support with the odds of screening positive on the PSQ. Next, we assessed the association of own-group density with the relative odds of screening positive on the PSQ, and assessed interactions with gender and generational status. To assess whether living in areas of reduced density was associated with increased discrimination and chronic strains, or with reduction in the reporting of ‘protective’ factors such as social support, we assessed the association of decreasing own-group density with each of these variables. Finally, we assessed whether the association of discrimination, social support and chronic strains with the reporting of psychotic experiences, varied with different levels of ethnic density.
Results
After taking into account survey structure and weights for non-response, 8% of the sample endorsed one or more items on the PSQ, equivalent to a weighted total of 351 people (total weighted sample size: 4281). By ethnic group, the weighted proportion of people endorsing one or more items on the PSQ were: White British 6%, Irish 8%, Black Caribbean 12%, Bangladeshi 5%, Indian 9%, Pakistani 10%.
Demographic features
Tables 1, 2, 3 shows the distribution of minority ethnic status against key demographic factors. Apart from the Irish group, second-generation minority ethnic respondents tended to be younger than first-generation comparison groups (Table 1). Additionally, second-generation groups had more education and higher social class than the first generation and were less likely to be married or cohabiting. With the exception of the Irish group, second-generation minority ethnic groups were more likely to report previous-year interpersonal racism than first-generation groups and second-generation Bangladeshi, Indian and Pakistani groups reported lower levels of practical support from their closest nominated person compared with first-generation counterparts (Table 2).
Association of racism and discrimination, chronic strains and social support with psychotic experiences
Online Tables DS1–7 display the association of racism and discrimination, social support, chronic strains and difficulties with the reporting of previous year psychotic experiences, after accounting for own-group density and all confounders, for each ethnic group. Taking the minority ethnic sample as a whole (net of White British people), after adjusting for confounders and own-group density, the association of each of the variables with psychotic experiences were: previous year interpersonal racism (odds ratio (OR) = 2.26, 95% CI 1.62–3.14, P<0.001), lifetime work-related discrimination (OR = 1.46, 95% CI 1.06–2.00, P = 0.02), (high v. low) practical social support provided by closest person (OR = 0.75, 95% CI 0.56–0.99, P = 0.04), (high v. low) confiding/emotional support provided by closest person (OR = 1.19, 95% CI 0.89–1.59, P = 0.24), (high v. low) negative aspects of close relationships (OR = 1.15, 95% CI 0.88–1.51, P = 0.29) and reporting one or more chronic strains (OR = 2.71, 95% CI 1.75–4.21, P<0.001).
TABLE 1 Individual-level demographic factors

| Minority ethnic group and generational statusFootnote a | |||||||||||
|---|---|---|---|---|---|---|---|---|---|---|---|
| Irish | Black Caribbean | Bangladeshi | Indian | Pakistani | |||||||
| White British |
1st generation |
2nd generation |
1st generation |
2nd generation |
1st generation |
2nd generation |
1st generation |
2nd generation |
1st generation |
2nd | |
| Total, n | |||||||||||
| Unweighted | 837 | 268 | 464 | 332 | 361 | 553 | 95 | 464 | 178 | 468 | 256 |
| Weighted | 835 | 246 | 484 | 321 | 369 | 537 | 110 | 458 | 188 | 469 | 255 |
| Age, years: % | |||||||||||
| 16–34 | 31 | 19 | 33 | 9 | 65 | 51 | 92 | 18 | 89 | 35 | 97 |
| 35–54 | 43 | 37 | 53 | 38 | 35 | 33 | 8 | 57 | 11 | 47 | 3 |
| 55–74 | 26 | 44 | 15 | 53 | 1 | 16 | 0 | 26 | 0 | 18 | 0 |
| Gender, % | |||||||||||
| Male | 44 | 43 | 44 | 39 | 42 | 49 | 53 | 48 | 52 | 51 | 42 |
| Female | 56 | 57 | 56 | 61 | 58 | 51 | 47 | 52 | 48 | 49 | 58 |
| Highest educational qualification, % |
|||||||||||
| Degree, equivalent or above |
27 | 29 | 27 | 21 | 30 | 8 | 23 | 31 | 26 | 19 | 15 |
| GCSE/A-level or
equivalent |
44 | 31 | 47 | 27 | 55 | 23 | 55 | 26 | 62 | 23 | 56 |
| Foreign
qualification/other |
4 | 7 | 4 | 8 | 1 | 3 | 1 | 5 | 3 | 6 | 1 |
| No qualifications | 25 | 33 | 22 | 44 | 14 | 65 | 22 | 37 | 10 | 52 | 28 |
| Social class, % | |||||||||||
| Non-manual | 58 | 46 | 54 | 44 | 57 | 17 | 32 | 43 | 60 | 28 | 44 |
| Manual, student,
never worked, or ‘other’ |
42 | 54 | 46 | 56 | 43 | 83 | 68 | 57 | 40 | 72 | 56 |
| Marital status, % | |||||||||||
| Married or
cohabiting |
62 | 70 | 59 | 55 | 28 | 79 | 22 | 85 | 41 | 85 | 42 |
| Divorced or
separated |
9 | 9 | 12 | 19 | 6 | 3 | 3 | 5 | 4 | 5 | 2 |
| Widowed | 4 | 6 | 2 | 6 | 0 | 5 | 0 | 4 | 0 | 3 | 1 |
| Single and never
married |
25 | 16 | 27 | 20 | 66 | 13 | 76 | 6 | 55 | 7 | 56 |
a. 2nd generation: second generation or later.
Association of own-group density with the reporting of psychotic experiences
After adjusting for confounders, in all the ethnic groups except the White British group, for each ten percentage point reduction in own-group density there was evidence of an increase in the relative odds of reporting one or more psychotic experiences, in the previous year (Table 4). The associations were strongest for Indian people and for the combined minority ethnic sample, with weaker effects noted for the Bangladeshi group (Table 4). No interactions for gender and own-group density, or generation and own-group density were noted.
TABLE 2 Individual-level experiences of discrimination, adversities and social support
| Minority ethnic group and generational statusFootnote a | |||||||||||
|---|---|---|---|---|---|---|---|---|---|---|---|
| Irish | Black Caribbean | Bangladeshi | Indian | Pakistani | |||||||
| White British |
1st generation |
2nd generation |
1st generation |
2nd generation |
1st generation |
2nd generation |
1st generation |
2nd generation |
1st generation |
2nd | |
| Total, n | |||||||||||
| Unweighted | 837 | 268 | 464 | 332 | 361 | 553 | 95 | 464 | 178 | 468 | 256 |
| Weighted | 835 | 246 | 484 | 321 | 369 | 537 | 110 | 458 | 188 | 469 | 255 |
| Previous year interpersonal racismFootnote b |
|||||||||||
| None | 93 | 93 | 94 | 88 | 83 | 93 | 83 | 89 | 83 | 91 | 80 |
| One or moreFootnote b | 7 | 7 | 6 | 12 | 17 | 7 | 17 | 11 | 17 | 9 | 20 |
| Lifetime work-related
discrimination,Footnote c % |
|||||||||||
| None | 96 | 89 | 95 | 65 | 62 | 93 | 88 | 80 | 83 | 84 | 85 |
| At least once | 4 | 11 | 5 | 35 | 38 | 7 | 12 | 20 | 17 | 16 | 15 |
| Levels of practical support provided from closest nominated person, % |
|||||||||||
| Lowest two tertiles | 60 | 56 | 56 | 61 | 66 | 26 | 53 | 48 | 63 | 43 | 56 |
| Top tertile – high levels | 40 | 45 | 44 | 39 | 34 | 74 | 47 | 52 | 37 | 57 | 44 |
| Levels of confiding and emotional support provided from closest nominated person, % |
|||||||||||
| Bottom two tertiles | 64 | 65 | 58 | 68 | 70 | 71 | 80 | 68 | 68 | 67 | 70 |
| Top tertile – high levels | 37 | 35 | 42 | 32 | 30 | 29 | 20 | 32 | 32 | 33 | 30 |
| Negative social support from closest nominated person, % |
|||||||||||
| Bottom two tertiles | 63 | 64 | 60 | 56 | 51 | 24 | 31 | 48 | 47 | 49 | 49 |
| Top tertile – high levels | 37 | 36 | 40 | 44 | 50 | 76 | 69 | 53 | 53 | 51 | 51 |
| Chronic strains and difficulties,Footnote d % |
|||||||||||
| No chronic difficulties | 27 | 33 | 23 | 32 | 17 | 14 | 18 | 27 | 28 | 26 | 27 |
| 1+ chronic difficulties | 73 | 67 | 77 | 68 | 83 | 86 | 82 | 73 | 72 | 75 | 73 |
a. a. 2nd generation: second generation or later.
b. b. Reports of insults, assaults or physical damage to property as a result of one's ethnic group, in the previous year.
c. c. Reports of lifetime discrimination at work because of one's race, colour, religious or ethnic background.
d. d. Problems with relatives, difficulties paying bills, difficulties with being able to afford food or clothing, problems with housing (such as damp), problems with the neighbourhood (such as unsafe streets, noise etc).
TABLE 3 Individual-level experiences of discrimination, adversities and social support
| Minority ethnic group and generational statusFootnote a | |||||||||||
|---|---|---|---|---|---|---|---|---|---|---|---|
| Irish | Black Caribbean | Bangladeshi | Indian | Pakistani | |||||||
| White British |
1st generation |
2nd generation |
1st generation |
2nd generation |
1st generation |
2nd generation |
1st generation |
2nd generation |
1st generation |
2nd | |
| Total, n | |||||||||||
| Unweighted | 837 | 268 | 464 | 332 | 361 | 553 | 95 | 464 | 178 | 468 | 256 |
| Weighted | 835 | 246 | 484 | 321 | 369 | 537 | 110 | 458 | 188 | 469 | 255 |
| Area level deprivation
(quintiles), % |
|||||||||||
| Least deprived quintile | 27 | 12 | 15 | 1 | 2 | 0 | 0 | 13 | 12 | 1 | 0 |
| Second quintile | 24 | 13 | 20 | 7 | 4 | 0 | 2 | 13 | 11 | 3 | 3 |
| Third quintile | 19 | 20 | 19 | 14 | 15 | 1 | 2 | 19 | 18 | 9 | 9 |
| Fourth quintile | 16 | 29 | 23 | 27 | 28 | 9 | 19 | 31 | 27 | 24 | 25 |
| Most deprived quintile | 15 | 25 | 22 | 51 | 50 | 89 | 77 | 25 | 32 | 63 | 63 |
| Own-group density,Footnote b % | |||||||||||
| Lowest | 0 | 28 | 30 | 48 | 46 | 36 | 49 | 73 | 75 | 43 | 43 |
| Low | 3 | 24 | 36 | 30 | 34 | 17 | 15 | 11 | 16 | 21 | 21 |
| Middle | 14 | 39 | 28 | 15 | 14 | 14 | 14 | 9 | 7 | 17 | 19 |
| High | 83 | 9 | 7 | 7 | 5 | 33 | 22 | 7 | 2 | 19 | 16 |
a. 2nd generation: second generation or later.
b. Density cut-offs; White British -25%, 50%, 75%; Irish –1%, 2%, 5%; Black Caribbean –6%, 12%, 18%; Indian, Bangladeshi and Pakistani —15%, 30%, 45%.
TABLE 4 Association of reporting psychotic experiences per ten percentage point reduction in own-group density
| n | Median (IQR) of
own-group ethnic density variable |
||||
|---|---|---|---|---|---|
| Ethnic group | Unweighted | WeightedFootnote b | OR (95% CI)Footnote a | P (trend) | |
| Combined minority ethnic sample | 3444 | 3446 | 36.1 (14.40–59.74) | 1.07 (1.01 to 1.14) | 0.03 |
| White British | 837 | 835 | 93.1 (84.6–96.9) | 0.91 (0.72 to 1.14) | 0.38 |
| Irish | 733 | 733 | 1.7 (0.92–3.01) | 5.44 (0.77 to 38.3) | 0.09 |
| Black Caribbean | 694 | 691 | 6.9 (2.55–11.61) | 1.05 (0.68 to 1.61) | 0.83 |
| Bangladeshi | 650 | 650 | 28.9 (10.5–46.8) | 1.26 (1.00 to 1.60) | 0.07 |
| Indian | 643 | 648 | 6.5 (3.39–16.31) | 1.38 (1.02 to 1.86) | 0.03 |
| Pakistani | 724 | 724 | 19.3 (5.99–38.71) | 1.17 (0.95 to 1.45) | 0.15 |
a. Models adjusted for area-level deprivation, social class, education, marital status, age and gender
b. Weighted for non-response.
Figure 1 displays the predicted probability of screening positive on the PSQ according to actual own-group ethnic density. For each of the minority ethnic groups, the predicted probability of screening positive on the PSQ was greatest at the lowest levels of own-group ethnic density. The only group for whom the trend was reversed was the White British group.
Association of own-group density with racism and discrimination, social support and chronic strains
We have previously reported that for many minority groups living in areas of higher own-group density there is reduced reporting of discriminatory experiences and reports of enhanced social support. Reference Das-Munshi, Becares, Dewey, Stansfeld and Prince31 Online Tables DS8 and DS9 show the association of living in areas of decreasing own-group density with the reporting of discrimination and social support. Although associations were not always in the expected direction, in general with decreasing own-group density minority ethnic groups were more likely to report greater discrimination and poorer social support. Reference Das-Munshi, Becares, Dewey, Stansfeld and Prince31
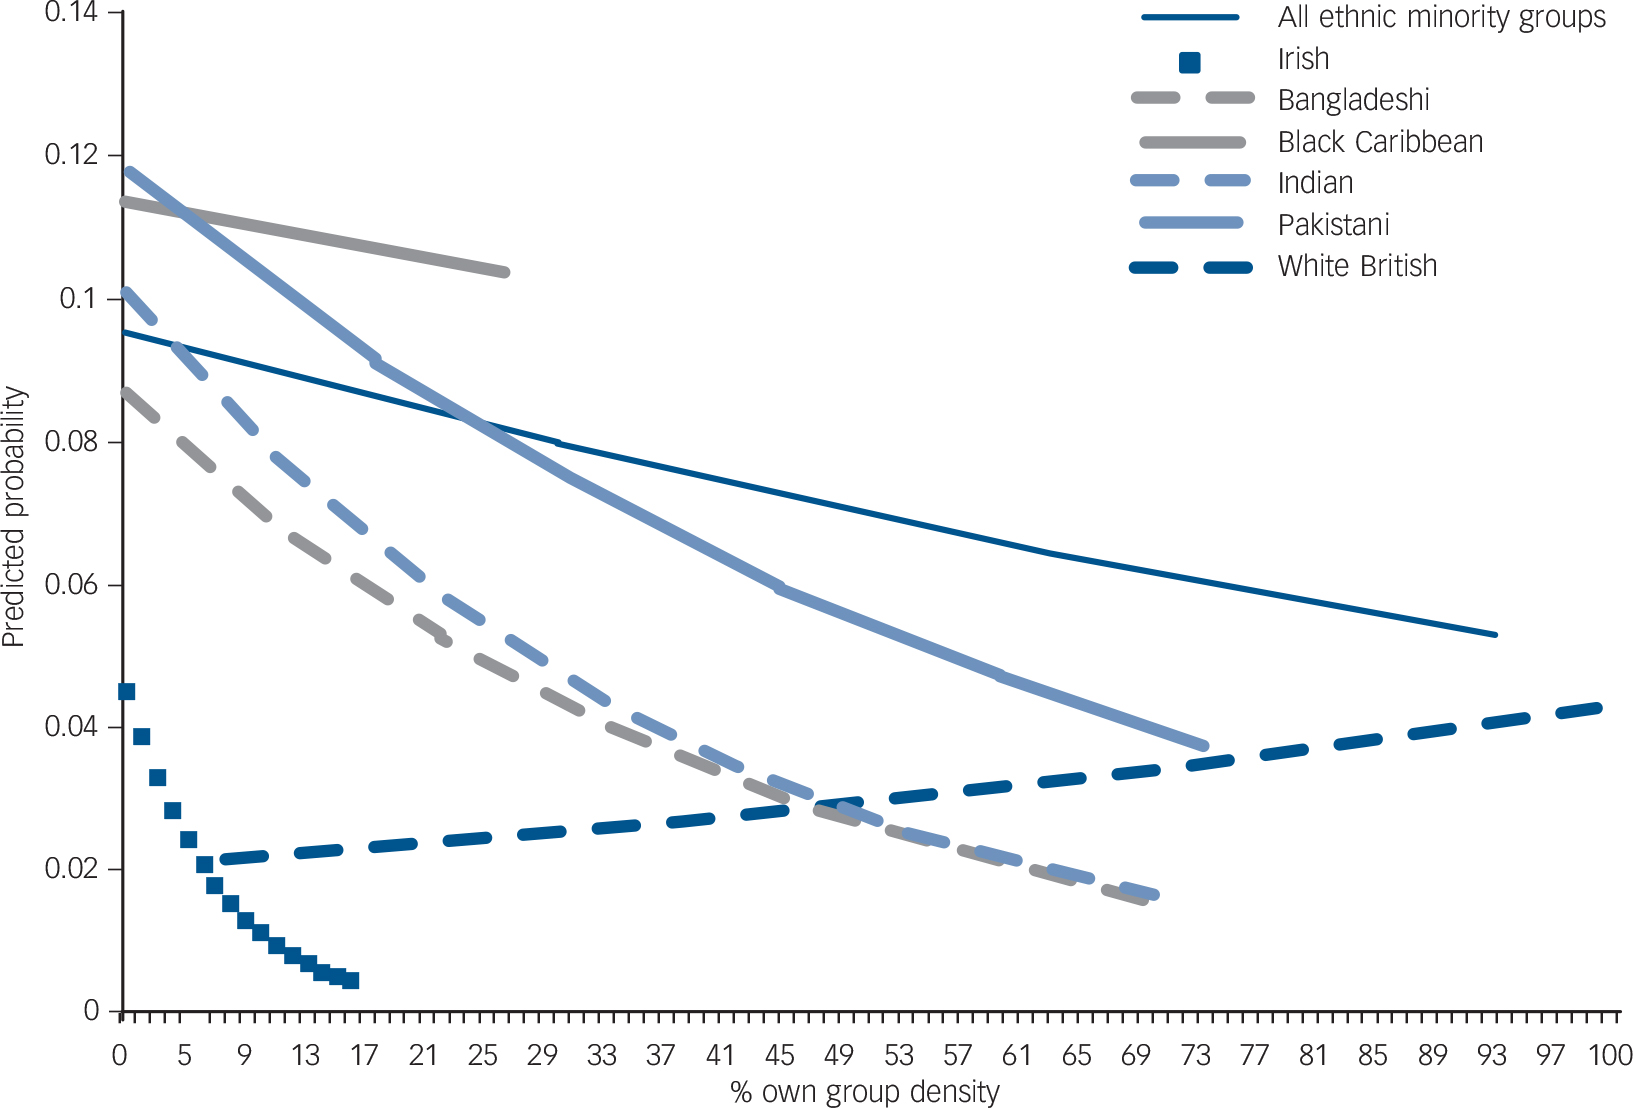
FIG. 1 Predicted probability of screening positive on the Psychosis Screening Questionnaire according to own-group density.
All plots have been adjusted for a priori confounders (age, gender, social class, education, marital status and area-level deprivation) and take into account geographical clustering.
Table 5 displays associations of reporting chronic strains with ethnic density. For every ten percentage point reduction in own-group density, Bangladeshi, Indian, Irish and the combined minority ethnic sample were more likely to report chronic strains due to relatives. Only the Irish group were more likely to report problems with money for food and clothing with every ten percentage point reduction in own-group density. Given that ethnically dense areas are more likely to be deprived, Reference Das-Munshi, Becares, Dewey, Stansfeld and Prince31 it was unsurprising that difficulties with housing were less likely to be reported for each ten percentage point reduction in total ethnic density. Only the White British group appeared to report increasing ‘neighbourhood difficulties’ with decreasing own-group density. Irish people experienced an approximate four-fold increase in reporting one or more chronic strains for every ten percentage point reduction in own-group density.
TABLE 5 Relative odds (95% CI) of reporting chronic strains and difficulties per ten percentage point reduction in own-group densityFootnote a

| Chronic strains and difficulties |
n | Total minority ethnic sample (n = 3444) |
White British (n = 837) |
Irish (n = 733) |
Black Caribbean (n = 694) |
Bangladeshi (n = 650) |
Indian (n = 643) |
Pakistani (n = 724) |
|---|---|---|---|---|---|---|---|---|
| Problems with relatives | 1952 | |||||||
| OR (95% CI) | 1.06 (1.02–1.11) | 0.88 (0.78–0.99) | 3.48 (1.33–9.07) | 0.86 (0.63–1.17) | 1.43 (1.18–1.74) | 1.14 (1.02–1.27) | 1.03 (0.89–1.19) | |
| P (trend) | 0.005 | 0.03 | 0.02 | 0.34 | <0.001 | 0.02 | 0.69 | |
| Problems with money for food or clothing |
1605 | |||||||
| OR (95% CI) | 1.01 (0.97–1.06) | 0.95 (0.84–1.07) | 2.77 (0.87–8.85) | 1.17 (0.83–1.63) | 1.07 (0.95–1.20) | 0.99 (0.82–1.20) | 0.97 (0.83–1.12) | |
| P (trend) | 0.68 | 0.38 | 0.08 | 0.35 | 0.29 | 0.93 | 0.68 | |
| Difficulties with paying bills | 1265 | |||||||
| OR (95% CI) | 1.01 (0.96–1.06) | 0.94 (0.81–1.09) | 3.01 (0.65–14.0) | 1.02 (0.76–1.36) | 0.99 (0.84–1.17) | 1.14 (0.95–1.38) | 0.94 (0.82–1.09) | |
| P (trend) | 0.67 | 0.39 | 0.15 | 0.91 | 0.94 | 0.17 | 0.41 | |
| Difficulties with housing | 1150 | |||||||
| OR (95% CI) | 0.93 (0.88–0.99) | 0.93 (0.79–1.09) | 0.69 (0.16–2.97) | 0.79 (0.56–1.12) | 0.88 (0.73–1.05) | 1.06 (0.88–1.27) | 0.99 (0.83–1.19) | |
| P (trend) | 0.01 | 0.35 | 0.62 | 0.19 | 0.17 | 0.54 | 0.95 | |
| Neighbourhood difficulties | 940 | |||||||
| OR (95% CI) | 1.00 (0.94–1.06) | 1.14 (1.01–1.29) | 1.61 (0.46–5.59) | 0.84 (0.55–1.29) | 0.84 (0.68–1.04) | 1.23 (0.98–1.53) | 1.02 (0.87–1.20) | |
| P (trend) | 1.00 | 0.04 | 0.45 | 0.43 | 0.12 | 0.08 | 0.77 | |
| Report one or more chronic
strains |
3228 | |||||||
| OR (95% CI) | 1.01 (0.96–1.06) | 0.99 (0.87–1.13) | 3.98 (1.26–12.57) | 0.93 (0.61–1.41) | 1.15 (0.83–1.58) | 1.12 (0.98–1.29) | 0.93 (0.79–1.11) | |
| P (trend) | 0.77 | 0.94 | 0.02 | 0.73 | 0.37 | 0.12 | 0.43 |
a. All models adjusted for area-level deprivation, gender, social class, age, marital status, education. Totals are unweighted.
Ethnic density as an effect modifier
When the sample as a whole (net of White British people) was considered (n = 3444), interactive effects for social support and chronic strains with ethnic density were evident. Figures 2, 3, 4 display the predicted probabilities of reporting psychotic experiences, for people experiencing different levels of chronic strains and difficulties (Fig. 2), confiding and emotional support (Fig. 3), and practical support (Fig. 4) at different levels of own-group density, for the total minority ethnic sample. Figures 2, 3, 4 support the overall finding that in general, living in areas of increasing own-group density was associated with a lower predicted probability of reporting psychotic experiences. This reduction was more marked for people who reported high levels of practical or confiding support (Figs 3 and 4). People who did not report chronic strains and difficulties experienced a greater reduction in the predicted probability of reporting psychotic experiences, contrasted against people reporting one or more chronic strains and difficulties (Fig. 2). Interactive effects were not evident when assessed in individual minority ethnic groups.
Contextual v. compositional associations with density
Finally, in models using the combined minority ethnic sample (n = 3444), LRTs assessing the strength of the evidence that the variability between areas was the same as within areas (i.e. LRT for ρ =0, ‘ρ’ (‘rho’), also known as the intracluster correlation coefficient (ICC) Reference Kirkwood, Sterne, Kirkwood and Sterne32 ), suggested that the prevalence of reporting psychotic experiences varied by area, even after adjusting for area-level deprivation, as well as the individual-level covariates of age, gender, education, social class and marital status (ICC = 0.06, 95% CI 0.01–0.20, P = 0.05). After the individual-level variables of discrimination, social support and chronic strains were added to models, the variability between areas was reduced (ICC = 0.03, 95% CI 0.00–0.30, P = 0.21); suggesting that these latter individual-level variables ‘accounted’ for some of the area-level variability in the prevalence of psychotic experiences Reference Merlo, Chaix, Yang, Lynch and Rastam33 (see online data supplement).
Discussion
Main findings
The findings from this study, using nationally representative data, largely confirm that for minority ethnic groups living in England, people living in areas of lower own-group density are more likely to have psychotic experiences. This was most marked for Indian people and the combined minority ethnic sample, with weaker effects noted for the Bangladeshi group, although the general trend was supportive of similar associations for all minority groups.
Relationship to previous findings
The findings support previous studies that have used service-contact data Reference Boydell, Van Os, McKenzie, Allardyce, Goel and McCreadie8,Reference Veling, Susser, van Os, Mackenbach, Selten and Hoek11,Reference Schofield, Ashworth and Jones12 although the present study had the advantage of using a community-level population data-set, reducing possible health-seeking selection biases. This is an important issue given the literature that has established complex pathways to care among minority ethnic groups living in Britain. Reference Bhui, Stansfeld, Hull, Priebe, Mole and Feder13 The national context of the data-set permitted examination of density effects over a range of own-group densities; most previous work has tended to focus on smaller geographical areas, usually within urban locations. Reference Boydell, Van Os, McKenzie, Allardyce, Goel and McCreadie8,Reference Veling, Susser, van Os, Mackenbach, Selten and Hoek11,Reference Schofield, Ashworth and Jones12
Although each of the minority ethnic groups experienced an increase in the relative odds of screening positive on the PSQ per ten percentage point reduction in own-group density, it is surprising that the findings were less marked for the Black Caribbean group, given that in previous analyses the ethnic groups examined were predominantly Reference Boydell, Van Os, McKenzie, Allardyce, Goel and McCreadie8,Reference Kirkbride, Morgan, Fearon, Dazzan, Murray and Jones10 or exclusively Reference Schofield, Ashworth and Jones12 African–Caribbean. It may be that the geographical distance over which ethnic density associations operate differs by minority ethnic group. For example, a previous study found that ethnic density associations were evident for Black Caribbean people at the lower super output-level (with mean 1500 residents 25 ) which disappeared when re-examined at the larger ward-level. Reference Schofield, Ashworth and Jones12 As we used a larger geographical area (of mean 7200 residents 25 ), this might account for our weaker findings for the Black Caribbean group, although, notably, there was evidence supporting ethnic density associations for the Indian and combined minority ethnic sample, with weaker evidence for the Bangladeshi group, at this level. Protective social networks may extend over larger geographical areas for these groups. More work is needed to understand the level at which density effects operate for different minority ethnic groups living in Britain and what this might mean from the perspective of residents. Reference Whitley, Prince, McKenzie and Stewart34
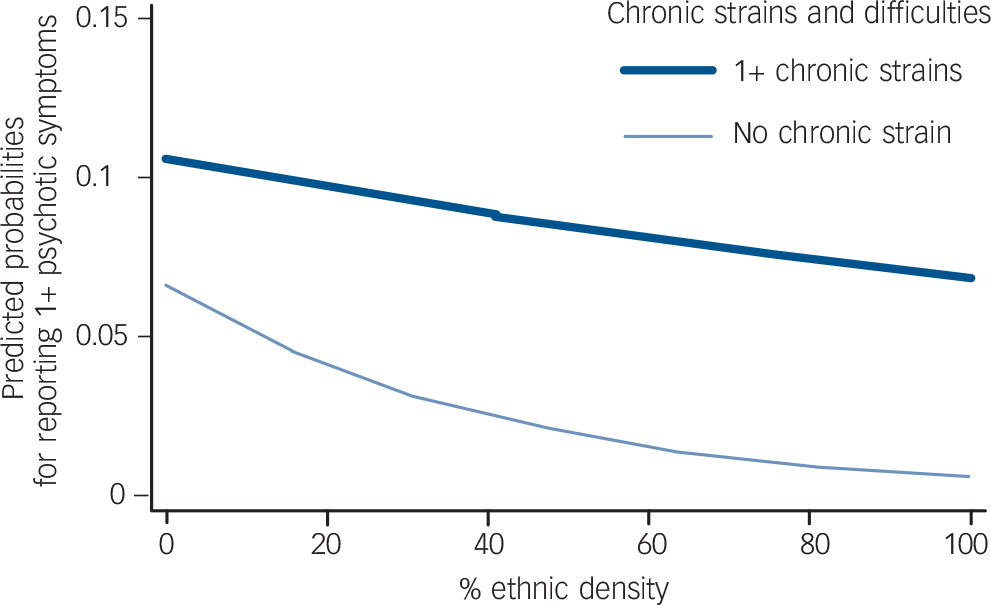
FIG. 2 Predicted probability in total minority ethnic sample of reporting psychotic experiences at different levels of own-group density, stratified by chronic strains and difficulties.
P for tests of interaction (likelihood ratio test) = 0.04.
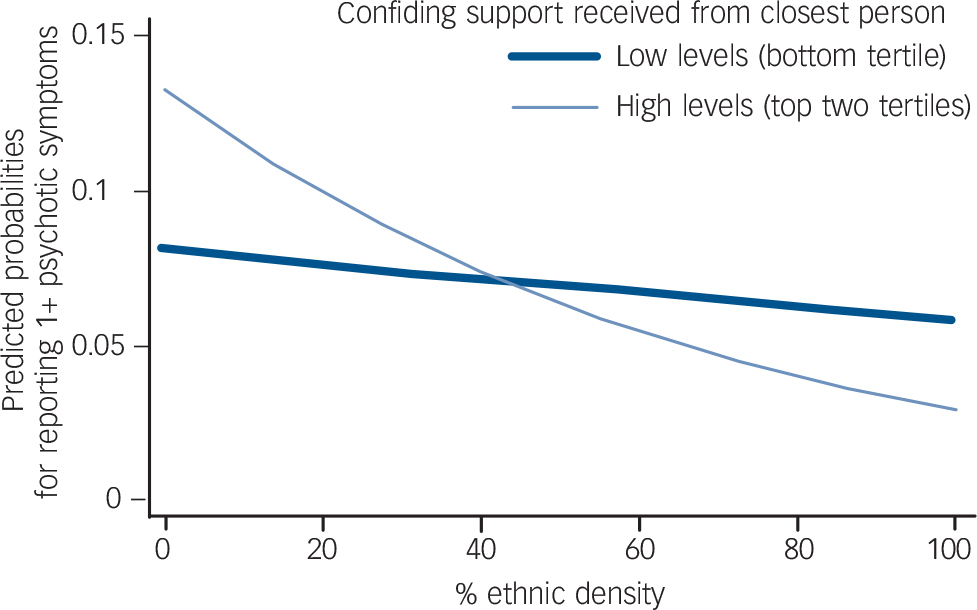
FIG. 3 Predicted probability in total minority ethnic sample of reporting psychotic experiences at different levels of own-group density, stratified by confiding support.
P for tests of interaction (likelihood ratio test) = 0.03.
The actual ranges of own-group density for each of the minority groups in this study is commensurate with known ranges for minority ethnic settlement in Britain at MSOA-level. Reference Dobbs, Green and Zealey35 The observations in this study should not be extrapolated outside these ranges; it is possible that at higher ranges of own-group density ‘protective’ associations cease to be beneficial.
In the main study, Reference Sproston and Nazroo19 the Social Functioning Questionnaire assessed, alongside other aspects of functioning, positive relationships with relatives. Reference Tyrer, Nur, Crawford, Karlsen, MacLean and Rao36 Bangladeshi men and women were more likely to report ‘severe’ problems with their relationships, compared with the other minority ethnic groups. Reference Sproston and Nazroo19 The findings from the present analysis build on this individual-level association by showing that Bangladeshi people living in areas of lower own-group density were more likely to report problems with their relatives compared with Bangladeshi people living in areas of higher own-group density. It may be that ‘buffering’ mechanisms also operate through non-kin social contacts and that these become less accessible to people living in lower own-group density areas, where difficult relationships within the household might exacerbate mental health problems. More research, potentially using qualitative approaches, is needed to understand the way in which interpersonal relationships vary according to contextual determinants.
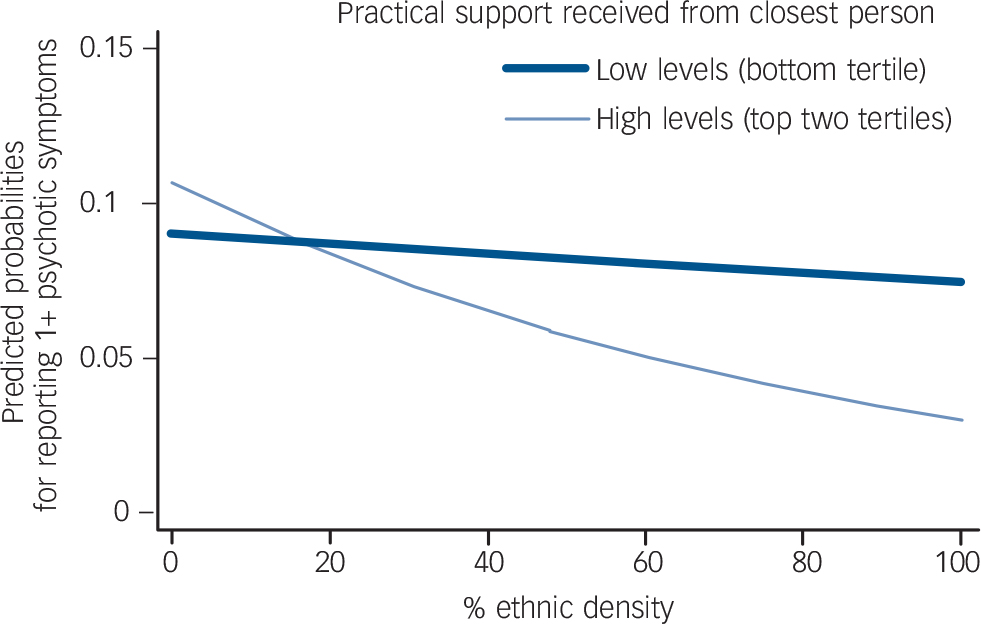
FIG. 4 Predicted probability in total minority ethnic sample of reporting psychotic experiences at different levels of own-group density, stratified by practical support.
P for tests of interaction (likelihood ratio test) = 0.04.
Previous work has suggested that second-generation groups continue to experience an elevated risk of psychosis compared with first-generation groups. Although experiences such as discrimination and disadvantage varied according to generation, there were no interactions noted between generational status and own-group density in the reporting of psychotic experiences. This suggests that density effects were similar across first- and second-generation groups.
Ethnic density as a ‘buffer’ for psychosis
Although findings are complex, the analysis supports the hypothesis that own-group density may buffer psychosocial adversity, thus reducing the risk of psychosis, through two potential pathways. First, in keeping with earlier work on this data-set, Reference Das-Munshi, Becares, Dewey, Stansfeld and Prince31 for some groups in this study, living in areas of lower own-group density was associated with an increase in the reporting of racism, discrimination and poorer social support. Our findings also suggested that for some groups, chronic strains and difficulties were increased among people living in areas of lower own-group density. Given the associations of these variables with the reporting of psychotic-like experiences, Reference Morgan, Fisher, Hutchinson, Kirkbride, Craig and Morgan37,Reference Karlsen, Nazroo, McKenzie, Bhui and Weich38 one potential interpretation might be that living in areas of lower own-group density may lead to adverse effects on mental health, as minority ethnic residents in such areas may be exposed to more discrimination, Reference Bécares, Nazroo and Stafford9 poorer social support and greater chronic strains. Reference Morgan, Fisher, Hutchinson, Kirkbride, Craig and Morgan37 This is in keeping with earlier qualitative work that suggested that ethnically dense areas may function as a ‘psychic shelter’ for minority ethnic residents. Reference Whitley, Prince, McKenzie and Stewart34
Second, within the full minority ethnic sample, we found evidence of interactive effects for ethnic density and chronic strains, as well as with ethnic density and some of the social support measures. Our findings suggest that although living in areas of higher own-group density may reduce the risk of experiencing psychotic experiences, this protective effect may be lessened in people experiencing chronic strains, and enhanced in people reporting high levels of practical support or confiding/emotional support from one's closest nominated person. There were a few unexpected associations. Although some of these associations may be related to measurement error in these variables, they also highlight the heterogeneity of experiences underlying ‘ethnic density effects’ which mirror the complex settlement experiences and individual histories of each of the groups studied in this analysis.
Limitations
Limitations of the study include its cross-sectional design; temporality cannot be assumed. Recall bias may have influenced findings: people experiencing psychotic experiences may have been more likely to recall episodes of discrimination or adversity, or conversely people endorsing items on the PSQ that assess for persecutory delusions may have endorsed these items because they were experiencing discrimination rather than psychotic experiences. Related to the issue of temporality, the Black Caribbean group reported the highest prevalence of discrimination within the sample and reporting of work-related discrimination was greatest in areas of higher own-group density. The latter finding could be accounted for through reverse causality (i.e. people who experience lifetime work-related discrimination then move into areas of higher own-group density).
Insufficient power may have accounted for weaker ethnic density effects for some minority ethnic groups within this survey. We assessed socioeconomic position and area-level deprivation with multiple indices; it is possible that density effects were minimised by residual confounding effects of area-level deprivation and socioeconomic position, especially as ethnically dense areas were also more deprived. Finally, as the original investigation omitted Black African people from the survey, Reference Sproston and Nazroo19 we were unable to include this group, or more recent migrant groups, in the analyses. It should be borne in mind that the findings may not generalise to other minority ethnic groups.
Although the findings of this study are in keeping with previous work suggesting associations between ethnic density and incident schizophrenia or clinical psychosis, Reference Boydell, Van Os, McKenzie, Allardyce, Goel and McCreadie8,Reference Veling, Susser, van Os, Mackenbach, Selten and Hoek11 another potential limitation was using an instrument to assess reporting of psychotic experiences, as opposed to clinical psychosis. Concerns have been raised when instruments like these are used in large population-based surveys, where the rigour in administering these tools may be reduced and ‘masking of caseness’ greater. Reference Prince30 Additionally, compared with studies examining the incidence of clinical psychosis using service-contact data, Reference Kirkbride, Fearon, Morgan, Dazzan, Morgan and Tarrant39 the reported prevalence of psychotic experiences for the Black Caribbean group was lower than would be expected in the present analysis. Similar findings have been noted in other analyses of nationally representative data-sets utilising the PSQ. Reference Sproston and Nazroo19,Reference Nazroo28 It has been suggested that if Black Caribbean people experience shorter episodes of psychotic illnesses Reference McKenzie, van, Fahy, Jones, Harvey and Toone40 then this would account for the discrepancies between prevalence as demonstrated in this study and incidence as suggested in studies using service-contact data. Reference King, Nazroo, Weich, McKenzie, Bhui and Karlson16 Given these concerns, the responses to the PSQ in this study should be treated as responses to a screening questionnaire ascertaining prevalence of psychotic experiences, and not clinical psychosis.
However, there are many similarities between the demographic correlates of people reporting psychotic-like experiences compared with people with clinical psychosis, Reference van Os, Hanssen, Bijl and Vollebergh15 and evidence to indicate that psychotic-like experiences may exist on a continuum with severe psychotic disorders. Reference van Os, Linscott, Myin-Germeys, Delespaul and Krabbendam41 In most cases such phenomena are transitory and disappear over time, although for some these may persist and develop into severe disorders, especially in people exposed to environmental stressors. Reference Morgan, Charalambides, Hutchinson and Murray18,Reference van Os, Linscott, Myin-Germeys, Delespaul and Krabbendam41
Implications
This study suggests strong evidence for area-level or ‘contextual’ associations with psychotic experiences, in minority ethnic groups. These might be accounted for through individual-level factors such as experiences of discrimination and chronic strains and social support, but may also function in other ways. Strong social effects mediated through the environment may account for varying susceptibilities to psychosis among minority ethnic people. Our findings begin to unpack important social mechanisms that may underlie the aetiology of psychotic experiences in minority ethnic groups.
Funding
J.D.-M. is supported by a Medical Research Council fellowship. L.B. is supported by a Medical Research Council/Economic and Social Research Council fellowship. C.M. is supported by funding from the Medical Research Council, Wellcome Trust (grant: WT087417) and European Union. (European Community's Seventh Framework Program (grant agreement No. HEALTH-F2-2009-241909) (Project EU-GEI)). In addition, we are grateful to the Institute of Social Psychiatry, who provided a small finds grant that enabled the retrieval and matching of area-level variables to the data-set. We acknowledge the support of the NIHR Biomedical Research Centre for Mental Health at the South London and Maudsley NHS Foundation Trust and (Institute of Psychiatry) King's College London.
Acknowledgements
The authors are grateful to: James Nazroo and Mai Stafford for earlier advice on aspects of the analysis, and to helpful comments from peer reviewers on a related analysis, which informed the methods for the present study; Sally McManus, Emily Diment and Claire Deverill (National Centre for Social Research (NatCen)) for assisting with retrieval and matching of area-level measures to the data-set; Ismail Richard Hamilton for his input in generating a variable that enabled analysis by generational status; the anonymous peer reviewers; and Professor Peter Tyrer for his helpful comments and suggestions.


 Open access
eLetters
No eLetters have been published for this article.