


Resourcing psychological care
Psychological treatments that might broadly be termed psychotherapy have a critically important part to play in responding to the needs of people with common mental health problems in the community. In the UK, the delivery of public psychological treatments should fall within the founding principles of the National Health Service (NHS): meeting the needs of everyone, being free at the point of delivery and based on clinical need, not ability to pay. If these principles are to be actualised then we should see as little as possible in the way of disparities in access to this kind of care across groups defined by socioeconomic status. Where there are such disparities they ought to be seen to narrow over time. There are arguments in moral philosophy such as John Rawls ‘maximin’ position that such policies should preferentially target those worst off in society. According to this position the end-point of progressive reallocation of resources might go some way beyond strict equity, favouring more disadvantaged areas even further. The NHS has a long history of efforts being made to direct resources to areas and target groups that are, or are at risk of, being relatively underserved. Need for healthcare and especially mental healthcare is not evenly distributed across areas and a key element of funding in the NHS is distribution of funds to area on the basis of estimates of population need, using weighted capitation approaches. Since 2003 this has been through iterations of the Allocation of Resources to English Areas (AREA) formula. Reference Sutton, Gravelle, Morris, Leyland, Windmeijer and Dibben1 In this context, over recent years a number of specific initiatives have been brought into being to promote psychological treatments in primary care particularly.
Improving access to psychological treatments in England
The Improving Access to Psychological Treatments (IAPT) programme in England is being implemented by primary care trusts. It provides a broadening range of National Institute for Health and Clinical Excellence-recommended psychological treatments for depression and anxiety (both low- and high-intensity treatment such as counselling for depression, brief dynamic interpersonal therapy, interpersonal therapy, cognitive–behavioural treatment, family systemic therapy). The UK cross-governmental mental health outcomes strategy ‘No Health Without Mental Health’ 2 included in its recommendations the need to improve access to psychological treatments for people with long-term physical conditions, medically unexplained symptoms, children and adolescents, older people and those with severe mental illness. The IAPT programme is currently about to provide funding for a series of Pathfinder Projects across the English regions to examine how IAPT can best integrate with primary care, physical healthcare services and liaison psychiatry services. Projects will also examine how to improve access to psychological services for people with long-term physical conditions and medically unexplained symptoms so that best practice lessons can be learnt for future dissemination and implementation. Around 15 million or 30% of people in the UK have long-term physical health conditions, and people with long-term conditions and comorbid mental health problems disproportionately live in deprived areas and have access to fewer resources of all kinds. Reference Naylor, Parsonage, McDaid, Knapp, Fossey and Galea3
In this edition of the Journal, Jokela et al, Reference Jokela, Batty, Vahtera, Elovainio and Kivimäki4 using a broad definition of mental disorders, have looked at sequential changes through time in the use of psychotherapy provided by both the public and private sectors. The data were derived from sequential surveys in the UK, and are self-report in nature. The question regarding use of psychotherapy was a very simple and somewhat restrictive one, about ‘being in psychotherapy’. The proxy assessment for presence of psychiatric disorder was undertaken with a very familiar instrument, the General Health Questionnaire (GHQ-12), and the strength of the population coverage and the longitudinal nature of the studies is of a very high quality. The conclusions are very interesting: over an 18-year period the use of publicly funded psychotherapy services has improved in socioeconomically disadvantaged groups. The severity of symptoms seems to be greater among those using public rather than private sector services.
Alternative approaches to healthcare funding
The purposive approach to resource distribution based on the needs of geographical areas introduced above is, of course, far from the only way that healthcare and mental healthcare can be funded. The NHS stands as the prototypic example of this kind of approach to commissioning healthcare, but alternative models include social insurance (for example in Germany), national health insurance (in Canada) and private insurance (in the USA). Australia is a country that like the UK has introduced measures to promote delivery of psychological interventions particularly in primary healthcare but through a healthcare delivery system that combines a national health insurance scheme for most primary care with something more similar to the NHS for secondary care in the greater part. The national health insurance scheme in Australia (Medicare) allows practitioners to charge co-payments as they determine and as the market will bear. We might helpfully then consider the experience of Australia as another country that has been seeking to promote access to mental healthcare in recent years.
Australia as a contrast
In Australia since 2000 a series of initiatives have been introduced within or alongside Medicare to increase funding for psychological treatment. These began with an initiative placing funds into the hands of relatively local bodies and according to a capitation weighting formula. In 2006, the scope of Medicare was extended with new items in the rebate schedule for consultations from psychologists and other non-medical providers. Reference Harris, Burgess, Pirkis, Slade and Whiteford5 The application of capitation weighting approaches for public healthcare provision is inconsistent across the country and many of the states and territories do not have explicit or transparent funding models in place. It would be interesting if there was comparative information on whether this approach to funding, which has massively increased delivery of government-supported psychological treatments in Australia, shows similar signs of progressively narrowing disparities such as those found by Jokela et al. Reference Jokela, Batty, Vahtera, Elovainio and Kivimäki4
Recently one of us (G.N.M.) published comparisons between two sequential national surveys, providing supportive evidence that the overall population access to psychological treatments has improved, Reference Meadows and Bobevski6 but these analyses did not permit examination of equity. Indeed, there are technical issues regarding these two surveys that make this difficult. 7 Harris et al Reference Harris, Burgess, Pirkis, Slade and Whiteford5 used data from the National Survey of Mental Health and Wellbeing 2007 and looked at areas defined as socioeconomically less deprived. They posed the question of whether there was a greater proportion of people using services who came from such areas and who did not meet criteria for a diagnosis based on the composite international diagnostic interview. This analysis did not demonstrate access inequity but also did not exclude: (1) access inequities that might be evident with more detailed examination of areas; Reference Meadows, Singh, Burgess and Bobevski8 and (2) differences in proportionality of response. Equity in healthcare involves not only equity of access, but also that the number, quality and duration of services consistently should be proportional to need. A nationally published report on the more recent changes to Medicare-funded provision has made public some information on consultation numbers based on Medicare rebates claimed. Reference Pirkis, Harris, Hall and Ftanou9 Although the report concluded that there was no overall discernible difference in rates of use across socioeconomic status areas, it did not exclude the possibility that there might be differences in proportionality. Based on publicly available data on the size of populations in the defined areas, it is reasonably straightforward to calculate the mean number of consultations per course of treatment and here our calculations are that the mean services per course in the least disadvantaged of areas by socioeconomic status quintiles is 5.5, whereas for other quintiles the range is 2.9–3.9 (see online Table DS1). We can also use the number of services to calculate a concentration index (Fig. 1) as an indicator of inequality, which in this case is 0.107. Rebates have been capped at a maximum that has varied from 18 at introduction to 10 more recently. Reference Mangalore, Knapp and Jenkins10 Hence, there may be relative differences in proportionality of response not in line with equity and not in accordance with a maximin moral position.
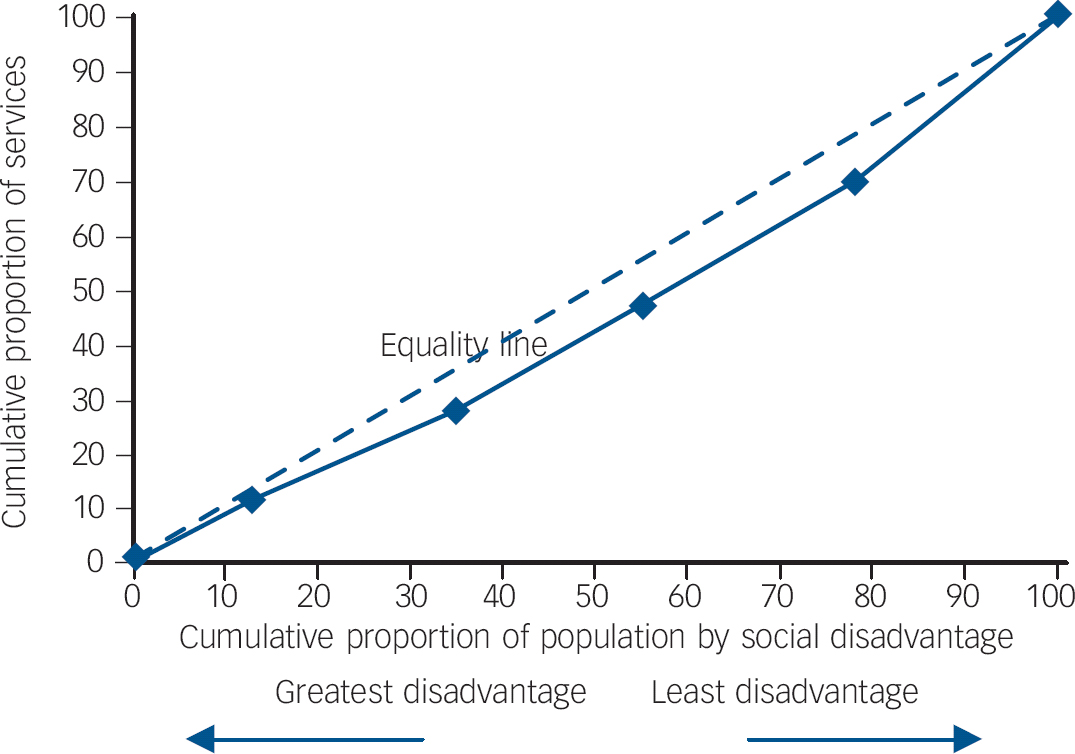
Fig. 1 Better Access Psychology Items Concentration Index graphic for Australian Medicare items.
How equitable is provision of psychotherapy in the UK?
This consideration of the Australian position perhaps illustrates some ways in which inequity might still be present in the British system, even though the findings of Jokela et al Reference Jokela, Batty, Vahtera, Elovainio and Kivimäki4 present some reassurance that overall access seems to be becoming more equitable. The findings in this current edition of the Journal have not clarified whether there is consistency of proportionality in response – in Australia there are indications that there might indeed be variation, even where access seems relatively equitable. This possibility needs further investigation in Australia and also in the UK based on other data-sets. The work described by Jokela et al relates only to the first or early waves of the IAPT programme, so it will need to be re-examined once full coverage has been achieved over the next 4 years. It would also be interesting to examine, in due course, the effect of self-referral (currently lower than expected) and wider referral from other agencies as a result of closer integration of IAPT with other services in the context of socioeconomic status.


eLetters
No eLetters have been published for this article.