


Violence risk assessment is an increasing part of psychiatric practice. Psychiatrists, psychologists and other health professionals seeking to manage the risk of their patients acting violently have a range of structured risk assessment instruments (SRAIs) to assist them. These instruments score a patient on variables associated with violence. Such scores are then either combined mathematically (the ‘actuarial’ approach) or assist clinicians in making risk classifications (the ‘structured professional judgement’ approach). The most widely used instruments have satisfactory psychometric qualities in a range of settings and populations, Reference Otto and Douglas1 and are reported to provide more accurate predictions of violence than unstructured clinical assessments. Reference Conroy and Murrie2
Despite the widespread use of SRAIs by mental health practitioners in general and forensic settings, Reference Buchanan, Binder, Norko and Swartz3-Reference Viljoen, McLachlan and Vincent6 the role of these instruments remains the subject of extensive debate. Reference Buchanan, Binder, Norko and Swartz3,Reference Tyrer7 Some of the controversy relates to the applicability of group-derived risk estimates to an individual case. Reference Hart, Michie and Cooke8 Studies of the predictive validity of SRAIs have shown that they can be used to rank individuals in terms of their likelihood of violence. At follow-up, for most groups studied, a randomly selected person who had engaged in violence will have scored more highly than a randomly selected person who had not in approximately 70% of cases. Reference Cook9,Reference Singh, Grann and Fazel10 This is a measure of SRAIs’ ability to establish what has been referred to as the ‘relative’ risk for participants in a sample. Reference Helmus, Hanson, Thornton, Babchishin and Harris11
In clinical practice, however, the absence of a comparison group puts a premium on establishing an individual’s ‘absolute’ violence risk. Reference Helmus, Hanson, Thornton, Babchishin and Harris11 The actuarial approach to this task uses the violence rates of groups with a given score in past follow-up studies as an estimate of the likelihood that a future person with that score will act violently. In such schemes, individuals are assigned a numerical probability based on their score. The alternative, structured professional judgement (SPJ) approach allocates patients to one of several classes (e.g. high, moderate or low risk). Both approaches depend for their clinical usefulness on the rates of violence for people with similar scores or classifications being stable. Research suggests that this is not the case when SRAIs are used to predict sexual offending, Reference Helmus, Hanson, Thornton, Babchishin and Harris11-Reference Helmus, Hanson and Thornton13 and it has been argued on theoretical grounds that it may not be the case for violent offending either. Reference Mossman14
If violence rates in groups classified as high risk are unstable across study populations, there are a number of possible explanations. Several authors have suggested that for statistical reasons the rate of violence among high-risk cases should rise as the rate of violence rises in the population as a whole. Reference Helmus, Hanson and Thornton13,Reference Mossman14 This explanation seems to preclude any numerical probability from being reliably assigned to an individual’s violence risk without reference to local base rates. It is also possible that the clinical discretion granted to SPJ users, but not to clinicians employing actuarial approaches, leads them to classify different groups of individuals as high risk. Further variation may result from features of the design of the study, such as follow-up in a hospital rather than in the community, or reliance on criminal conviction as opposed to self-reported violence as an outcome. Reference Singh and Fazel15 The prevalence of known risk factors for violence, such as age and gender, will also vary from one study to another. Finally, differences between countries and legal systems may lead to preventive measures, such as effective treatment and supervision, being more widely used.
Despite the increasing use of SRAIs, the rates of violence in groups classified as high risk by these instruments have not been systematically described, nor have the sources of any variability been studied. We examined data from predictive validity studies of the most widely used instruments to investigate the extent and sources of variation in rates of violence by individuals judged to be high risk. Specifically, we examined the degree to which variation in rates of violence in high-risk groups was explained by:
-
(a) the rate of violence in individuals not classified as high risk;
-
(b) the type of instrument administered;
-
(c) methodological differences;
-
(d) sample characteristics;
-
(e) geographic location.
We focused on rates of violent behaviour in high-risk patients, as these are the individuals for whom clinicians are most likely to consider additional treatment, in-patient stay or supervision for the purposes of risk reduction.
Method
Risk assessment instruments
The nine risk assessment instruments most commonly used in clinical practice according to a recent international survey were included, Reference Viljoen, McLachlan and Vincent6 five of which were actuarial and four of which employed the SPJ approach. Actuarial instruments comprised the Level of Service Inventory - Revised (LSI-R), Reference Andrews and Bonta16 the Psychopathy Checklist - Revised (PCL-R), Reference Hare17 the Sex Offender Risk Appraisal Guide (SORAG), Reference Quinsey, Harris, Rice and Cormier18 the Static-99, Reference Harris, Phenix, Hanson and Thornton19 and the Violence Risk Appraisal Guide (VRAG). Reference Quinsey, Harris, Rice and Cormier18 The SPJ instruments comprised the Historical, Clinical, Risk Management - 20 (HCR-20), Reference Webster, Douglas, Eaves and Hart20 the Sexual Violence Risk - 20 (SVR-20), Reference Boer, Hart, Kropp and Webster21 the Spousal Assault Risk Assessment (SARA) and the Structured Assessment of Violence Risk in Youth (SAVRY). Reference Kropp, Hart, Webster and Eaves22,Reference Borum, Bartel and Forth23
Systematic search
A systematic search was conducted to identify studies that measured the predictive validity of the nine instruments (Fig. 1). PsycINFO, EMBASE, Medline and the US National Criminal Justice Reference Service Abstracts were searched between 1 January 1995 and 1 January 2011 using the acronyms and full names of the instruments as keywords. This search was supplemented with studies identified through references, annotated bibliographies and correspondence with risk assessment experts. Investigations from any country in any language were considered for inclusion. Unpublished studies (government reports, conference presentations, Master’s theses and doctoral dissertations) were also considered. Actuarial instruments’ development studies were excluded, as were studies that used only select scales of an instrument and retrospective studies where risk assessment instrument coders were not masked to outcome.
To be included in the study, the rate of violence for participants classed as high risk (standardised according to the most recent version of the instruments’ manuals) and information on time at risk must have been available either in the published article or from the authors. In studies where several instruments were administered, rate data were included for each instrument and counted separately. When studies used samples composed of the same participants, the study with the largest sample size was included.
The initial search for predictive validity studies identified 468 investigations relating to the nine instruments. The rate of violence in individuals judged to be at high risk according to instruments’ manuals and time at risk information was available in the manuscripts of 21 eligible studies. Information from the remaining studies was requested directly from study authors and obtained for 26 studies. As none of these studies reported the rate of violence in individuals administered the LSI-R and judged to be at high risk, that instrument was excluded from further analysis. Details of the included studies can be found in online Table DS1.
Data extraction
One author (J.P.S.) extracted rate information, study features and sample characteristics from the validity studies using a standardised coding sheet. As a measure of quality control, six (12.8%) of the included articles were randomly selected and coded by another author (A.B.). A high level of interrater agreement was established (κ = 0.95). Reference Landis and Koch24
Statistical analysis
Descriptive statistics were calculated for the mean rate of violence in individuals classed as high risk both for each instrument and overall for all instruments combined. Rates of violence in the high-risk group were defined as the ratios of the number of offending individuals in the high-risk group to the total number of individuals classified as high risk. Annualised rates were defined as violence rate divided by length of follow-up and capped at 100%. Variability in rates was measured using the I 2 index, calculated based on χ2 differences between individual sample rates and the overall rate weighted by inverse variances. The I 2 index describes the percentage of variation across samples due to between-study variability rather than sampling error alone.
Univariate binomial logistic regression analyses were then conducted to examine sources of variation in the rate of violence in the groups judged to be at high risk. The first source of variation considered was that samples with overall higher rates of violence might produce higher rates in individuals classed as high risk, specifically. By definition, the overall rate of violence included the individuals judged to be at high risk. Therefore, to avoid double counting, we employed as a proxy the rate of violence in participants not classified as high risk.
Univariate analyses were also conducted to assess the effects of the following additional variables on rates of violence for individuals classed as high risk: the type of risk assessment instrument (actuarial v. SPJ), outcome location (community v. other), choice of outcome measure (criminal conviction v. other), gender (percentage of sample that was male), mean sample age (in years) and geographic location (North America v. other). The fitting algorithms weighted the data contribution of the different studies by taking into account the variances in each study.
Predictors found to be significant at the P<0.05 level in the univariate analyses were entered into a multivariable logistic regression model to estimate adjusted effects. Backward elimination was used to drop non-significant effects from the model at the α = 0.05 significance level. Odds ratios and their corresponding 95% confidence intervals were used to interpret the remaining significant effects. All regression analyses were two-tailed and controlled for sample size, time at risk and study design (prospective v. non-prospective).
The present study aimed to explain variability in rates of violence in high-risk groups using information from individual studies. It did not seek to estimate the overall magnitude of an effect comparing experimental and control groups. For this reason, binomial logistic regression taking into account the variances of the rates of violence in high-risk groups in individual studies was preferred to meta-analytic approaches such as those based on log odds ratios. To assess the sensitivity of our results to the choice of data-analytic method, however, a post hoc general linear model meta-analysis was conducted of the log odds of violence in groups classified as high risk as a function of the covariates discussed above weighting the studies by their inverse variances. Log odds of violence were modelled, rather than the log odds ratios employed by other meta-analytic reviews, owing to the absence of a control group. All statistical analyses were performed using SAS version 9.3 for Windows.
Results
Information was collected on 13 045 participants in 57 samples from 47 independent studies (Fig. 1). Reference Arbach and Pueyo25-Reference Wormith, Olver, Stevenson and Girard71 The instrument with the most predictive validity studies in which violence rates in high-risk groups were available was the VRAG (10 studies, 21.3%). The average sample was composed of 244 men (s.d. = 412) and had a mean age of 32.4 years (s.d. = 9.3). Approximately half of studies (21 studies, 44.7%) relied on criminal conviction as their outcome, with most studies using outcomes resulting from a violent incident in the community; such incidents were reported in 36 studies (76.6%). Studies were conducted in 13 countries, namely Argentina, Austria, Canada, Denmark, Finland, Germany, The Netherlands, New Zealand, Serbia, Spain, Sweden, the UK and the USA (Table DS1).
Outcome rates
Across instruments, the mean rate of violence for individuals classified as high risk was 54.8% (s.d. = 27.9, median = 57.6, inter-quartile range (IQR) 33.3-76.1, range 0.0-100.0) over an average time at risk of 55.4 months (s.d. = 41.8, range 0.9-194.4). The mean annualised rate of violence in high-risk groups was 23.1% (s.d. = 28.7, median = 12.9, IQR 6.5-19.0, range 0.0-100.0; I 2 = 92%). The mean, standard deviation and range of rates per year of violence in individuals classed at high risk using each of the eight instruments are shown in Table 1. The distribution of annualised rates with respective 95% confidence intervals for actuarial and SPJ instruments are displayed in Figs 2 and 3. The I 2 indices of rates for actuarial and SPJ instruments are 89% and 76% respectively, indicating that the majority of variability in violence rates is not due to chance.
Binomial logistic regression
Univariate analyses demonstrated an increased rate of violence in non-high-risk groups, the use of an SPJ instrument, non-community follow-up, an outcome other than conviction, fewer men in a sample and younger participants were associated with increased rates of violence in high-risk groups (Table 2). Backward elimination multivariable logistic regression analysis revealed which factors remained significant after adjustment for other variables (Table 2). The odds of violence in the high-risk group were found to increase by 7% for every unit increase (absolute increase of 1%) in the violence rate of the non-high-risk groups. Individuals classed as high risk by actuarial instruments had 25% lower odds of committing a violent act than individuals classed as high risk by SPJ instruments. Finally, for every 1% decrease in the percentage of men in a study, there was a 2% increase in the odds of violence in individuals classified as high risk.
Table 1 Annualised rate of violence in individuals classified as high risk by eight widely used structured risk assessment instruments
| Annualised rate, % | ||||||
|---|---|---|---|---|---|---|
| Instrument | High-risk group | k Footnote a | Min. | Max. | Mean | s.d. |
| Actuarial | ||||||
| PCL-RFootnote b | Scores ⩾30 | 8 | 0.0 | 100.0 | 18.0 | 33.5 |
| SORAG | Scores ⩾+20 | 6 | 0.0 | 19.0 | 10.4 | 6.6 |
| Static-99 | Scores ⩾6 | 9 | 3.4 | 13.6 | 7.1 | 3.5 |
| VRAG | Scores ⩾+14 | 10 | 6.5 | 75.0 | 22.4 | 20.9 |
| SPJ | ||||||
| HCR-20 | Professional judgement | 9 | 5.0 | 100.0 | 40.6 | 43.8 |
| SARA | Professional judgement | 3 | 16.5 | 22.9 | 19.4 | 3.2 |
| SAVRY | Professional judgement | 9 | 4.3 | 100.0 | 38.6 | 27.6 |
| SVR-20 | Professional judgement | 3 | 3.8 | 5.6 | 8.5 | 6.7 |
HCR-20, Historical, Clinical, Risk Management-20; Max., maximum; Min., minimum; PCL-R, Psychopathy Checklist - Revised; SARA, Spousal Assault Risk Assessment; SAVRY, Structured Assessment of Violence Risk in Youth; SORAG, Sex Offender Risk Appraisal Guide; SPJ, structured professional judgement; SVR-20, Sexual Violence Risk-20; VRAG, Violence Risk Appraisal Guide.
a. Number of samples.
b. Instrument not originally developed for the purpose of forensic risk assessment.
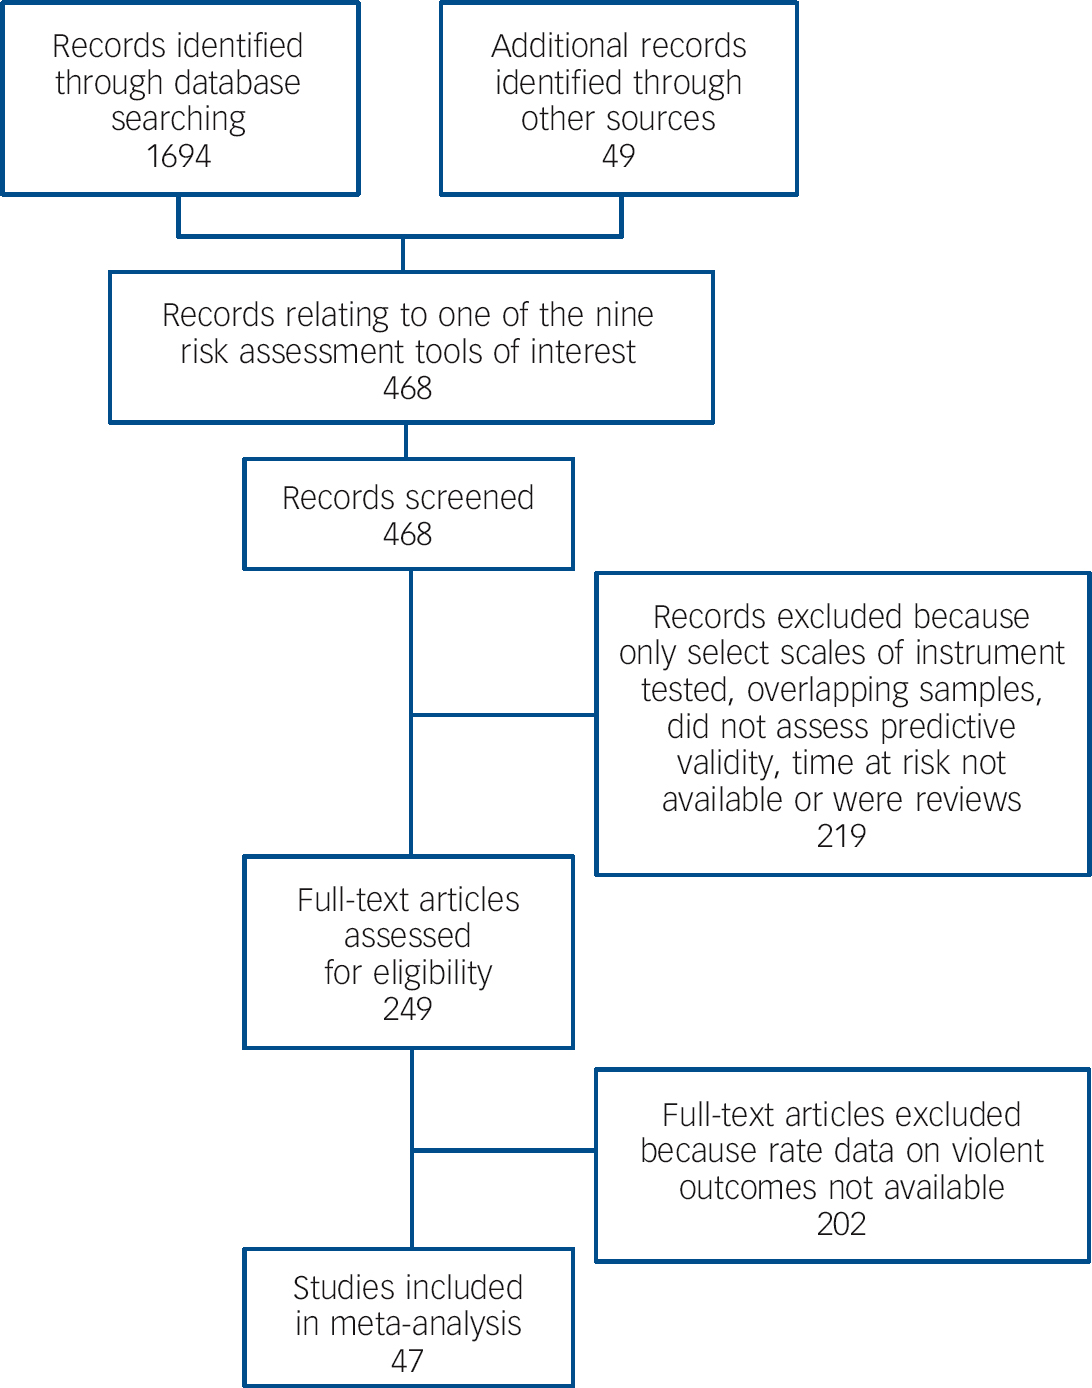
Fig. 1 Systematic search for predictive validity studies of commonly used structured violence risk assessment instruments.
Sensitivity analysis
General linear model meta-analysis of log odds for violence weighted by inverse variances produced similar results to logistic regression. In particular, backward elimination dropped the same predictors in the same order. The remaining significant predictors were the same, with similar effects.
Discussion
For structured instruments to be of greatest use to clinicians, the violence rates for high-risk groups in different clinical settings and different patient populations should be similar. The principal finding of this study is that, after adjusting for sample size, time at risk and study design, overall rates of violence in groups deemed high risk varied substantially both within and between instruments. Although the median annual rate of violence in high-risk groups is 12.9%, half of samples reported rates that were either below 6.5% or above 19.0%. The importance of considering local base rates of violence in the risk assessment process has been discussed theoretically; Reference Szmukler72 however, this variation in high-risk groups has (to our knowledge) not been demonstrated previously and provides empirical support for caution in the use of risk estimates derived from SRAIs to influence clinical decisions related to individual liberty and public safety (detention in general and forensic psychiatric hospitals, discharge from psychiatric hospital, release from prison and length of community supervision). Reference Hart, Michie and Cooke8,Reference Fazel, Singh, Doll and Grann73 In particular it calls into question recommendations for the use of SRAIs that do not emphasise the role of local base rates. Reference Eastman, Adshead, Fox, Latham and Whyte74

Fig. 2 Actuarial risk assessment instruments: annualised rates of violence in high-risk groups.
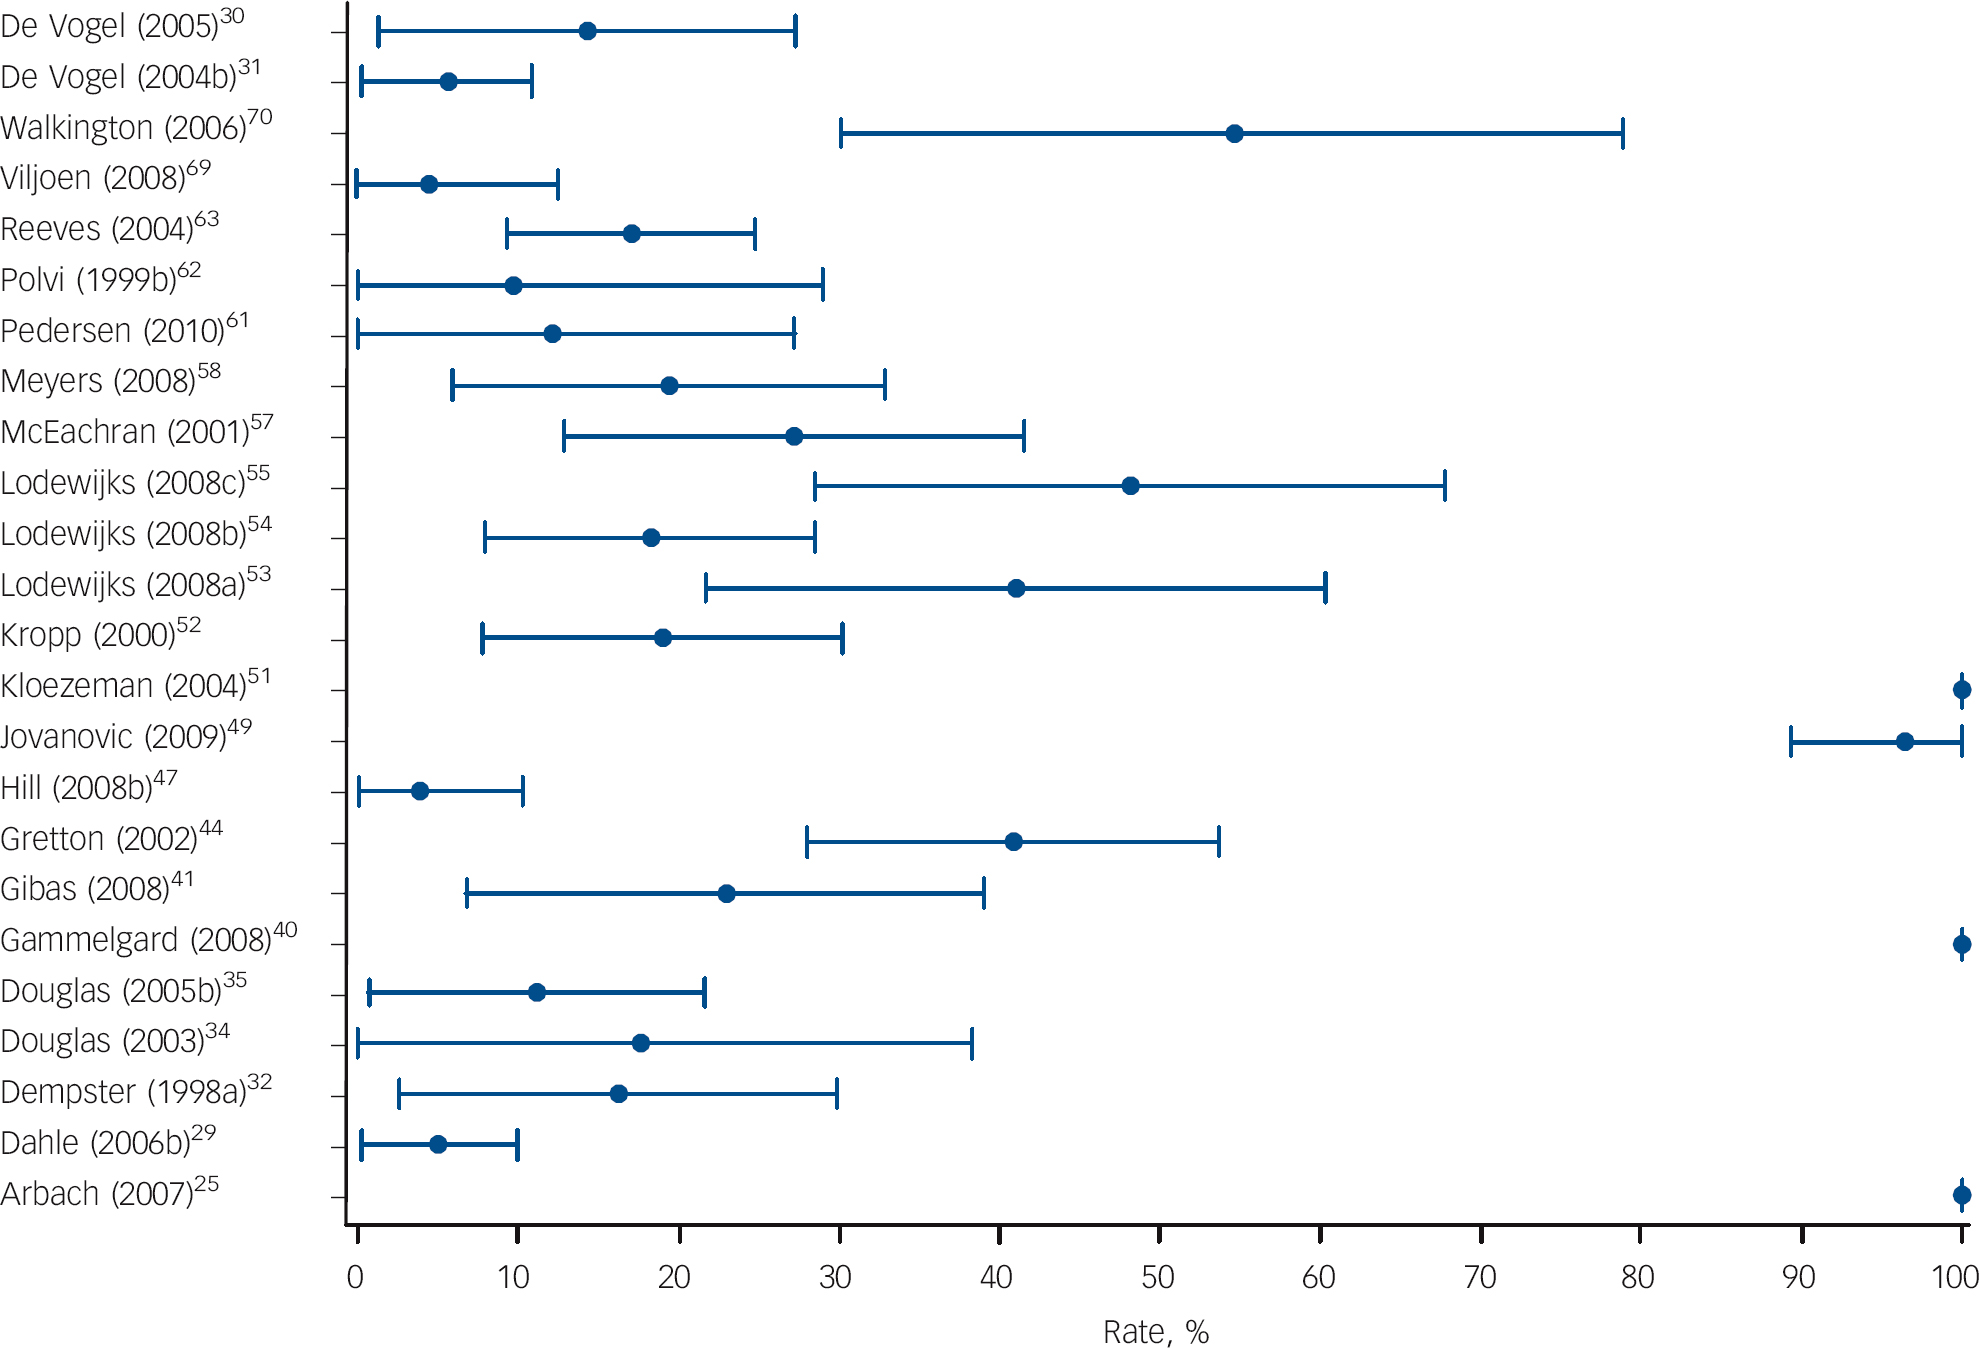
Fig. 3 Structured professional judgement risk assessment instruments: annualised rates of violence in high-risk groups.
Table 2 Predictors of rates of violence in individuals classified as high risk: binomial logistic regression
| Rate of violence in high-risk group (k = 57)Footnote a | ||||
|---|---|---|---|---|
| Univariate | Multivariable | |||
| OR (95% CI) | P | OR (95% CI) | P | |
| General risk level of sample: rate in non-high-risk groups | 1.07 (1.06-1.08) | <0.0001 | 1.07 (1.06-1.07) | <0.0001 |
| Type of risk assessment instrument: actuarial v. SPJ | 0.53 (0.45-0.63) | <0.0001 | 0.75 (0.62-0.92) | 0.004 |
| Location of outcome: community v. other | 0.36 (0.28-0.46) | <0.0001 | NSFootnote b | |
| Choice of outcome measure: conviction v. other | 0.66 (0.55-0.78) | <0.0001 | NSFootnote c | |
| Gender: percentage men | 0.97 (0.96-0.98) | 0.002 | 0.98 (0.97-0.99) | <0.0001 |
| Age: mean age of participants | 0.96 (0.95-0.98) | <0.0001 | NSFootnote d | |
| Geographic location: North America v. other | 1.02 (0.87-1.20) | 0.80 | NA | |
NA, not applicable; NS, not significant and dropped from model; OR, odds ratio; SPJ, structured professional judgement.
a. All analyses adjusted for sample size, time at risk and study design (prospective v. non-prospective); k = number of samples.
b. Variable dropped second from backward stepwise model.
c. Variable dropped third from backward stepwise model.
d. Variable dropped first from backward stepwise model.
The variation in rates of violence in patients classified as high risk is not random, with elevated rates in studies where the rate of violence for non-high-risk patients (and hence in all patients) is increased, where an SPJ instrument is used, and in which there are fewer men. It has been argued elsewhere that applying probabilities from groups to individuals for the purposes of violence risk assessment is not reliable. Reference Hart, Michie and Cooke8 The data we report point to a different problem: that rates of violence in high-risk groups depend on local factors, and no general assumptions can be made about the probability of violent behaviour. That the rate of violence in patients classified as high risk varies with the base rate of the overall sample and that such local base rate information should be incorporated into individual risk assessments concords with Bayes’ theorem. Reference Bayes and Price75 However, there currently exists no resource that allows practitioners to systematically identify local base rates for different forms of violence in different psychiatric populations.
Previous studies have suggested that providing individuals undertaking risk assessment with such prevalence information might improve predictive accuracy. Reference Arkes76,Reference Arkes77 Empirical evidence also suggests, however, that even when base rates are taken into account there remains substantial variation in the predictive accuracy achieved by different instruments in different settings. Reference Singh, Grann and Fazel10 Future research will be of greatest assistance to clinicians where it takes into account all of these variables in examining the performance of SRAI risk classifications.
Using the operational definitions of this study, individuals classified as high risk by actuarial assessments have reduced violence rates compared with those classified as high risk by SPJ instruments. As actuarial and SPJ approaches have similar predictive validity, Reference Singh, Grann and Fazel10,Reference Guy78 this is unlikely to be a consequence of SPJ instruments being more successful at identifying those who will be violent. It is more likely a consequence of the procedure that we, like previous researchers, Reference Dempster32 followed in defining an actuarial category corresponding to SPJ high risk. Nominal labels such as ‘high’, ‘moderate’ and ‘low’ are known to be interpreted inconsistently by clinicians and others. Reference Hilton, Carter, Harris and Sharpe79 Future comparisons of actuarial and SPJ approaches should consider using different ways of generating categories with similar levels of risk, perhaps by reserving high-risk classifications for actuarial scores higher than those we used.
Being male is a known demographic risk factor for violence. When a known risk factor is the source of systematic variation in violence rates for groups classified as high risk, this suggests that that risk factor is being allocated an incorrect weight. The error is capable of being made in either direction. In this case, structured assessments attributed too much weight to the increased risk associated with a person being male. The discovered effect is substantial: if the percentage of a sample is increased by, say, 10%, the odds of violence decrease by 22%. The explanation for this may lie in the threshold for admitting women to secure settings being higher than that for men, resulting in a population of women at higher risk of violence. This finding is consistent with previous research suggesting that being male is less of a risk factor in mental health populations than in the general population, Reference Lidz, Mulvey and Gardner80-Reference Rabinowitz and Garelik-Wyler82 and that violence in female mental health populations is underrecognised. Reference Dean, Walsh, Moran, Tyrer, Creed and Byford83
Limitations of the study
There are several potential limitations to this review. First, we did not seek to examine the full range of SRAIs available, of which there are over 150. Reference Singh, Serper, Reinharth and Fazel84 We did, however, choose those most commonly used in clinical practice according to a number of recent surveys. Second, we were unable to obtain rate information from all eligible studies as this information was rarely reported in manuscripts. However, the data presented here show that variation in rates of violence for individuals classified as high risk is a general phenomenon and is not limited to a particular instrument. Consequently, it seems unlikely that the use of different instruments or the inclusion of all eligible studies would have resulted in a more homogeneous set of samples. Third, the reliability of information used to administer the included risk assessment tools and the reliability of information used to determine outcome occurrence was not routinely reported to allow us to adjust for these potential moderators. It may be that there is less variation in violence rates for high-risk patients when assessments are made and outcomes detected using more reliable sources of information. Fourth, we did not have the necessary information to be able to investigate how findings might have changed when different thresholds were used to class individuals as high risk. It may be that using higher thresholds (resulting in increased specificity) could have resulted in an improved ability to identify a small group of individuals at very high risk, although this would have also resulted in an increased rate of false negative predictions. Fifth, we needed to rely on the percentage of men in samples in our analyses rather than investigating the rate of violence in male and female high-risk groups separately. Therefore, caution may be warranted in interpreting the findings relating to gender as there may have been an aggregation bias in our continuous covariate. Finally, the number of samples for individual instruments was too small to investigate sources of rate heterogeneity in each instrument separately.
Future directions
In addition to addressing these shortcomings, future studies could examine whether variation in rates of violence for patients classified as high risk can be reduced by providing clinicians with information on outcome rates in individuals with similar clinical, geographical or criminal history backgrounds. A second area for future research concerns the operational definition of the term ‘high risk’. Some of the variation between rates of violence in groups with the label may be a consequence of the inconsistent use of this term, suggesting that the use of more detailed operational definitions may reduce the degree of variation across studies and instruments.
As unstructured clinical assessments of violence risk remain common in practice, Reference Viljoen, McLachlan and Vincent6 a third area in need of further research is the investigation of variation in rates of violence in patients judged to be at high risk without the use of an SRAI. Data from social psychology suggest that clinicians using unstructured methods are likely also to take insufficient account of base rates in assessing risk. Reference Tversky and Kahneman85 Finally, the possibility that more effective supervision affects rates of violence in patients classed as high risk warrants further investigation.
Implications of the study
After controlling for time at risk, the rate of violence in patients judged to be at high risk by SRAIs is not constant, varying considerably and systematically within and between instruments. Therefore, it does not seem possible to use SRAIs to assign reliably a predetermined numerical probability to the potential for an individual to act violently. This raises the question of whether, if practitioners cannot make a reasonable estimate of the base rate for the population in question and hence cannot estimate the likelihood of a future violent act for a member of a category, they should be using high-risk categorisations at all. These findings support recommendations for caution, given the present state of knowledge, in the use of such probabilistic risk estimates to influence decisions related to individual liberty and public safety. The results of individual risk assessments should be reported with explicit acknowledgement of the possible sources of error associated with their use.
Funding
S.F. is funded by the Wellcome Trust.
Acknowledgements
We are grateful to the following study authors for providing tabular data for the analyses: April Beckmann, Sarah Beggs, Susanne Bengtson Pedersen, Klaus-Peter Dahle, Rebecca Dempster, Kevin Douglas, Reinhard Eher, Jorge Folino, Monica Gammelgård, Grant Harris, Leslie Helmus, Andreas Hill, Hilda Ho, Drew Kingston, P. Randy Kropp, Henny Lodewijks, Jan Looman, Karin Arbach Lucioni, Jeremy Mills, Catrin Morrissey, Martin Rettenberger, Marnie Rice, Michael Seto, Robert Snowden, Jodi Viljoen, and Zoe Walkington.


eLetters
No eLetters have been published for this article.