


Attention-deficit hyperactivity disorder (ADHD) is one of the most common psychiatric disorders characterised by impairments in inattention, hyperactivity and impulsivity 1 and the prevalence in adults has been estimated between 4 and 5%. Reference Kessler, Adler, Barkley, Biederman, Conners and Demler2 Poor long-term outcomes of children followed to adulthood have been documented in both treated and untreated samples. Reference Molina, Hinshaw, Swanson, Arnold, Vitiello and Jensen3,Reference Klein, Mannuzza, Olazagasti, Roizen, Hutchison and Lashau4 Response to medications is lower in adults with ADHD compared with those in children, and comorbid conditions alongside ADHD in adults appear to lower the response further. Reference Torgersen, Gjervan and Rasmussen5 Concerns over adverse effects of medications, limited accessibility to psychotherapy, reduced responses because of comorbidities and disappointing long-term outcomes have resulted in many individuals with ADHD seeking alternative treatments. Reference Baumgaertel6,Reference Nigg7 Notwithstanding some negative studies in the 1970s and 1980s, Reference Mattes and Gittelman8,Reference Arnold, Christopher, Huestis and Smeltzer9 there has been a recent resurgence in interest regarding the effects of diet and nutrient interventions on ADHD symptoms. Reference Nigg, Lewis, Edinger and Falk10 Topics investigated include the impact of processed foods, Reference Howard, Robinson, Smith, Ambrosini, Piek and Oddy11 elimination diets, Reference Pelsser, Frankena, Toorman, Savelkoul, Dubois and Pereira12 food dyes, Reference Arnold, Lofthouse and Hurt13 essential fatty acids Reference Milte, Parletta, Buckley, Coates, Young and Howe14 and early malnutrition. Reference Galler, Bryce, Zichlin, Fitzmaurice, Eaglesfield and Waber15 Despite this growing interest, the number of robust randomised controlled trials (RCTs) testing nutrient interventions is few in comparison with the numerous studies of psychopharmacological treatments. Reference Rucklidge, Johnstone and Kaplan16
There is an expanding evidence base concerning the role of micronutrients (vitamins and minerals) in the pathophysiology and management of psychiatric symptoms including mood, stress and autism. Reference Gately and Kaplan17-Reference Adams, Audhya, McDonough-Means, Rubin, Quig and Geis19 Proposed mechanisms by which micronutrients could be beneficial for mental illness include functioning as cofactors for various metabolic pathways in the brain, Reference Ames, Elson-Schwab and Silver20 correcting inborn errors of metabolism, Reference Kaplan, Crawford, Field and Simpson21 improving mitochondrial function and membrane functioning, Reference Gardner and Boles22 and promoting healthy gastrointestinal functioning and improved absorption of nutrients. Reference Jackson, Eaton, Cascella, Fasano and Kelly23 All these proposed mechanisms support a broad-based nutrient approach rather than an individual nutrient (for example zinc, iron), the more typical method studied in the treatment of ADHD Reference Bilici, Yildirim, Kandil, Bekaroglu, Yildirmis and Deger24-Reference Arnold, Disilvestro, Bozzolo, Bozzolo, Crowl and Fernandez26 but an approach that has yielded modest and often inconsistent findings. Reference Rucklidge, Johnstone and Kaplan16 Only one masked RCT has assessed the effects of broad-spectrum nutrients in ADHD. Reference Katz, Adar Levine, Kol-Degani and Kav-Venaki27 Children taking an herbal supplement for 4 months showed greater improvements on the Test of Variables of Attention (TOVA), but the doses and type of individual nutrients were not quantified. Other studies assessing micronutrient combinations for the treatment of ADHD have reported positive benefits but have been open-label, Reference Patel and Curtis28-Reference Rucklidge, Taylor and Whitehead30 retrospective database analyses, Reference Rucklidge, Gately and Kaplan31 case reports Reference Rucklidge and Harrison32 or patient-preference studies. Reference Harding, Judah and Gant33 This paper presents the first double-blind, parallel-group RCT designed to assess the efficacy and safety of a broad-spectrum micronutrient formula, EMPowerplus, compared with placebo in medication-free adults with ADHD. This micronutrient formula has been examined in over 20 published studies for treating various mental conditions, has documented evidence of both short- and long-term safety data Reference Simpson, Crawford, Goldstein, Field, Burgess and Kaplan34 and has been more extensively examined in psychiatric conditions than any other multivitamin/multimineral formula; Reference Rucklidge and Kaplan35 however, as of yet, no masked trials have been conducted on it. Efficacy measures included standardised self-report, observer-rated and clinician-rated scales capturing attention, hyperactivity/impulsivity, mood, quality of life and overall psychiatric functioning.
Method
Participants and entry criteria
Participants were recruited in Canterbury, New Zealand, from May 2009 to May 2012 via referrals from public services, private clinicians, and self-referrals based on advertisements. From 136 referrals, 80 adults (age ⩾16 years) with ADHD were assigned in a 1:1 ratio to 8 weeks of treatment with either micronutrients or placebo (Fig. 1). Of the final sample, 44 (55%) were self-referred and the remainder were referred by mental health professionals in the community (with no group differences observed between the two groups). The study was approved by both the National Upper South A Health and Disability Ethics Committee and the Human Ethics Committee at the University of Canterbury. After a complete description of the experimental nature of the trial as well as a review of conventional treatments available, written informed consent was obtained from all participants. The trial was prospectively registered (Australian New Zealand Clinical Trials Registry: ACTRN12609000308291).
Only individuals not taking psychiatric medications were considered (that is, who were medication-free for at least 4 weeks). Participants were allowed to continue psychological therapies (n = 3) and supplements such as essential fatty acids if dose and intensity did not change throughout the duration of the study (n = 0). Participants with any of the following were excluded: (a) neurological disorder involving brain or other central nervous system function (such as epilepsy); (b) pregnant or breastfeeding; (c) evidence of untreated or unstable thyroid disease; (d) any known abnormality of mineral metabolism (such as Wilson’s disease, haemochromatosis); (e) abnormal baseline biochemistry or haematology laboratory values as assessed by the study physician (A.B.); or (f) judged clinically to be at serious risk of suicide or violence. These criteria resulted in three participants being excluded, all due to abnormal blood work at baseline. Medications for physical conditions were considered individually but generally were allowed; two were taking birth control pills, one was taking thyroxine and one was taking a statin.
Participants had to meet criteria for ADHD based on the Conners Adult ADHD Diagnostic Interview for DSM-IV (CAADID) Reference Epstein, Johnson and Conners36 or, for those under 18 years (n = 7), the Schedule for Affective Disorders and Schizophrenia for School-Aged Children - Present and Lifetime version (Kiddie-SADS-PL). Reference Kaufman, Birmaher, Brent, Rao, Flynn and Moreci37 Information on historical symptoms was obtained for all participants either directly from the participants if possible or from reviewing past report cards or psychological assessments (if available) or interviewing family members for supporting information. In addition, participants had to have an elevated level (T-score >65) on one or more of the three DSM-IV subscales of the Conners Adult ADHD Rating Scales (CAARS) Reference Conners, Erhardt and Sparrow38 on either the self or the observer versions. For participants under 18 years, the Conners Rating Scales for youth and parents were completed. Reference Conners39 Thirty-four (42.5%) of the participants had already received a diagnosis of ADHD from other mental health professionals.
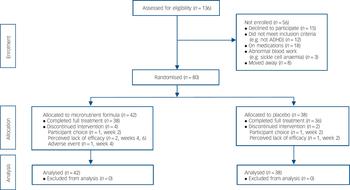
Fig. 1 CONSORT flow diagram.
ADHD, attention-deficit hyperactivity disorder.
The Structured Clinical Interview for DSM-IV-TR Axis I Disorders (SCID-I) Reference First, Spitzer, Gibbon and Williams40 was also administered to assess co-occurring disorders and to determine whether another psychiatric disorder could better account for the ADHD symptoms. We purposefully included participants with other Axis I disorders, acknowledging the limitations but also appreciating that the clinical utility of the results would be more meaningful if the sample was representative of individuals affected by ADHD. Clinical interviews were conducted by clinical psychologists or senior clinical psychology graduate students. All the participants were discussed by a team with a senior clinician; 10% of interviews were independently rated, with 100% agreement in diagnosis.
Efficacy and safety assessments
All participants were monitored by a clinical psychologist or senior clinical psychology graduate student under a psychologist’s supervision with face-to-face meetings or telephone contact at the screening visit, baseline, and weeks 1, 2, 4, 6 and 8 (or end of study). At each post-screening visit, the following measures were completed: (a) the Clinical Global Impression - Improvement (CGI-I) Scale, Reference Guy41 producing two scores: CGI-I-ADHD (reflecting change in ADHD symptoms) and CGI-I - Overall Impression (capturing global change in functioning from baseline, acknowledging that individuals with ADHD typically present with many psychiatric symptoms beyond ADHD); (b) the Montgomery-Åsberg Depression Rating Scale (MADRS), Reference Montgomery and Åsberg42 a 10-item scale administered by a trained clinician who assigns a severity rating for each symptom of depression based on a personal interview. Interrater reliability on a subset of these interviews (intraclass correlation coefficient) was estimated at 0.98; and (c) the Global Assessment of Functioning (GAF), 1 a numeric scale (1 through 100) used by mental health clinicians to rate the general functioning of adults.
At baseline and at 8 weeks, the clinician also completed:
-
(a) the CAARS - Observer: Screening Version (CAARS-O:SV) Reference Conners, Erhardt and Sparrow43 based on the clinician’s impression of functioning on the items over the previous 8 weeks. This scale provides four subscales including DSM-IV inattention, DSM-IV hyperactivity/impulsivity and DSM-IV ADHD symptoms total. All raw scores are converted to T-scores based on age and gender. The use of T-scores makes interpretations of change more clinically relevant.
-
(b) The Longitudinal Interval Follow-up Evaluation - Range Impaired Functioning Tool (LIFE-RIFT), Reference Leon, Solomon, Mueller, Endicott, Posternak and Judd44 which explores psychosocial functioning over the previous week in four domains: work, interpersonal relations, recreation and global satisfaction. It also evaluates how impairing the psychiatric symptoms are across these domains.
At baseline and 8 weeks (or end of study visit), each participant completed the CAARS-Self-Report: Long version (CAARS-S:L), Reference Conners, Erhardt and Sparrow43 which includes three DSM-IV subscales for inattention, hyperactivity/impulsivity and combined inattention and hyperactivity/impulsivity. Finally, participants asked someone they knew well, typically a spouse, friend or a parent, to act as an observer and complete a CAARS - Observer Scale: Long Version (CAARS-O:L). Reference Conners, Erhardt and Sparrow43 Twenty (25%) of our participants did not have anyone close to them who could complete the scale.
Other areas assessed included participant’s expectancy of benefit measured by asking how much the participant expected to improve from 0 (‘not at all’) to 3 (‘very much’), a brief diet intake questionnaire (modified from Baker et al Reference Baker, Little and Brownell45 to assess dietary patterns including consumption of fruit and vegetables, breakfast, consumption of fast foods and eating when full), fortnightly consumption of alcohol, cigarettes, caffeine and illicit drugs, and therapeutic alliance assessed by participants at the end of the RCT phase using a modified version of the Helping Alliance Questionnaire (HAQ), Reference Alexander, Luborsky, Greenberg and Pinsof46 which consisted of five items assessing the therapeutic relationship developed between the participant and the clinician monitoring them.
Treatment response was defined a priori in two ways: (a) ⩾30% decrease, which is a standard percentage change in ADHD ratings used in the ADHD literature, Reference Wilens, Haight, Horrigan, Hudziak, Rosenthal and Connor47 on any of the self-report CAARS DSM-IV subscales; and (b) a final CGI-I - Overall Impression of either ‘much’ or ‘very much’ improved in order to assess improvement globally across all areas of functioning.
Procedures
At baseline and trial completion, there were laboratory tests for thyroid function, serum lipids, prolactin, fasting glucose, blood clotting, iron, zinc, vitamin D, vitamin B12 and copper levels, urinalysis and urine drug screen. Participants were randomly assigned to treatment using a computer-generated randomisation sequence. Medication kits containing all required study medication for the 8-week intervention were prepared by the pharmacist in advance. Only the pharmacist had access to the randomisation list until all study data had been adjudicated and the study database was completed and locked. This process ensured participants, investigators and clinicians were unaware of the participant’s treatment allocation.
Once eligibility was confirmed and baseline assessment completed, participants were allocated to the next sequentially numbered kit. Participants titrated up their dose over a week to 15 capsules per day, in three doses of 5 capsules, taken with food and water. The micronutrient formula and placebo (see online Tables DS1 and DS2 for ingredients) were identical in appearance. The placebo included a small amount of riboflavin to mimic the smell and urine colour associated with taking vitamins. Unused pills were collected at each assessment to obtain an estimate of adherence. At each visit, participants received a NZ$10 petrol voucher to cover travel costs. No other compensation was provided. Participants were offered daily text messages to remind them to take their pills (36 (45%) participants opted for these). Procedures deviated slightly during the Christchurch earthquakes (4 September 2010 and February 22 2011) for 11 (14%) participants, whose pills were delivered in person or mailed and followed with telephone interviews.
Sample size
An open-label single-arm pilot study using the micronutrient formula provided the basis for the sample size estimation. Reference Rucklidge, Taylor and Whitehead30 Based on within-group effect sizes from this pilot study ranging between 0.90 and 1.70, a sample size of 36 participants per group was required to detect statistically significant (2-tailed α = 0.05) between-group effect sizes of 0.67 or greater with 80% power. These effect sizes approximate minimum clinically significant differences for the primary outcome measures. To allow for an anticipated 10% attrition rate, 80 participants were recruited.
Statistical analyses
The three primary outcome measures defined a priori and reflecting the broad spectrum of ADHD symptoms were the CAARS (self, observer and clinician DSM scales), CGI and MADRS. The changes from baseline to the end of treatment were compared between randomised groups using a repeated-measures ANCOVA, with the baseline level as the covariate. Change measures (CGI-I ratings) assessed at the end of treatment were compared using one-way ANOVA. The treatment effects were summarised by mean differences and 95% confidence intervals generated from the ANCOVA/ANOVA models. Categorical outcomes were compared between groups using chi-squared tests with odds ratios (ORs) and 95% confidence intervals. Adverse event rates were compared between treatment groups using Fisher’s exact tests. All analyses were undertaken on an intention-to-treat (ITT) basis. For those participants not completing the trial, data from their final assessment were used (which may have been baseline). Secondary analyses were undertaken on all outcomes using the per-protocol analysis set. All tests were two-tailed, and P-values less than 0.05 were considered statistically significant.
Results
In total, 80 participants gave informed consent and were randomised, 42 to the micronutrient group and 38 to placebo group. Apart from a significant imbalance in gender ratio (χ2(1, n = 80) = 7.6, P = 0.006) and current anxiety disorder (χ2(1, n = 80) = 4.5, P = 0.03), the two groups were well matched (Table 1). Just over half the sample had a history of taking psychiatric medications, of which 13 (16.3%) had only been prescribed a stimulant, 8 (10%) had been prescribed a stimulant and another psychiatric medication (such as antidepressant, anxiolytic), and 20 (25%) had been prescribed a psychiatric medication other than a stimulant. Fourteen (17.5%) of the participants had received a medication as a child (under 16). Four participants in the micronutrient group did not complete the study; one developed sarcoidosis at week 4 and withdrew, and the remaining three withdrew at weeks 2, 4 and 6. Two participants in the placebo group did not complete the study; both withdrew at week 2 (Fig. 1). The participant masking was successful, with no group differences in what participants thought they were receiving. More participants believed they were taking placebo (64.3% in the micronutrient group, 65.8% in the placebo group).
Primary efficacy outcomes
Intent-to-treat analyses showed significant group differences favouring micronutrient treatment on the self and observer CAARS DSM ADHD symptoms total subscales, but not on the clinician CAARS ratings (Fig. 2). However, based on CGI-I ADHD (Fig. 3) and CGI-I - Overall Impression, clinicians rated ADHD symptoms and global change as more improved in participants taking the micronutrient formula compared with the placebo. There were no group differences in MADRS scores (Table 2). Differences observed between the groups were not altered when gender and presence of an anxiety disorder were included as covariates. Effect sizes of significant differences fell within the medium to large range (0.46 to 0.67).
Table 1 Baseline demographic and clinical characteristics of study participants
| Characteristic | Micronutrient formula group (n = 42) |
Placebo group (n = 38) |
|---|---|---|
| Demographics | ||
| Age, years: mean (s.d.) | 36.39 (14.20) | 33.95 (12.26) |
| Male, n (%) | 22 (52.4) | 31 (81.6) |
| Estimated IQ,Footnote a mean (s.d.) | 111.02 (13.37) | 114.66 (14.6) |
| Socioeconomic status,Footnote b mean (s.d.) | 41.6 (16.3) | 46.1 (19.3) |
| Education, n (%) | ||
| No high school certificate | 13 (31.0) | 7 (18.4) |
| Completed high school | 17 (40.5) | 17 (44.7) |
| Post secondary (e.g. trade certificate) | 3 (7.1) | 5 (13.2) |
| University degree | 9 (21.4) | 9 (23.7) |
| Ethnic origin, n (%) | ||
| New Zealanders of European descent | 33 (78.6) | 31 (81.6) |
| Mäori (indigenous people of New Zealand) | 1 (2.4) | 2 (5.3) |
| Other | 8 (19.0) | 5 (13.2) |
| Married/common-law, n (%) | 18 (42.9) | 20 (52.6) |
| Clinical | ||
| ADHD type, n (%) | ||
| Inattentive | 14 (33.3) | 15 (39.5) |
| Hyperactive/impulsive | 3 (7.1) | 3 (7.9) |
| Combined | 25 (59.5) | 20 (52.7) |
| Mood disorder (major depressive disorder, dysthymia or bipolar disorder), n (%) | ||
| Current | 9 (21.4) | 9 (23.7) |
| Past | 24 (57.1) | 23 (60.5) |
| At least one anxiety disorder, n (%) | ||
| Current | 22 (52.4) | 11 (28.9) |
| Past | 21 (50.0) | 11 (28.9) |
| Multiple anxiety disorders (>2), n (%) | ||
| Current | 9 (21.4) | 3 (7.9) |
| Past | 9 (21.4) | 5 (13.2) |
| Alcohol/substance misuse or dependence, n (%) | ||
| Current | 6 (14.3) | 5 (13.2) |
| Past | 19 (45.2) | 16 (42.1) |
| Reading disability,Footnote c n (%) | 8 (19.0) | 7 (18.4) |
| Any co-occurring disorder, n (%) | ||
| Current | 27 (64.3) | 18 (47.4) |
| Past | 32 (76.2) | 27 (71.1) |
| History of psychiatric medications, n (%) | 20 (47.6) | 21 (55.3) |
| Expectancy of treatment effect,Footnote d mean (s.d.) | 1.64 (0.77) | 1.71 (0.84) |
ADHD, attention-deficit hyperactivity disorder.
a. Assessed using block design and vocabulary subtests of the Wechsler Adult Intelligence Scale (WAIS-III).Reference Wechsler 48
b. Based on the New Zealand Socio-Economic Index (NZSEI-96), which ranks occupations from 10 to 90.Reference Davis, McLeod, Ransom and Ongley 49
c. Defined as having at least one standard score below 85 on either reading or spelling of the Wide Range Achievement Test (WRAT3).Reference Wilkinson 50
d. Measured from 0 (not at all) to 3 (very much).
Other treatment-related outcomes
Consistent with these findings on ADHD Total Symptom scores, intent-to-treat analyses revealed significant group differences separately for both attention (based only on self-report) and hyperactivity/impulsivity (based on both self- and observer report but only a trend based on clinician ratings). The micronutrient group also showed greater overall improvement based on the GAF score, but not on the LIFE-RIFT (Table 2). In the per-protocol analyses, excluding participants who withdrew before 8 weeks (n = 6), the statistical interpretations did not change for any outcome. A further exploration of the MADRS scores revealed a significant difference favouring the micronutrient group when a subsample of those with moderate or severe depression at baseline (MADRS score ⩾20) Reference Snaith, Harrop, Newby and Teale51 was examined (micronutrient group: n = 11, Δ = 9.5 s.e. = 2.7; placebo group: n = 10, Δ = 5.1 s.e. = 2.0, P = 0.039, effect size (ES) = 0.64; Fig. 4).
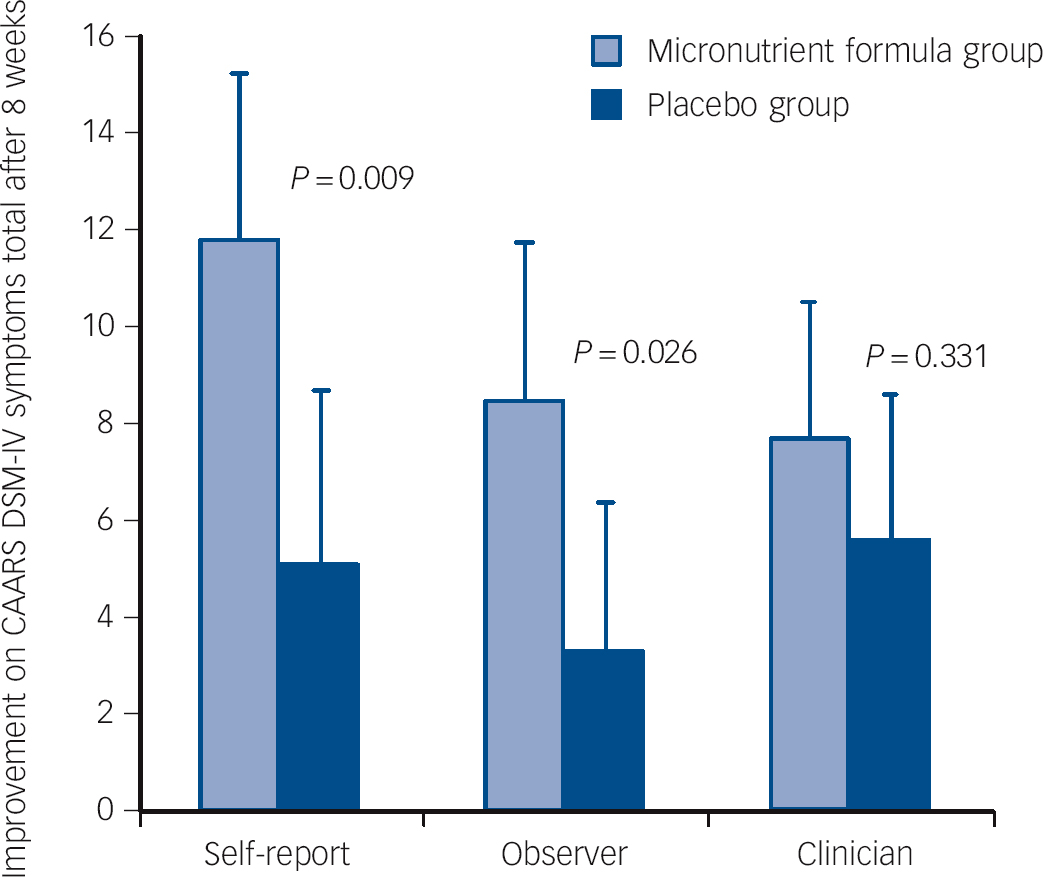
Fig. 2 Improvement on the Conners Adult ADHD Rating Scale (CAARS) DSM-IV symptoms total subscale across the three reporters (self, observer and clinician) and groups.
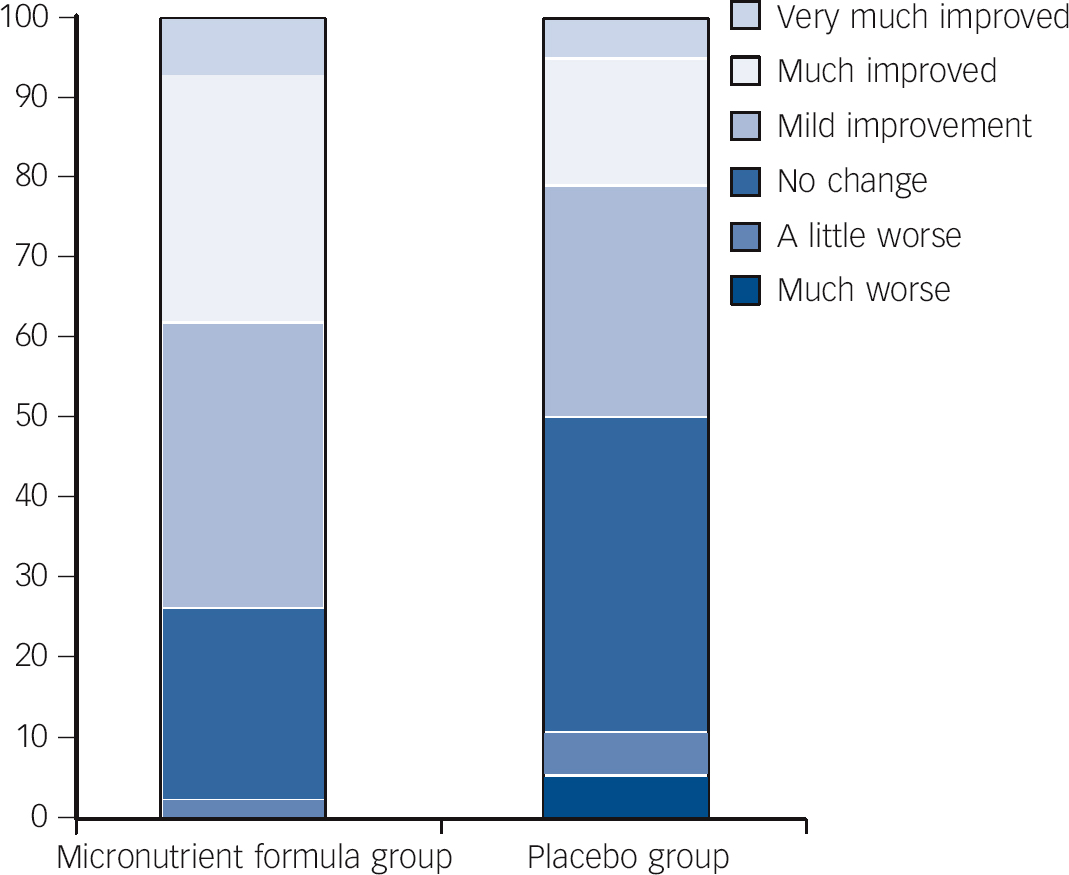
Fig. 3 Per cent within each group falling in the different categories identifying extent of change pre- to post-trial for the micronutrient formula group v. placebo group based on Clinical Global Impressions - Improvement in attention-deficit hyperactivity disorder symptoms (CGI-I-ADHD) scores.
Table 2 Baseline and post 8-week data on primary and secondary outcome measuresFootnote a
| Micronutrient formula group (n = 42) | Placebo group (n = 38) | ||||||||
|---|---|---|---|---|---|---|---|---|---|
| Variable | Baseline Mean (s.e.) |
Post Mean (s.e.) |
Change from baselineFootnote b |
Baseline Mean (s.e.) |
Post Mean (s.e.) |
Change from baselineFootnote b |
Difference (95% CI) | P | Effect sizeFootnote c |
| Primary outcomes | |||||||||
| CAARS DSM-IV ADHD symptoms total | |||||||||
| Self-report | 79.4 (1.5) | 67.3 (2.2) | −11.81 | 75.3 (1.9) | 70.5 (2.3) | −5.10 | −6.71 (−11.72 to −1.70) | 0.009 | 0.61 |
| Observer | 69.5 (2.0) | 61.4 (2.3) | −8.44 | 70.5 (2.0) | 66.9 (2.1) | −3.30 | −5.14 (−9.65 to −0.63) | 0.026 | 0.59 |
| Clinician | 73.4 (1.4) | 65.0 (1.7) | −7.69 | 69.0 (1.4) | 64.1 (1.7) | −5.64 | −2.05 (−6.21 to 2.12) | 0.331 | 0.23 |
| CGI-I-ADHDFootnote c | 2.8 (0.2) | 2.83 | 3.4 (0.2) | 3.40 | −0.56 (−1.03 to −0.09) | 0.020 | 0.53 | ||
| CGI-I - Overall ImpressionFootnote d | 2.8 (0.2) | 2.79 | 3.5 (0.2) | 3.50 | −0.71 (−0.16 to −1.27) | 0.012 | 0.57 | ||
| MADRS, total | 17.2 (1.1) | 11.5 (1.3) | −5.32 | 14.2 (1.1) | 12.0 (1.3) | −2.65 | −2.66 (−5.64 to 0.31) | 0.078 | 0.41 |
| Secondary outcomes | |||||||||
| Self-report: CAARS, T-scores | |||||||||
| DSM-IV inattention | 80.6 (1.3) | 71.2 (2.1) | −9.16 | 77.7 (1.9) | 75.2 (2.2) | −2.61 | −6.54 (−11.29 to −1.80) | 0.007 | 0.62 |
| DSM-IV hyperactivity/impulsivity | 70.1 (2.0) | 58.2 (2.3) | −11.35 | 65.6 (2.2) | 59.6 (2.1) | −6.64 | −4.71 (−9.22 to −0.19) | 0.041 | 0.47 |
| Observer: CAARS, T-scores | |||||||||
| DSM-IV inattention | 67.5 (1.9) | 61.0 (2.3) | −7.48 | 70.7 (1.9) | 65.9 (2.2) | −4.61 | −2.86 (−7.44 to 1.71) | 0.215 | 0.33 |
| DSM-IV hyperactivity/impulsivity | 66.5 (2.1) | 58.7 (2.3) | −7.32 | 65.8 (2.2) | 64.3 (1.9) | −0.94 | −6.39 (−11.35 to −1.43) | 0.013 | 0.67 |
| Clinician: CAARS, T-scores | |||||||||
| DSM-IV inattention | 73.8 (1.2) | 67.6 (1.7) | −5.70 | 70.4 (1.4) | 65.5 (1.8) | −5.47 | −0.23 (−4.66 to 4.21) | 0.919 | 0.02 |
| DSM-IV hyperactivity/impulsivity | 67.1 (2.0) | 58.2 (1.8) | −8.18 | 63.0 (1.7) | 59.0 (1.8) | −4.78 | −3.40 (−7.23 to 0.43) | 0.081 | 0.40 |
| GAF | 58.7 (1.0) | 64.5 (1.4) | 5.58 | 61.5 (1.2) | 63.6 (1.5) | 2.33 | 3.25 (0.07 to 6.44) | 0.045 | 0.46 |
| LIFE-RIFT, total | 10.5 (0.5) | 11.6 (0.3) | −1.04 | 10.8 (0.4) | 11.3 (0.4) | −0.49 | −0.54 (−1.57 to 0.48) | 0.292 | 0.25 |
ADHD, attention-deficit hyperactivity disorder; CAARS, Conners Adult ADHD Rating Scale (all raw scores are converted to T-scores based on age and gender; CGI-I, Clinical Global Impressions - Improvement (the score for the CGI-I ranges from 1 (very much improved) to 7 (very much worse) as compared with baseline functioning); MADRS, Montgomery-Åsberg Depression Rating Scale; GAF, Global Assessment of Functioning (rated 1-100); LIFE-RIFT, Longitudinal Interval Follow-up Evaluation - Range Impaired Functioning Tool.
a. Results in bold are significant.
b. Adjusted for baseline.
c. Cohen’s d (effect size) measured as the mean difference in the change divided by the within-group standard deviation of the difference in the change.
d. Assesses change so not measured at baseline.
Treatment response
At end-point, 27 (64.3%) of those in the micronutrient group v. 14 (36.8%) in the placebo group showed a ⩾30% drop from baseline (χ2(1, n = 80) = 6.014, P = 0.014) on at least one subscale of the CAARS (OR = 3.1, 95% CI 1.2-7.7). Further, 20 (47.6%) of those in the micronutrient group v. 8 (21.1%) in the placebo group (χ2(1, n = 80) = 6.189, P<0.013) were ‘much’ to ‘very much’ improved on the CGI-I - Overall Impression (OR = 3.4, 95% CI 1.3-9.2).
Safety and adherence
The rates of the most common adverse events did not differ between the micronutrient and placebo groups (Table 3). Prolactin levels were trending higher in the micronutrient group (P = 0.006), rising from a mean of 191 to 222, but still within the normal clinical range of 50-350 mIU/l (females) and 50-550 mIU/l (males). No other group differences were found in the chemistry and haematology safety screens (Table 4), and no individual’s changes in these measures were considered clinically significant.
The overall adherence rate (that is taking all required doses) was 94.6% (s.d. = 6.9) for the micronutrient group and 95.8% (s.d. = 10.1) for the placebo group based on self-report and 96.4% (s.d. = 8.9) for the micronutrient group and 92.1% (s.d. = 18.6) for the placebo group based on pill counts. Nutrient assays showed significant group differences in the changes for vitamin D (P = 0.002), B12 (P<0.001) and folate (P<0.001) levels in those taking the micronutrient formula having higher levels at study end (Table 4). Only B12 levels increased beyond the reference range in the micronutrient group.
Other variables
There were no group differences in alcohol misusers (n = 7 (16.7%) micronutrient group, n = 5 (13.2%) placebo group), cannabis users (n = 6 (14.3%) micronutrient group, n = 3 (7.9%) placebo group), rates of smokers (n = 9 (21.4%) micronutrient group, n = 4 (10.5%) placebo group), diet and participant-assessed therapeutic alliance and expectancies between the two groups.
Discussion
This study is the first double-blind RCT to investigate the efficacy and safety of a broad-based vitamin/mineral formula in the treatment of ADHD in adults. We demonstrated that micronutrient treatment induced statistically robust improvements in several indices, from ADHD symptoms to global assessment of functioning, compared with placebo, with effect sizes ranging from 0.46 to 0.67. Specifically, participants taking the micronutrient formula reported greater improvement in both inattention and hyperactivity/impulsivity compared with those taking a placebo. Improvement in hyperactivity/impulsivity was also noted by the observers. Clinicians did not observe group differences on the ADHD rating scales or the LIFE-RIFT scale, but reported greater global functioning improvements based on the GAF, CGI-I-ADHD and CGI-I - Overall Impression.
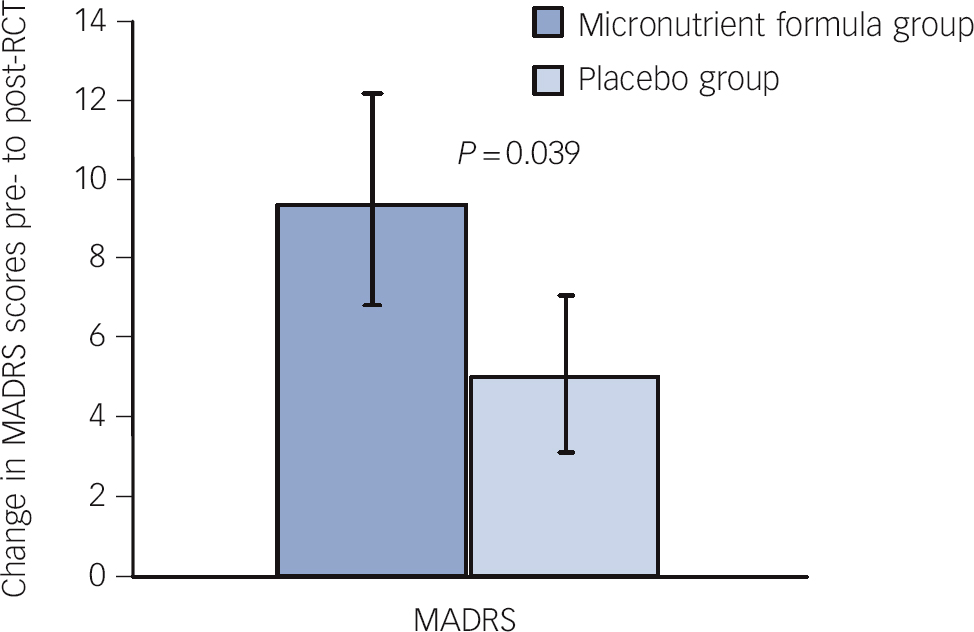
Fig. 4 Change in Montgomery-Åsberg Depression Rating Scale (MADRS) scores pre- to post-randomised controlled trial (RCT) for those who entered the trial moderately depressed across groups.
The varied findings across reporters on attention highlight the difficulties in reliably measuring attention, which is generally more difficult to observe than behavioural changes. Further, elsewhere we have documented that it may take more than 8 weeks for attention scores to drop into the non-clinical range when it might have been more noticeable to others. Reference Rucklidge, Taylor and Whitehead30 Although there was a significant group difference on self-report of attention, the fact that the scores in the micronutrient group remained elevated questions the clinical significance of the findings. In contrast to inattention, based on an average across raters, hyperactivity/impulsivity scores were reduced into the normal non-clinical range with micronutrient administration but not placebo. The lack of a group difference in clinician ratings on hyperactivity/impulsivity was in contrast to self and observer ratings of change; this difference may in part reflect low power to detect a more modest effect size (0.40). Further, clinicians have less data available to them to make ratings given the relative lack of time spent with the individual (an hour every 2 weeks), perhaps resulting in more conservative estimates of change. Although clinicians are often viewed as having the greatest objectivity and therefore their ratings are often perceived as more reliable and valuable than self- and observer reports, it is only the participant and/or observer who are experiencing and observing the symptoms on a daily basis. Further, a recent meta-analysis challenged the view that self-ratings are not as useful as physician ratings in ADHD research, finding that self-ratings were more consistent across studies than observer ratings and therefore, we should not be over-reliant on observer ratings to assess change associated with ADHD treatments. Reference Koesters, Becker, Kilian, Fegert and Weinmann52
Table 3 Treatment-emergent adverse effects reported by at least 5% of participants by treatment group during trial
| n | |||
|---|---|---|---|
| Micronutrient formula group (n = 42) |
Placebo group (n = 38) |
P | |
| Headache | 16 | 15 | 1.00 |
| Dry mouth | 13 | 15 | 0.49 |
| Sleep disruptions | 16 | 8 | 0.14 |
| Gastrointestinal disturbances/diarrhoea | 13 | 9 | 0.62 |
| Nausea | 12 | 8 | 0.61 |
| Constipation | 5 | 8 | 0.37 |
| Agitation | 8 | 5 | 0.55 |
| Sedation | 4 | 7 | 0.33 |
| Anxiety | 5 | 8 | 0.37 |
| Abdominal pain | 3 | 5 | 0.47 |
| Weight gain | 2 | 4 | 0.42 |
| Blurred vision | 2 | 3 | 0.66 |
Table 4 Baseline and post 8-week data on blood resultsFootnote a

| Micronutrient formula group (n = 34) | Placebo group (n = 35) | ||||
|---|---|---|---|---|---|
| Variable | Baseline, mean (s.e.) | Change, mean (s.e.) | Baseline, mean (s.e.) | Change, mean (s.e.) | P |
| Safety markers | |||||
| Prolactin, mIU/l | 190.9 (14.3) | 31.1 (14.2) | 204.8 (20.6) | −27.3 (14.5) | 0.006 |
| Creatinine, μmol/l | 82.6 (1.6) | 0.02 (0.93) | 90.5 (1.5) | 1.87 (0.91) | 0.179 |
| Fasting glucose, mmol/l | 4.99 (0.08) | 0.02 (0.06) | 5.12 (0.07) | 0.05 (0.06) | 0.738 |
| Activated partial thromboplastin time, s | 29.1 (0.5) | −0.1 (0.3) | 29.8 (0.7) | 0.2 (0.3) | 0.466 |
| Platelets, ×10(9)/l | 264.0 (8.0) | 8.76 (4.85) | 237.3 (6.5) | 7.35 (4.78) | 0.840 |
| White blood cells, ×10(9)/l | 6.1 (0.2) | 0.49 (0.20) | 5.5 (0.2) | 0.08 (4.78) | 0.171 |
| Lymphocytes, ×10(9)/l | 2.06 (0.06) | 0.11 (0.07) | 1.78 (0.06) | 0.03 (0.06) | 0.365 |
| Neutrophils, ×10(9)/l | 3.3 (0.1) | 0.30 (0.15) | 3.0 (0.1) | 0.08 (0.15) | 0.302 |
| Gamma-glutamyl transpeptidase, U/l | 30.1 (4.6) | 3.3 (2.7) | 22.9 (1.8) | 1.6 (2.7) | 0.659 |
| Aspartate aminotransferase, U/l | 21.7 (0.8) | 1.4 (1.4) | 21.3 (1.1) | 1.3 (1.3) | 0.955 |
| Alanine aminotransferase, U/l | 25.5 (2.3) | 0.8 (1.4) | 21.8 (1.8) | −0.4 (1.3) | 0.528 |
| Triglyceride, mmol/l | 1.1 (0.1) | 0.1 (0.1) | 1.2 (0.1) | 0.1 (0.1) | 0.530 |
| Cholesterol/high-density lipoprotein cholesterol | 3.9 (0.2) | −0.1 (0.1) | 4.1 (0.2) | −0.2 (0.1) | 0.248 |
| Thyroid stimulating hormone, mIU/l | 1.21 (0.09) | −0.03 (0.08) | 1.42 (0.12) | 0.02 (0.08) | 0.693 |
| Nutrient levels | |||||
| Vitamin D, nmol/l | 62.4 (4.4) | 15.6 (3.1) | 68.5 (3.8) | 0.4 (3.4) | 0.002 |
| Vitamin B12, pmol/l | 353.3 (18.3) | 383.1 (30.2) | 374.9 (22.7) | 1.1 (31.3) | <0.001 |
| Folate, nmol/l | 21.1 (1.5) | 24.3 (2.2) | 22.4 (1.4) | −1.6 (31.3) | <0.001 |
| Magnesium, mmol/l | 0.89 (0.01) | −0.00 (0.01) | 0.92 (0.01) | −0.01 (0.01) | 0.724 |
| Ferritin, μg/l | 116.9 (13.1) | −2.44 (5.57) | 105.6 (11.8) | −6.83 (5.49) | 0.577 |
| Iron, μmol/l | 18.3 (0.9) | −0.4 (1.0) | 19.3 (1.2) | 0.4 (1.0) | 0.568 |
| Calcium, mmol/l | 2.39 (0.02) | 0.03 (0.02) | 2.39 (0.02) | 0.01 (0.02) | 0.286 |
| Zinc, μmol/l | 12.1 (0.2) | 0.4 (0.3) | 12.5 (0.2) | 0.1 (0.3) | 0.423 |
| Copper, μmol/l | 15.4 (0.6) | 0.4 (0.4) | 13.5 (0.4) | −0.4 (0.4) | 0.171 |
a. Results in bold are significant.
The improvements in global measures of functioning suggest that, whereas ADHD symptoms persist to some degree, micronutrient treatment appears to benefit a variety of areas of psychological functioning. This result may seem surprising, but is consistent with the hypothesised mechanisms of action Reference Ames, Elson-Schwab and Silver20,Reference Kaplan, Crawford, Field and Simpson21,Reference Rucklidge and Kaplan35 as well as international studies showing the benefit of the micronutrient formula in the treatment of a wide range of mental disorders. Reference Kaplan, Fisher, Crawford, Field and Kolb29,Reference Popper53-Reference Rucklidge, Andridge, Gorman, Blampied, Gordon and Boggis57 Further, in this study, micronutrient treatment was found to be superior to placebo in ADHD adults with a high rate of comorbid disorders (56%), a population that has been documented to have lower rates of response to treatment than adults with only ADHD. Reference Torgersen, Gjervan and Rasmussen5
We also note that an equal number of participants in both groups thought they were receiving placebo, so the observed changes were unlikely to have been driven by expectancy effects. Indeed, the relative absence of side-effects may have played a role in these perceptions. As a result of the relatively slow change observed with micronutrients compared with standard medications used to treat ADHD (i.e. stimulants), it is also possible that although change was occurring, participants were not aware of the change and hence thought they were on the placebo. However, we also observed that some participants who reported great improvements in their functioning still thought they had taken the placebo, stating that vitamins and minerals on their own could not achieve such large effects. Further, guessing at group allocation may confound ‘true efficacy’, Reference Perlis, Ostacher, Fava, Nierenberg, Sachs and Rosenbaum58 in that individuals who think they are getting a placebo tend to show lowered response rates.
A trend towards improvement in MADRS depression scores was noted with micronutrient treatment (P = 0.078, ES = 0.41); however, the baseline level of depression in the overall sample was relatively low (mean 15.8). Post hoc analyses revealed a benefit of micronutrients for adults with moderate to severe depression, a finding consistent with other RCTs that show benefit of micronutrients in improving mood. Reference Harris, Kirk, Rowsell, Vitetta, Sali and Scholey59,Reference Gosney, Hammond, Shenkin and Allsup60
The Canterbury earthquakes, which directly affected many participants in this study, may have dampened response rates and affected life satisfaction, as these major earthquakes had a wide impact on wellbeing in the community, Reference Ardagh, Richardson, Robinson, Than, Gee and Henderson61 as well as cognitive functions including attention. Reference Helton and Head62 Nevertheless, our drop-out rate was low at 7.5% (n = 6) and adherence was satisfactory (95%).
Many are inclined to ask which are the psychologically active ingredients in a complex formula. This multi-ingredient approach challenges conventional understanding in that medical treatments tend to manipulate one variable (medication) at a time; however, a single-ingredient strategy for nutritional treatments is at odds with human physiology as optimal functioning requires the presence of all nutrients in balance rather than one nutrient provided in high doses. Reference Mertz63 Indeed, single-nutrient studies have yielded only modest findings, Reference Rucklidge, Johnstone and Kaplan16 whereas broader interventions may be more promising. Reference Kaplan, Fisher, Crawford, Field and Kolb29-Reference Harding, Judah and Gant33 The one-disease, one-nutrient solution to illness is likely outdated, and may need to be replaced by a model that is responsive to the broad spectrum of human nutritional needs. Reference Rucklidge, Johnstone and Kaplan64 The formula used in this study had all the vitamins (except vitamin K) and 16 minerals. A consideration of some of the ingredients and the role they play in brain metabolism highlights the importance of the broad array of nutrients and may help explain the non-specific effects the nutrients appear to have on psychiatric symptoms. For example, pyridoxal 5′-phosphate (vitamin B6) acts as a cofactor for the synthesis of gamma-amino-butyric acid, serotonin and dopamine; 5-methyltetrahydrofolate (vitamin B9) regenerates tetrahydrobiopterin, which is essential for neurotransmitter formation; iron functions in the enzyme system involved in the production of serotonin, noradrenaline, adrenaline and dopamine, and is a cofactor in the metabolism of tyrosine to dopamine; and niacinamide (vitamin B3) shunts tryptophan to serotonin. Reference Kaplan, Crawford, Field and Simpson21,Reference Head and Kelly65
There were no group differences on any adverse events. We found no changes in creatinine, fasting sugar, haematological indices, liver functions, lipid profile, thryoid-stimulating hormone, ferritin, iron, magnesium, calcium, zinc or copper. These results are consistent with a review of over 140 patients treated with this micronutrient formula, which did not identify any significant adverse effects or safety concerns. Reference Simpson, Crawford, Goldstein, Field, Burgess and Kaplan34 We are unsure whether the treatment caused sarcoidosis in one participant and therefore this potential adverse effect needs to be monitored in future research.
A statistically significant increase in prolactin with micronutrient treatment was found in this study, but it was small and unlikely to be clinically significant. No prolactin-related adverse effects have been previously reported in the clinical trials on broad-spectrum micronutrient treatment. Reference Simpson, Crawford, Goldstein, Field, Burgess and Kaplan34 Increased prolactin might be caused by dopamine receptor blockade in the tubero-infundibular pathway, Reference Maguire66 consistent with research on zinc and B vitamins, suggesting that micronutrients can affect the dopamine inhibitory system, Reference Shaw, Rucklidge and Hughes67,Reference Oner, Oner, Bozkurt, Odabas, Keser and Karadag68 which influences prolactin levels. Nevertheless, given the raised prolactin, future studies should assess blood changes over a longer period of time. Also, interactions with medications would need to be carefully considered when using micronutrients given some concerns raised about drug interactions. Reference Popper53 This sample was largely unmedicated (with no participants taking psychotropic medications during the trial) and therefore these results may not be applicable to a medicated population.
Blood nutrient levels of vitamins D, B12 and folic acid increased more in the micronutrient group but only B12 levels rose beyond reference levels, and no adverse effects are associated with high B12 intake. 69 Increased levels of these and other key vitamins might contribute to the positive effects seen with micronutrient administration, given their role in the regulation of homocysteine metabolism, Reference Huskisson, Maggini and Ruf70 mood Reference Wilkins, Sheline, Roe, Birge and Morris71,Reference Taylor, Carney, Goodwin and Geddes72 and neurotransmitter synthesis. Reference Bottiglieri, Laundy, Crellin, Toone, Carney and Reynolds73 These levels also provide further evidence of good adherence in the active group.
Limitations and future directions
Our trial relied predominantly on clinical interviews and self-reports, since we were initially concerned with determining the potential benefit of micronutrients for ADHD. Tools used in future research might usefully include neurocognitive measures, functional magnetic resonance imaging, as well as metabolomic methods to provide detailed metabolic information at the cellular level. Generalisability of the results is limited by geographical sampling and the need for individuals who were willing to participate in an RCT and be adherent with the consumption of a large number of pills. These factors may explain the higher than expected IQ of the sample. Generalisability to individuals with uncomplicated ADHD (free of other Axis I disorders) is also limited by the high rate of comorbidity. Studying a ‘cleaner’ group (that is, without comorbidity) might reveal specific effects on individuals with ADHD; however, such a trial would have limited generalisability to the majority of clinically referred adults with ADHD where comorbidity is the rule rather than the exception. Reference Sobanski, Bruggemann, Alm, Kern, Deschner and Schubert74 Long-term v. acute exposure to micronutrients also needs to be investigated as longer exposure appears to be associated with greater benefit, especially for inattention. Reference Rucklidge, Taylor and Whitehead30 Larger trials could determine whether the trends noted on some measures can be confirmed.
The consumption of large numbers of pills was tedious for some participants and likely the reason some people stopped taking them at the end of the trial and this may make the treatment less amenable to some people. It is expected that if further studies replicate these results, manufacturing techniques (that target improving the absorption of the minerals) may be developed to reduce the number of pills. It is also worth researching whether a similar benefit can be achieved through consuming fewer pills with simultaneous changes in diet and lifestyle.
We purposefully chose three primary outcomes to cover the range of ADHD symptoms, to include multiple raters, and to investigate more globally the impact of nutrients on mental health. By separating out inattention from hyperactivity/impulsivity and providing T-scores, we hope to assist the reader in interpreting where clinically significant change may be occurring. Most studies of pharmacological and psychological interventions for ADHD in adults employ self-report Reference Amiri, Farhang, Ghoreishizadeh, Malek and Mohammadzadeh75 and/or clinician assessment, Reference Spencer, Biederman, Wilens, Faraone, Prince and Gerard76,Reference Emilsson, Gudjonsson, Sigurdsson, Baldursson, Einarsson and Olafsdottir77 so it is a strength of the current study that data were also provided by non-clinician observers (somewhat comparable to the use of teacher ratings in child studies). Using multiple measures increases the risk of type I errors, but most of the primary measures were found to favour the active intervention over placebo, so it is unlikely that our findings are a consequence of type I errors.
The findings reported here need to be interpreted cautiously given the inconsistencies noted across raters; larger trials are required to determine how robust these preliminary findings are. Despite the modest changes, nutrients may turn out to be a viable alternative to other treatments for some individuals. A proportion of individuals taking the micronutrients in the trial obtained scores on ADHD ratings after 8 weeks that were in the normal non-clinical range, suggesting that it may be an effective treatment for some, particularly those who do not tolerate or choose not to take medications. Although most studies using alternative treatments for ADHD have been done on children, the effect sizes reported here are comparable if not better than other non-pharmacological treatments for ADHD, including omega-3s (ES = 0.16) Reference Sonuga-Barke, Brandeis, Cortese, Daley, Ferrin and Holtmann78 and food restriction diets (ES = 0.51). Reference Sonuga-Barke, Brandeis, Cortese, Daley, Ferrin and Holtmann78
There is often scepticism associated with using vitamins and minerals for the treatment of psychiatric symptoms, despite a long history of their use. Reference Kaplan, Crawford, Field and Simpson21 The field is plagued with poorly designed and controlled studies, often leading to erroneous conclusions. However, with a growing number of well-controlled studies supporting their use across a wide variety of psychiatric symptoms, Reference Kennedy, Veasey, Watson, Dodd, Jones and Maggini18,Reference Gesch, Hammond, Hampson, Eves and Crowder79 perceptions are changing and some are publicly calling for investigations of dietary treatments for ADHD. Reference Nigg7
Although the results of nutrient treatments in short-term trials for ADHD may be more modest compared with medication trials, there are many reasons for urging further research on this topic: (a) there is a growing body of literature documenting the disappointing long-term outcomes of medications Reference Molina, Hinshaw, Swanson, Arnold, Vitiello and Jensen3,Reference Whitaker80-Reference Advokat83 as a primary treatment for some mental disorders; (b) there are concerns being voiced from psychiatry Reference Kleinman84 about the outcomes of some pharmaceutical treatments; and (c) medication side-effects can be problematic for some patients. The current study, alongside others, should provide a stimulus for further trials on nutrient treatment for a variety of psychiatric symptoms.
Funding
Funding and thanks to the Vic Davis Memorial Trust (E5672), Marie Lockie for her private donation, the Department of Psychology, University of Canterbury for ongoing research support, and three summer studentships awarded by the University of Canterbury.
Acknowledgements
Thanks to Andrew Gormley for programming assistance; David Pugh-Williams for assistance with randomisation; Jeni Johnstone, Nic Ward, Rachel Harrison, Heather Gordon, Ellen Sole, Sarah Anticich, Sarah Dymond and Petra Hoggarth for assistance with data collection and entry; the CDHB, Pegasus Health and other private referrers and all the families who participated. We thank Truehope for providing the micronutrient formula and matching placebo. The 36-ingredient formula has been modified slightly on several occasions, with each change resulting in a new name. Sold variously as EMPower, EMPowerplus and Daily Essential Nutrients, manufacturer information can be found at www.truehope.com and www.hardynutritionals.com.


eLetters
No eLetters have been published for this article.