


Many thanks to Jauhar and colleagues for their interesting and thought-provoking review of cognitive–behavioural therapy (CBT) for schizophrenia, Reference Jauhar, McKenna, Radua, Fung, Salvador and Laws1 and especially for making their data publicly available. Previous discussants (Byrne, Reference Byrne2 McKenna et al Reference McKenna, Radua, Jauhar and Laws3 ) have commented on the lack of consideration given to ‘dose’ (i.e. number of sessions) of CBT. The relation between dose and effect is almost a classic in psychotherapy research. Reference Howard, Kopta, Krause and Orlinsky4 It has more recently been shown to be of importance in reviews of other psychosocial therapies (e.g. Gold et al Reference Gold, Solli, Krüger and Lie5 ). Together with the obvious plausibility of such a relationship, this seems to be enough reason to examine the dose–effect relation carefully. I used the effect sizes calculated by Jauhar et al and extracted the number of sessions from the original papers (I was able to do this for 32 of the 52 studies). I then ran a meta-regression (functions metagen and metareg from R package meta) for each of the four outcomes (Fig. 1). Most studies used between 10 and 20 sessions, with a few outliers in both directions. The regression lines show little support for an increase of effect with dose. On the contrary, there are tendencies in the opposite direction for all outcomes. The paradoxical observation is that effects seem to be strongest when few sessions were provided (significant for positive symptoms, P = 0.0005).
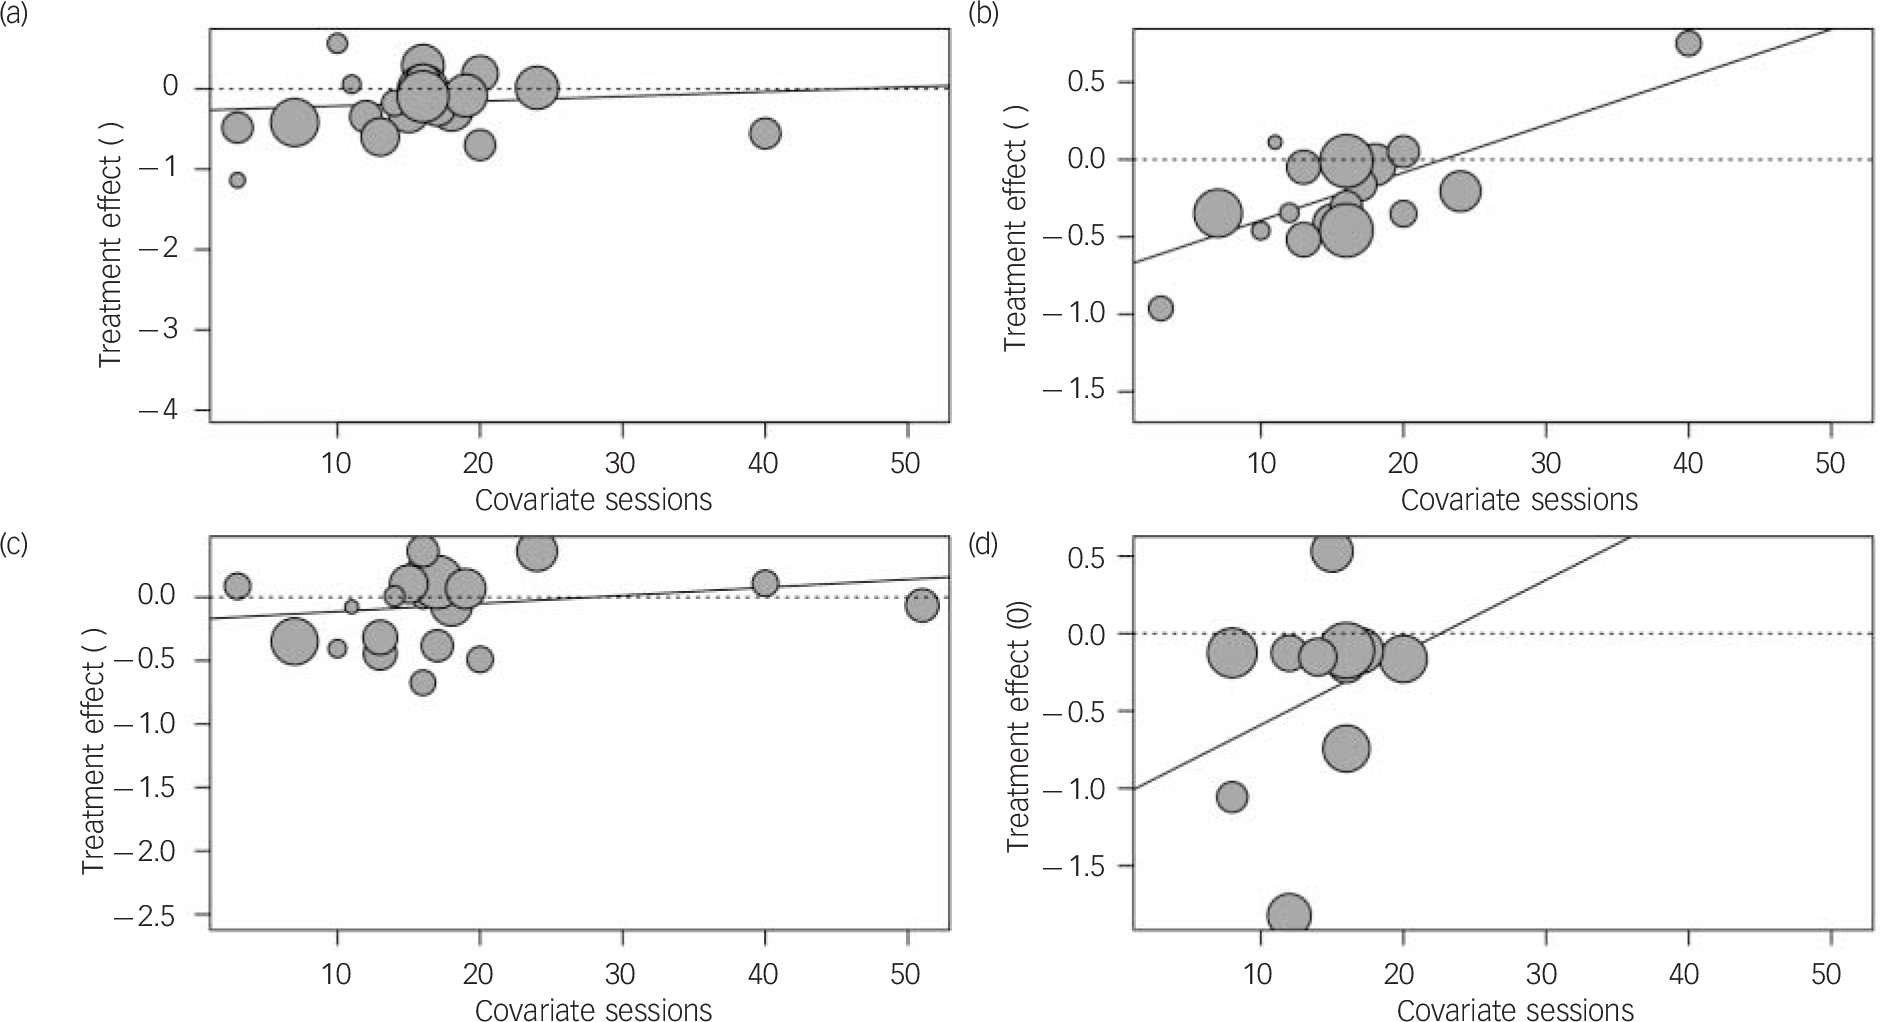
Fig. 1 Meta-regression for (a) total symptoms, (b) positive symptoms, (c) negative symptoms and (d) hallucinations.
Obviously this analysis has a number of limitations.
-
(a) As McKenna et al Reference McKenna, Radua, Jauhar and Laws3 noted in their response to the comment by Byrne, Reference Byrne2 participants were not randomised to different doses.
-
(b) Dose is likely confounded with duration Reference Gold6 and may also be confounded with masking and control interventions. Reference Jauhar, McKenna, Radua, Fung, Salvador and Laws1
-
(c) There may be differences between the scheduled and the received dose, and this was not reported consistently in the original papers.
-
(d) Dose data were not independently extracted by two people.
However, I think one can conclude from these analyses that dose is unlikely to have masked a clearer effect in these data. A more detailed re-analysis of this data-set may be warranted. In general, the dosage of psychotherapy should be considered carefully in future studies.


eLetters
No eLetters have been published for this article.