


Ethnic density is increasingly recognised as an important correlate of mental health in the UK. Black and minority ethnic (BME) individuals living in areas with high levels of own and overall BME concentration, irrespective of the level of deprivation, exhibit better mental health outcomes. Reference Faris and Dunham1–Reference Halpern and Nazroo3 Understanding how this phenomenon exerts positive or protective effects on mental health may be the key to alleviating some of the prevalence differences found among ethnic groups. For example, research has shown how belonging to a BME group, especially from an Asian population, or being born in a non-English-speaking country, are significant risk factors for developing postnatal depression (PND) in London. Reference Onozawa, Kumar, Adams, Doré and Glover4 Specifically, when compared with White British and White Irish populations, the prevalence of PND is significantly higher among Indian, Pakistani and Black Caribbean populations. Reference Jayaweera and Quigley5 Ethnic differences have also been demonstrated in personality disorder, with higher prevalence rates among Black and other ethnic minority groups. Reference Crawford, Rushwaya, Bajaj, Tyrer and Yang6 With the UK becoming more ethnically diverse, understanding the precise mechanisms leading to these differences, and what can be done to alleviate them, has therefore become increasingly important.
To date, no study has examined the effect of ethnic density on personality disorder, and only one study has examined the effect of ethnic density in women with PND, finding no significant association between ethnic density and PND in BME women. Reference Pickett, Shaw, Atkin, Kiernan and Wilkinson7 However, this study did not include a White sample, and a single question was used to screen women with PND, both of which may represent limitations. Therefore, there is a need to explore the ethnic density effect in personality disorder and PND.
Both PND and personality disorder are relatively common conditions: personality disorder is estimated to have a weighted prevalence of 4%, Reference Coid, Tyrer, Roberts and Ullrich8 whereas clinically diagnosed depression, from birth to 2 months postpartum, has a period prevalence of 6%. Reference Gavin, Gaynes, Lohr, Meltzer-Brody, Gartlehner and Swinson9 Moreover, PND and personality disorder frequently co-occur, Reference Hirschfeld10,Reference Mulder11 further reinforcing the importance of determining whether an ethnic density effect exists for either disorder.
With all this in mind, we aimed to clarify the relationship between ethnic density and PND, and sought to determine whether an ethnic density effect operates for personality dysfunction, representative of subclinical personality disorder, in order to extend the frontiers of this area of research. Specifically, we aimed to (a) test whether the ethnic density effect is group-specific (i.e. own ethnic density) or simply the result of living among other ethnic populations (i.e. overall ethnic density); (b) examine whether ethnic density correlates linearly with the severity of each disorder; and (c) determine the diagnostic specificity of this putative effect, by investigating the effect on both PND and personality dysfunction, and specifically whether this effect would differ according to whether the diagnosis was short term, as in the case of PND, or long term, with respect to personality dysfunction.
Method
Sampling and participants
Analyses for this study were conducted using data collected as part of the Early Infant Care Study (EICS), which was approved by the relevant local research ethics committees. As described extensively before, Reference Conroy, Marks, Schacht, Davies and Moran12 the EICS recruited newly delivered women between 2004 and 2006, from the postnatal wards at King's College Hospital, a large teaching hospital in London primarily serving the boroughs of Lambeth, Southwark and Lewisham, whose populations are sociodemographically and ethnically mixed, and with high levels of psychiatric morbidity. Women were excluded if they had: poor English fluency; had had a multiple birth, a gestation length less than 36 weeks; a baby with a birth weight below 2000 g; or if they had experienced any immediate postnatal complications. Of the 3142 eligible women approached, 2644 (84%) agreed to participate, and a sociodemographic schedule enquiring about maternal age, marital status, ethnicity and several infant and delivery features were administered at recruitment. Of those recruited, 2262 (86%) were screened for both PND and personality dysfunction, at 6 weeks postpartum.
The 9-item depression module from the Patient Health Questionnaire (PHQ-9) Reference Kroenke, Spitzer and Williams13 is an open-access diagnostic instrument for depression used in different healthcare and community settings, including the general population. Reference Arroll, Goodyear-Smith, Crengle, Gunn, Kerse and Fishman14,Reference Kocalevent, Hinz and Brähler15 It can be used to monitor the severity of depression and response to treatment Reference Kroenke, Spitzer and Williams13 and has been validated in BME groups. Reference Huang, Chung, Kroenke, Delucchi and Spitzer16 The PHQ-9 has also been commonly used to screen for depression, with a sensitivity and specificity of 88% for major depression. Reference Kroenke, Spitzer and Williams13 In this study, the PHQ-9 was used to screen for PND, which was considered to be present if the total PHQ-9 score was ≥12, which has better diagnostic properties than a cut-off score of 10. Reference Kendrick, Dowrick, McBride, Howe, Clarke and Maisey17,Reference Manea, Gilbody and McMillan18
The Standardised Assessment of Personality – Abbreviated Scale (SAPAS) Reference Moran, Leese, Lee, Walters, Thornicroft and Mann19 is a brief interview-based screening instrument for personality dysfunction, Reference Gorwood, Rouillon, Even, Falissard, Corruble and Moran20,Reference Fok, Hotopf, Stewart, Hatch, Hayes and Moran21 consisting of eight dichotomously rated items. In this study, as in line with previous research, Reference Fok, Hotopf, Stewart, Hatch, Hayes and Moran21 a cut-off score of four was used to identify women with personality dysfunction. A cut-off of four has a slightly better positive predictive value when the prevalence in the population is assumed to be low, an assumption that befits our community sample. The SAPAS has also been used in studies with ethnically diverse samples Reference Crawford, Rushwaya, Bajaj, Tyrer and Yang6,Reference Fok, Hotopf, Stewart, Hatch, Hayes and Moran21,Reference Crawford, Price, Gordon, Josson, Taylor and Bateman22 and has a sensitivity of 82% and specificity of 89% when a cut-off score of four or more is used. Reference Moran, Leese, Lee, Walters, Thornicroft and Mann19
Individual-level measures
Ethnicity for all women was defined according to self-report criteria as used in the UK census. 23 Since there were too few respondents from each of the official 16 categories used in the UK census to allow detection of any significant associations in some analyses (not shown), ethnicity was categorised into two main groups, ‘White’ and ‘BME’. Therefore, findings based on these two categories only are presented here. White constitutes all White British, White Irish and White Other women, and BME encompasses the remaining 13 ethnic categories.
Three other maternal features were examined: maternal age, relationship status and parity. Relationship status was classified as cohabiting/married, non-cohabiting/non-marital or single, whereas parity was defined as either primiparous or multiparous. Five infant and delivery features were also examined: mode of delivery (vaginal, elective Caesarean or emergency Caesarean), infant gender, gestational length, birth weight and whether the infant was admitted to the neonatal unit.
Area-level measures
Under the terms of the Open Government Licence and UK Government Licensing Framework, the participants' postcode data-set was linked to the 2001 UK census 24 in order to obtain data on ethnic density. Each postcode was matched to its respective lower super output area (LSOA) using an online geography matching and conversion tool called GeoConvert (Mimas UDS. GeoConvert, UK Data Service, Essex, UK; see http://geoconvert.mimas.ac.uk/). LSOAs are used to define area boundaries, and are the lowest level of disaggregation, representing the smallest geographical areas within the UK, and comprising between 400 and 1000 households. 25
Own ethnic density refers to the proportion of individuals from the respondent's ethnic group in a defined area, divided by the total population in that area. Essentially, it is the concentration of co-ethnics in a defined area. It was calculated as the number of residents in an ethnic group in each LSOA, divided by the total LSOA population. Overall ethnic density refers to the proportion of all BME individuals in an area, divided by the total population in that area. Unlike own ethnic density, it refers to the concentration of all individuals from any BME background in a defined area. In accordance with previously published research, overall ethnic density was calculated as the number of all BME groups, excluding White minority ethnic groups, in each LSOA, divided by the total LSOA population. Reference Shaw, Atkin, Bécares, Albor, Stafford and Kiernan26
The Index of Multiple Deprivation (IMD) Reference Noble, Wright, Smith and Dibben27 from 2004 was used to measure area-level deprivation and matched to LSOA. IMD represents a multiple deprivation score based on seven individual domains: income, health deprivation and disability, employment disadvantage, education, skills and training, poor access to housing and services, poor indoor and outdoor living environment, and crime levels. Reference Noble, Wright, Smith and Dibben27 The lower the IMD score, the less deprived the area. IMD was analysed as a continuous score in all analyses.
Statistical analysis
Analyses were performed using SPSS version 21 for Windows. Characteristics of the sample were compared using chi-squared tests for categorical variables and independent samples t-tests for continuous variables. Area-level deprivation, maternal age, ethnicity, parity, marital status and infant/delivery features were analysed as a priori confounders, using regression analysis. Associations between own and overall ethnic density and mental health outcomes were initially analysed using Mann–Whitney U-tests. To determine whether own and overall ethnic density were independently associated with PND and personality dysfunction, regression analyses were conducted. To allow the modelling of variance at individual- and area-level, and to account for geographical clustering, multilevel regression analyses were performed, using the PHQ-9 and SAPAS as continuous variables. LSOA was specified as the grouping variable, with individuals nested within these areas. Two level multilevel models with random intercepts and fixed effects for each predictor were specified, and the ethnic density variables were transformed using a square root transformation to meet all required assumptions of the linear model. Logistic regression, using robust standard errors to account for any non-independence caused by geographical clustering, were used to model the effects of ethnic density on screening positive for PND and for personality dysfunction. Separate parsimonious models were conducted for each ethnic group and for each mental health outcome.
Results
Participant characteristics
The demographic features for the interviewed sample (n = 2262) are shown in Table 1. Compared with White women, mothers from the BME group were more likely to be single (χ2 (2) = 184.4, P<0.001), under the age of 25 years (χ2 (1) = 50.07, P<0.001), to be multiparous (χ2 (1) = 26.42, P<0.001), have an emergency Caesarean (χ2 (2) = 6.89, P = 0.032), have a baby with a lower birth weight (t (2,256) = 7.65, P<0.001), have a shorter gestational length (t (2,258) = 4.41, P<0.001) and live in a more deprived area (t (2,187) = −14.79, P<0.001).
Table 1 Demographic features of participants by ethnic group

| Unweighted n | |||
|---|---|---|---|
| Sociodemographic features | Total (n = 2262) |
White
a
(n = 1040) |
Black and minority ethnic
b
(n = 1222) |
| Maternal features | |||
| Mother's age, n (%) | |||
| Under 25 years | 316 (20) | 90 (12) | 226 (27)*** |
| Mean (s.d.) | 30.5 (6.3) | 32 (5.7) | 29.2 (6.4)*** |
| Relationship status, n (%) | |||
| Single | 271 (12) | 51 (5) | 220 (18)*** |
| Non-marital/non-cohabiting | 244 (11) | 51 (5) | 193 (16) |
| Married/cohabiting | 1746 (77) | 938 (90) | 808 (66) |
| Parity, n (%) | |||
| Primiparous | 1308 (58) | 661 (64) | 647 (53) |
| Multiparous | 954 (42) | 379 (36) | 575 (47)*** |
| Infant and delivery features | |||
| Male baby, n (%) | 1209 (53) | 555 (53) | 654 (54) |
| Baby admitted to SCBU, n (%) | 201 (9) | 97 (9) | 104 (9) |
| Mode of delivery, n (%) | |||
| Vaginal | 1493 (66) | 702 (68) | 791 (65) |
| Elective Caesarean | 217 (10) | 109 (10) | 108 (9) |
| Emergency Caesarean | 482 (21) | 198 (19) | 284 (23)*** |
| Gestational age, weeks: mean (s.d.) | 39.8 (1.5) | 39.9 (1.5) | 39.7 (1.4)*** |
| Birth weight, g: mean (s.d.) | 3374.4 (519.6) | 3463.9 (503.3) | 3298.3 (521.1)*** |
| Neighbourhood features | |||
| Deprivation (IMD) score, mean (s.d.) | 34 (11.1) | 30.4 (10.7) | 37.1 (10.5)*** |
SCBU, special care baby unit; IMD, Index of Multiple Deprivation.
a. White British, White Irish and White Other.
b. All ethnic groups except the three White groups.
*** P<0.001 v. White women.
Prevalence of PND and personality dysfunction
The ethnic breakdown and associated prevalence rates for PND and personality dysfunction for all 16 ethnic groups are shown in online Table DS1. For the sample as a whole, the weighted prevalence of screening positive for PND only was 2.3%, for personality dysfunction only it was 12%, and for comorbid diagnosis (both PND and personality dysfunction) it was 2.7%. Compared with BME women, White mothers had significantly lower prevalence rates for PND (1.3% v. 4.9%; χ2 (1) = 5.70, P = 0.017), for personality dysfunction (6.7% v. 25.7%; χ2 (1) = 9.25, P = 0.002), and for comorbid diagnosis (1.2% v. 6.7%; χ2 (1) = 6.58, P = 0.01).
Sociodemographic factors associated with PND and personality dysfunction
Women were significantly more likely to meet screening criteria for PND if they screened positive for personality dysfunction (χ2 (1) = 150.63, P<0.001), were under 25 years of age (χ2 (1) = 5.134, P = 0.023), were multiparous (χ2 (1) = 5.72, P = 0.017), were single (χ2 (1) = 5.75, P= 0.016) and were from the BME group (χ2 (1) = 5.97, P = 0.017). With respect to personality dysfunction, women were significantly more likely to screen positive if they met screening criteria for PND (χ2 (1) = 150.63, P<0.001), were in a non-cohabiting/non-marital relationship (χ2 (1) = 14.11, P<0.001), were from the BME group (χ2 (1) = 9.25, P = 0.002) and lived in a more deprived area (t (2,187) = −2.54, P = 0.011) compared with women who were healthy. All aforementioned sociodemographic factors were controlled for in all subsequent analyses in relation to PND and personality dysfunction.
Association between ethnic density, area-level deprivation and ethnicity
In total there were 90 analysed LSOAs within our sample. White women in the sample had significantly higher median own ethnic density scores compared with BME mothers (z = −26.62, P<0.001). The reverse association was seen between overall ethnic density and ethnicity, whereby White women had significantly lower median overall ethnic density scores compared with BME women (z = −16.28, P<0.001).
Decreasing White population own ethnic density was significantly associated with increasing deprivation (Spearman's r = −0.50, n = 1007, P<0.001), whereas the opposite was observed for decreasing BME population ethnic density (r = 0.48, n = 1165, P<0.001). Decreasing overall ethnic density was significantly associated with decreasing area-level deprivation in both White and BME populations (Spearman's r = 0.82, n = 1007, P<0.001; r = 0.71, n = 1165, P<0.001, respectively).
Association between ethnic density and PND or personality dysfunction
Table 2 shows the median own ethnic density concentrations for women screening positive for PND and personality dysfunction compared with women who were healthy. Women who screened positive for PND were more likely to live in areas of lower own ethnic density (z = −3.81, P<0.001); the same effect was present for personality dysfunction (z = −3.20, P<0.001). However, when women were divided by ethnic groups, only White women who screened positive for PND were more likely to live in areas of lower own ethnic density (z = −3.18, P = 0.001), and again the same effect was present for personality dysfunction (z = −2.42, P = 0.016); these effects were not present in BME women.
Table 2 Median scores of own and overall ethnic density for White and Black and minority ethnic women screening positive for postnatal depression and for personality dysfunction, compared with healthy women

| Postnatal depression | Personality dysfunction | |||
|---|---|---|---|---|
| Healthy women | Women screening positive | Healthy women | Women screening positive | |
| Total sample | ||||
| Median % ethnic density (interquartile range) | ||||
| Own | 17.1 (7.1–52.2) (n = 2067) | 10.5 (4.3–23.7)*** (n = 105) | 17.1 (7.2–52.8) (n = 1866) | 13.7 (6.4–39.6)*** (n = 306) |
| Overall | 36.6 (28.9–47.6) (n = 2067) | 36.4 (28.4–46.8) (n = 105) | 36.3 (28.9–47.0) (n = 1866) | 39.0 (28.9–49.2) (n = 306) |
| White women | ||||
| Median % ethnic density (interquartile range) | ||||
| Own | 53.2 (13.8–61.9) (n = 970) | 15.8 (7.7–55.1)** (n = 37) | 53.5 (12.1–61.9) (n = 890) | 45.2 (9.8–59.0)* (n = 117) |
| Overall | 31.3 (24.8–40.1) (n = 970) | 31.8 (26.2–43.6) (n = 37) | 31.3 (24.8–39.7) (n = 890) | 31.9 (24.8–44.4) (n = 117) |
| BME women | ||||
| Median % ethnic density (interquartile range) | ||||
| Own | 11.3 (2.8–17.8) (n = 1097) | 10.0 (2.5–16.4) (n = 68) | 11.3 (2.9–17.8) (n = 976) | 11.0 (2.5–17.1) (n = 189) |
| Overall | 42.0 (32.1–52.8) (n = 1097) | 39.7 (30.7–50.0) (n = 68) | 41.6 (32.0–52.8) (n = 976) | 41.4 (31.3–52.3) (n = 189) |
BME, Black and minority ethnic.
* P<0.05,
** P<0.01,
*** P<0.001 v. healthy women.
No statistically significant association was found between screening positive for PND or for personality dysfunction and overall ethnic density, for the sample as a whole, or specifically within the White and BME groups.
Own ethnic density as a predictor for positive screening of PND in the multilevel regression model
In the analyses described above, we have shown that lower own ethnic density was associated with an increased prevalence of PND and personality dysfunction, but only in White women. Moreover, we have shown that lower own ethnic density in White women was associated with increasing area-level deprivation; and that a younger age, being single, screening positive for personality dysfunction, being multiparous and belonging to the BME group were significantly associated with positive screening of PND. Being in a non-cohabiting/non-marital relationship, screening positive for PND, belonging to the BME group and living in areas with higher deprivation were significantly associated with personality dysfunction. To explore the different factors contributing to the association between own ethnic density and PND/personality dysfunction in White women, we conducted multilevel regression modelling.
Table 3 shows the multilevel regression results for the association between own ethnic density and PHQ-9 scores for White women. Living in areas of lower own ethnic density was significantly and independently associated with higher PHQ-9 scores, after adjusting for area-level deprivation, relationship status, maternal age, screening positive for personality dysfunction, parity and geographical clustering (Model 3). Figure 1 demonstrates that an increase in own ethnic density was associated with a decrease in the predicted probabilities of reporting depressive symptomology. Consistent with these findings, for White women, living in areas with higher own ethnic density was significantly and independently protective against screening positive for PND (odds ratio (OR) 0.98 (95% CI 0.96–0.99); P = 0.002).
Table 3 Multilevel regression results of the association between own ethnic density and PHQ-9 scores for White women

| Own ethnic density | Model 1
a
Estimate (95% confidence intervals); s.e.; P |
Model 2
b
Estimate (95% confidence intervals); s.e.; P |
Model 3
c
Estimate (95% confidence intervals); s.e.; P |
|---|---|---|---|
| Postnatal depression | −0.16 (−0.26 to 0.06); 0.05; 0.002 | −0.13 (−0.24 to 0.02); 0.05; 0.018 | −0.15 (−0.27 to 0.03); 0.06; 0.015 |
PHQ-9, Patient Health Questionnaire-9.
a. Unadjusted model.
b. Partially adjusted model: adjusted for area-level deprivation.
c. Fully adjusted model : adjusted as for Model 2 plus parity, relationship status, positive screen for personality dysfunction and maternal age.
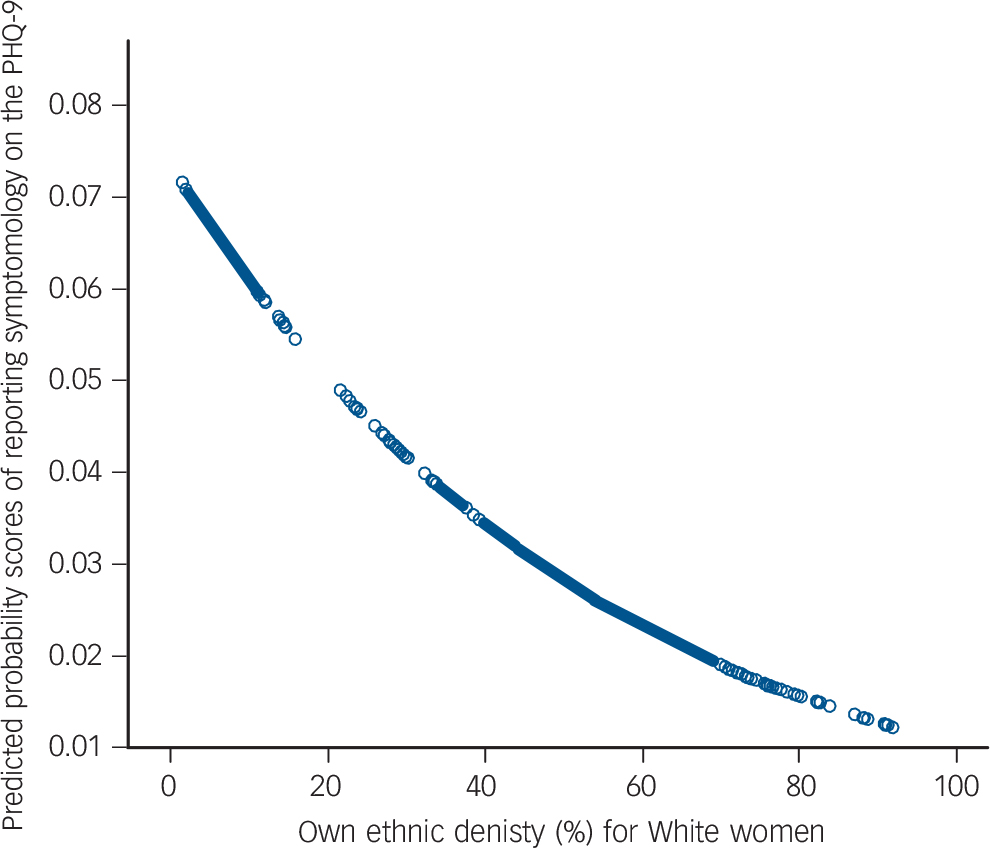
Fig. 1 Predicted probabilities for the association between own ethnic density and expected Patient Health Questionnaire-9 (PHQ-9) scores in the White group.
Model adjusts for maternal age, positive screen for personality dysfunction, deprivation, relationship status and parity, and takes into account area-level clustering.
With regard to personality dysfunction, Table 4 shows the multilevel regression results of the association between own ethnic density and SAPAS scores for White women. Living in areas of lower own ethnic density was significantly and independently associated with higher SAPAS scores, after adjusting for area-level deprivation and geographical clustering (Model 2). However, the association was no longer significant when taking into account relationship status and screening positive for PND (Model 3). On further analysis, screening positive for PND was found to be confounding this association; and robust logistic regression results confirmed no significant association between own ethnic density and screening positive for personality dysfunction for White women within the sample, once the effect of PND was taken into account (OR = 0.99 (95% CI 0.90–1.0); P = 0.134).
Table 4 Multilevel regression results of the association between own ethnic density and SAPAS scores for White women

| Own ethnic density | Model 1
a
Estimate (95% confidence intervals); s.e.; P |
Model 2
b
Estimate (95% confidence intervals); s.e.; P |
Model 3
c
Estimate (95% confidence intervals); s.e.; P |
|---|---|---|---|
| Personality dysfunction | −0.06 (−0.10 to −0.02); 0.02; 0.002 | −0.05 (−0.08 to −0.01); 0.02; 0.024 | −0.03 (−0.07 to 0.01); 0.02; 0.120 |
SAPAS, Standardised Assessment of Personality – Abbreviated Scale.
a. Unadjusted model.
b. Partially adjusted model: adjusted for area-level deprivation.
c. Fully adjusted model : adjusted as for Model 2 plus relationship status and positive screen for postnatal depression.
Discussion
Main findings
We have examined the effects of ethnic density at the level of LSOA, i.e. the smallest geographical area within the UK, comprising between 400 and 1000 households. Higher own ethnic density, i.e. living in an LSOA with a larger proportion of people from the same ethnic group, was protective against PND, but only for White women: women who are White British, White Irish and White Other. Interestingly, overall ethnic density, i.e. living in an area with a low or a high proportion of people from all BME groups, had no effect on the risk of PND, for either White or BME women. Moreover, ethnicity per se had no effect, after adjusting for other risk factors for PND. Finally, own or overall ethnic density did not independently predict whether women screened positive for personality dysfunction.
Relationship to previous findings
The findings of this study, which demonstrated that living in areas of higher own ethnic density is protective against common mental illness, are in line with previous research. Reference Halpern and Nazroo3,Reference Fagg, Curtis, Stansfeld and Congdon28–Reference Stafford, Becares and Nazroo30 Indeed, our data strengthen this notion, by showing for the first time that living in areas of higher own ethnic density is protective specifically in White women against developing PND, and even after adjusting for area-level deprivation, parity, relationship status and maternal age. Moreover, our finding that own ethnic density is specifically protective for White women and not BME women is, in fact, in agreement with previous findings showing an ethnic density effect for White populations only. Reference Stafford, Becares and Nazroo30,Reference Karlsen, Nazroo and Stephenson31 Our finding that an ethnic density effect does not exist for BME women is also in line with previous research, Reference Pickett, Shaw, Atkin, Kiernan and Wilkinson7,Reference Ecob and Williams32,Reference Shields and Wailoo33 and particularly with the only other study that has evaluated the association between own ethnic density and PND, which found no buffering effect of ethnic density in BME women. Reference Pickett, Shaw, Atkin, Kiernan and Wilkinson7
In addition to finding an own ethnic density effect, our data demonstrate that the effect is differential for overall ethnic density, and for personality dysfunction. The fact that there is no significant protective effect of living in areas of higher overall ethnic density emphasises that living among co-ethnics is ultimately what contributes to the driving mechanism of the ethnic density effect within our sample. This could be because social support is a very important factor for a woman vulnerable to PND, Reference Beck34–Reference Lancaster, Gold, Flynn, Yoo, Marcus and Davis36 and so by living among co-ethnics, she may feel less isolated and form a stronger social network. Moreover, having a new baby is a challenging and life-changing event for most women, and one can see how, during those first few months where a woman is predominantly at home, the area in which she lives could influence her state of mind. However, this is the first study that examined the effects of both own and overall ethnic density on PND within the same sample; most research demonstrates a protective effect of high overall ethnic density in schizophrenia and mental health in general, Reference Propper, Jones, Bolster, Burgess, Johnston and Sarker37–Reference Kirkbride, Boydell, Ploubidis, Morgan, Dazzan and McKenzie40 but only four studies have demonstrated a protective effect of own ethnic density, again, in relation to psychosis and general mental health. Reference Halpern and Nazroo3,Reference Fagg, Curtis, Stansfeld and Congdon28–Reference Stafford, Becares and Nazroo30
Although we found that women who screened positively for personality dysfunction were more likely to live in areas of lower own ethnic density, multilevel regression modelling revealed that screening positive for PND confounded this association. Personality dysfunction is generally a long-term difficulty and our finding is consistent with other research which has failed to detect an association between ethnic density and other long-term conditions. Reference Stafford, Becares and Nazroo30 However, we suspect that the main reason why personality dysfunction was impervious to the protective effects of ethnic density relates to the definition of personality disorder. One of the key defining features of personality disorder is poor interpersonal functioning, i.e. a general impairment in all human relationships. We hypothesise that this impairment is related to sheer proximity to other individuals, and is not specifically linked to a defining demographic feature of the other individual, such as their ethnicity.
Our findings demonstrate how a protective association between own ethnic density and PND exists for White women within the sample, but not for BME women. Indeed, there might be several putative reasons as to why no significant ethnic density effect was found within our BME women. First, within the sample there were very few BME women living in areas of higher own ethnic density, as confirmed by the narrow interquartile ranges (Table 2), making it less likely that significant differences associated with changes in own ethnic density concentrations would be detected within the BME group, especially if there were an ethnic density effect ‘threshold’; in other words, the own ethnic density concentrations for the BME women in the sample may not have been high enough to exert any protective effect against PND. Second, as suggested by Halpern & Nazroo, Reference Halpern and Nazroo3 variations in the ethnic density effect between ethnic groups may represent differences in the ability of some ethnic groups to protect the mental health of their members. In their national community survey, these authors demonstrated how the ethnic density effect for Pakistani people was not protective against mental ill health. Reference Halpern and Nazroo3 It is even possible that the ethnic density effect could have negatively affected certain ethnic groups within our sample, but because all our ethnic groups were combined into one BME group, any negative effects for certain groups could have masked the overall putative protective effects for other BME groups.
Strengths and limitations
Our study, the first to demonstrate a significant effect in the association between ethnic density and PND, used structured, validated instruments and appropriate statistical methods that took into account geographical clustering and non-independence of observations. Furthermore, we were able to control for sociodemographic differences between the groups, and the assessment of ethnic density was conducted at the lowest level of geography, which most studies have not done, Reference Shaw, Atkin, Bécares, Albor, Stafford and Kiernan26 and included both own and overall ethnic density assessments.
However, the study had some caveats. First, although we demonstrate that there is a protective ethnic density effect against PND for White women in our sample, it is important to note that the effect size is small. Second, the study was based on a sample recruited from a single centre in London. Although the hospital centre covers a wide, socially heterogeneous area, the generalisability of our findings to other centres is uncertain. Moreover, excluding women with poor English fluency, who were unable to provide fully informed consent also altered the generalisability of our findings and may have introduced selection bias. However, as only 2% (n = 63) of the approached sample was excluded based on this criterion, the impact of this would have been minimal. Third, we were unable to definitively measure depression and personality disorder and were instead reliant on screening measures, rather than clinical interviews. Although this has allowed us to collect data on this large sample of more than 2600 women, and both instruments have been validated extensively, Reference Kroenke, Spitzer and Williams13–Reference Crawford, Price, Gordon, Josson, Taylor and Bateman22 this approach is less robust than direct interviews. Fourth, the prevalence rate of PND in our sample was relatively low compared with previously reported period prevalence rates in the UK. Reference Gavin, Gaynes, Lohr, Meltzer-Brody, Gartlehner and Swinson9 However, the reported rate of PND in this study was a point prevalence of moderate to severe depression, in a community sample, at 6 weeks postpartum. Since research shows that only 3–5% of new mothers develop moderate to severe PND, within the first 4–6 weeks after birth, Reference O'Hara and Swain41 the prevalence rate of PND in our sample is not especially low. Reference O'Hara and Swain41 Finally, the definitions of ethnicity used did not necessarily tap into notions of cultural identity: they did not represent religious affiliations or the first language spoken by the participants, both of which may have influenced the protective effects of ethnic density. Furthermore, our sample consisted of 16 ethnic groups, but the small numbers of participants in some groups limited our ability to examine fully the ethnic density effect separately in all these groups. Combining all BME women into one group represents another limitation, and may have masked any ethnic density effect, whether detrimental or protective, especially when the prevalence rates for both PND and personality dysfunction vary across BME groups, and particularly in comparison with the White population. Indeed, combining all BME women into one group may have masked the effects of factors that differ between groups, such as reasons for immigration, settlement patterns, cultural identity, family traditions and age structure.
Implications and future research
The results of this study provided some compelling evidence in support of the notion that higher own ethnic density was protective against PND for White women in London, and demonstrated the importance of social factors in the aetiology of the disorder. Future studies should examine the impact of language, religion, social capital, acculturation and nativity, which could all have ultimately contributed to the ethnic density effect. From a clinical point of view, ethnic density could help identify ‘at risk’ women during pregnancy: women living in areas where they feel isolated and alone could be offered more support during the postnatal period, and thus we propose that it would be potentially beneficial for midwives and doctors to ask pregnant women about the neighbourhood in which they live. Finally, although the mechanisms of the ethnic density effect in PND are not definitively clear, the findings of this study serve to underline the potential ‘psychic shelter’ function of ethnically dense neighbourhoods, Reference Kirkbride, Morgan, Fearon, Dazzan, Murray and Jones39 and stress the importance of further research in the potential protective effects of ethnic density in different BME groups, in order also to inform social policies regulating dispersal and housing of immigrants and asylum seekers, especially if they are particularly vulnerable, such as pregnant women.
Acknowledgements
We thank all the women who gave their time to contribute to the study and the staff of King's College Hospital who helped to facilitate the recruitment of participants. Thanks also to Robin Schacht, Helen Davies and Laura Jones who assisted with recruitment and screening, and to Dr Jayati Das-Munshi for her advice on generating the ethnic density variables.


eLetters
No eLetters have been published for this article.