


Selective serotonin reuptake inhibitors (SSRIs) are the common standard of pharmacological treatment of depressive disorders in adults and are recommended in major clinical practice guidelines. 1–3 However, some critics doubt that SSRIs and other antidepressants have clinically relevant benefits over placebo, Reference Ioannidis, Evans, Gotzsche, O'Neill, Altman and Schulz4–Reference Moncrieff6 because drug–placebo differences become smaller if unpublished trials are included in meta-analyses. Reference Turner, Matthews, Linardatos, Tell and Rosenthal7 Some researchers argue that even the remaining small differences between drugs and placebo may be attributable to the unblinding of active treatment, because patients may find out whether they are receiving drug or placebo owing to the side-effects of the active drug. Reference Kirsch5 Unblinding could increase placebo effects in the true treatment group through increased expectancy and lead to an overestimation of the efficacy of the active drug. Reference Kirsch5 If this were true one would expect that trials showing larger differences in adverse events between drug and placebo would also show larger differences regarding improvement. An older meta-analysis did indeed find a strong association between efficacy and adverse effects, but the results were based on only six trials. Reference Greenberg, Bornstein, Zborowski, Fisher and Greenberg8 To our knowledge no current systematic review addressing this issue exists. Therefore, we aimed to investigate whether there is evidence of an association between adverse effects and efficacy in a larger set of trials comparing SSRIs with placebo.
Method
Potentially relevant articles were searched for in the Cochrane Register of Controlled Trials (CENTRAL) and PubMed (last update on 2 August 2013). In addition, we screened reference lists of relevant reviews and included trials. We then searched clinical trial registries of drug companies (online Table DS1). Two reviewers (M.B. and S.K.) independently screened titles and abstracts of retrieved citations and excluded clearly irrelevant reports. Subsequently, the full texts of all potentially relevant papers were obtained and checked against the inclusion criteria by two reviewers. Disagreements were resolved by discussion with a third reviewer (K.L.). To be included in our review, studies had to be double-blind, placebo-controlled, randomised trials with at least 10 patients per study group and an active treatment period (post-randomisation) of 4–13 weeks. Participants were adults who experienced an acute (single or recurrent) episode of moderate to severe major depression, scoring at least 14 points on the Hamilton Rating Scale for Depression (HRSD) or 20 points on the Montgomery–Åsberg Depression Rating Scale (MADRS), Reference Hamilton9,Reference Montgomery and Åsberg10 according to DSM-III (or later) criteria. Studies with a majority of patients over 65 years old (median >65 years) or under 18 years old were excluded. Eligible treatments were SSRIs (citalopram, escitalopram, fluoxetine, fluvoxamine, paroxetine, sertraline, vilazodone) or placebo, prescribed in adequate dosage according to the American Psychiatric Association's guidelines as monotherapy. 1 The number or proportion of patients experiencing a symptom scale score reduction of at least 50% on the HRSD or MADRS had to be reported or imputable from available score data using the normal distribution assumption. Furthermore, the number or proportion of patients experiencing adverse events or adverse effects had to be reported.
Data extraction, major outcomes and assessment of bias
Two reviewers (M.B. and S.K.) independently extracted data on participants, methods, intervention details and outcomes from the included studies using a standardised form. Data from publications were supplemented by clinical study reports, clinical trial registers and publicly available reports of the US Food and Drug Administration, the German Institute for Quality and Efficacy in Healthcare and the UK National Institute for Health and Care Excellence. The primary efficacy outcome of our review was response after treatment, defined as the number of patients who had a reduction of at least 50% in symptom severity between baseline and end-point on a standardised rating scale. When trials reported efficacy results according to more than one rating scale, the scale chosen as the primary outcome by the study authors was used in the analysis; otherwise the HRSD results were prioritised. Participants who were randomised but not included in the intention-to-treat analysis were counted as non-responders. As a secondary efficacy outcome we extracted mean change in depression score from baseline (mean score at end of treatment minus mean score at baseline) with its respective standard deviation. When only standard errors or P-values were reported, standard deviations were calculated according to the Cochrane Handbook. Reference Higgins, Deeks, Higgins and Green11 The primary safety outcome was the number or proportion of people experiencing at least one adverse event. If data on adverse events were not reported, reports of adverse effects were used. In case of discrepancies between journal publications and study reports (or summaries) from pharmaceutical manufacturer registers, data from the latter were used.
The risk of bias in included studies was assessed with the Cochrane Collaboration's tool Reference Higgins, Deeks, Higgins and Green12 for the following domains: adequacy of the random sequence generation, concealment of allocation, masking (blinding) of the participants, personnel and outcome assessors, and incomplete outcome data (application of the intention-to-treat principle). We did not assess the risk of bias due to selective reporting and other sources of bias, as our inclusion criteria warranted that all studies reported the outcome data needed for analysis. The risk of bias was categorised into low, unclear or high risk for each domain. Overall risk of bias was considered high if one or more domains were rated as high risk and low if at least three domains were rated as low risk and none was rated high.
Data synthesis
To summarise the findings of individual studies we calculated odds ratios and their corresponding 95% confidence intervals for patients responding and for the number of patients reporting at least one adverse event. Standardised mean differences (SMDs) were calculated for change from baseline. An odds ratio greater than 1 indicates more responders or more patients with adverse events in the treatment group. A negative SMD indicates more symptom reduction in the treatment group. To ensure that each patient's data appeared only once in the meta-analysis, we pooled intervention groups and split placebo groups according to the Cochrane Handbook. Reference Higgins, Deeks, Higgins and Green11 We used correlation analyses (Pearson correlation coefficients, inverse variance weighted analysis) to investigate the relationship between adverse events and efficacy within and between the groups. We used the logarithm of odds of response and adverse events respectively to measure the change in symptom severity from baseline effect size (change from baseline mean divided by its standard deviation) for within-group analyses. Logarithm of OR of response and adverse events (and SMD of change from baseline) were used for the analyses between groups. Taking the log of odds and odds ratios enabled the fitting of linear models (correlation, regression) with the assumption of normally distributed residuals. We performed random effects meta-analyses with inverse variance weighting for the outcomes response, number of patients with adverse events and change from baseline. Reference DerSimonian and Laird13 Between-study heterogeneity was assessed using tau-squared, I 2 and chi-squared tests.
We used inverse variance weighted random effects meta-regression to investigate whether there was a relationship between the logarithmic OR (logOR) for the number of patients with adverse events and the logOR for response or the SMD from change from baseline respectively. Reference Lipsey and Wilson14 We also investigated whether potential confounders had an influence on this relationship, including them and their interaction with the logOR of patients with adverse events in a stepwise manner. Predefined variables were mean severity of depression (low v. high, defined as HRSD <25 v. ⩾25 or MADRS <35 or ⩾35); 3,Reference Cusin, Yang, Yeung, Fava, Baer and Blais15 dosing of medication (classified according to Gartlehner et al); Reference Gartlehner, Hansen, Thieda, DeVeaugh-Geiss, Gaynes and Krebs16 overall risk of bias; publication status; response and adverse event rates (log odds) in the placebo group; and trial size (median split). As post hoc analyses we added reporting of response data (v. needing to impute response from continuous data), adverse events specification (treatment-related v. other) and the probability of being assigned to the placebo group. Reference Papakostas and Fava17 To minimise multicollinearity, interaction terms were built from centred variables.
To investigate whether adverse events mediated the relationship between treatment and efficacy, we used the mediation framework approach of Baron & Kenny. Reference Baron and Kenny18 These analyses were performed at the study arm level. According to this approach mediation exists when four conditions are met: first (pathway c) the predictor (in this case treatment) must be significantly related to the outcome variable (response log odds); second (pathway a) the predictor must also be significantly related to the potential mediator (adverse events log odds); third (pathway b) the mediator must be significantly related to the outcome when the effect of the predictor on the outcome is controlled for; and fourth (pathway c′) the relationship between predictor and outcome must be decreased (lower than in pathway c) when controlling for the mediator. If the predictor remains significant when the mediator is controlled for, the mediation is considered partial. When controlling for the mediator renders the predictor non-significant, mediation is considered complete. Statistical significance was set to P<0.05. To avoid missing some true mediation effects, Reference MacKinnon, Fairchild and Fritz19 indirect effects were calculated and tested for significance. Reference Sobel and Leinhart20–Reference MacKinnon, Lockwood, Hoffman, West and Sheets23 Mediation analyses were conducted with random effects model (via restricted information maximum likelihood) and inverse variance weighting. Meta-analyses were performed using Review Manager 5.2 and meta-regression and mediation analyses were conducted with IBM SPSS Statistics for Windows version 21.0 using a macro by Wilson. Reference Wilson24
Results
The literature search identified 1002 potentially relevant references (Fig. 1). We excluded 856 records after the screening of titles and abstracts and a further 51 after checking the full texts. A total of 68 studies published in 95 reports or publications were included in the systematic review (online Table DS2). The most frequent reason for exclusion of studies was lack of reporting of proportion of patients with at least one adverse event.

Fig. 1 Literature search process.
Characteristics of included studies
The 68 studies included a total of 17 646 participants (10 376 allocated to active treatment and 7270 to placebo); the median number of participants per study was 252 (range 25–877). An overview of study characteristics is given in Table 1, with full details in online Table DS3. Thirteen trials (19%) were completely unpublished and 5 (7%) were only published as congress abstracts. Data from 10 additional trials (15%) were not published in stand-alone journal articles but included in publications pooling primary data from at least two trials. Fifty-four studies were multi-arm trials which compared different active agents or different dosages of the same agent with placebo. The overall risk of bias was considered high for 33 studies, unclear for 27 and low for 8 studies.
Table 1 Characteristics of included studies (68 studies)
| Patient characteristics at baseline | |
| Total study participants, n | 17 646 |
| Total patients in
treatment/placebo groups, n (%) |
10 376/7270 (59/41) |
| Patients per trial, n: median (range) | 252 (25–877) |
| Proportion of
included women in the study, %: treatment/placebo group |
63 (63/64) |
| Age, years: median (range) | 41 (34–51) |
| Out-patients/in-patients/both/not reported, n (%) | 52/2/3/11 (77/3/4/16) |
| Diagnosis according to | |
| DSM-III/DSM-III-R, n (%) | 18/8 (38) |
| DSM-IV/DSM-IV-TR, n (%) | 33/9 (62) |
| Diagnosis, n (%) | |
| Major depression | 63 (93) |
| Major depression + melancholia/anxiety | 3/1 (4/1.5) |
| Double depression | 1 (1.5) |
| Depression scale scores: mean (s.d.) range | |
| HRSD-17 | 23.0 (3.5) 17.2–28.3 |
| HRSD-21 | 25.9 (4.0) 18.3–30.5 |
| MADRS | 30.1 (4.4) 26.8–35.4 |
| Design and treatment | |
| Number of trial arms | |
| Two/three/four/five, n (%) | 14/41/9/4 (21/60/13/6) |
| Total of SSRI arms, n | 85 |
| SSRI arms used for
analysis (after pooling of trial arms), n |
75 |
| Duration of active
treatment, weeks: range (median) |
4–12 (8) |
| SSRIs investigated: | |
| randomised patients/treatment/placebo group, n | |
| Citalopram (5 studies) | 1139/750/389 |
| Escitalopram (13 studies) | 4049/2488/1561 |
| Fluoxetine (10 studies) | 1986/1214/772 |
| Fluvoxamine (2 studies) | 200/100/100 |
| Paroxetine (38 studies) | 8122/4621/3501 |
| Sertraline (5 studies | 1263/758/505 |
| Vilazodone (2 studies) | 891/445/446 |
| Fixed/flexible dose administration scheme, n (%) | 27/41 (40/60) |
| Outcome measurement and data
available for analysis |
|
| Scales used HRSD-17/HRSD-21/MADRS | 28/27/13 |
| Response in
HRSD-17/HRSD-21/MADRS (total in %) |
18/19/11 (71) |
| Response
estimated in HRSD-17/HRSD-21/ MADRS (total in %) |
10/08/02 (29) |
HRSD, Hamilton Rating Scale for Depression; MADRS. Montgomery–Åsberg Depression Rating Scale; SSRI, selective serotonin reuptake inhibitor.
Availability of outcome data and basic findings
The number of responders was reported in 48 studies and was estimated from continuous data in 20 studies. Means for symptom severity change from baseline were reported in 66 studies, but for 48 studies standard deviations had to be imputed. The number of patients with ‘adverse events’ or ‘any adverse event’ was reported by 43 studies, whereas the remaining 25 studies reported only the number of patients with adverse effects (i.e. adverse events related to the treatment, such as ‘treatment emergent adverse events/symptoms’ or ‘side-effects’). The proportion of patients responding ranged from 14% to 74% (median 48%) in groups receiving SSRIs and from 8% to 59% (median 38%) in placebo groups; the standardised mean severity change from baseline within groups ranged from 0.80 to 2.83 (median 1.40) and from 0.38 to 2.05 (median 1.10) respectively. The proportion of patients reporting adverse events ranged from 16% to 98% (median 80%) under SSRI treatment and from 17% to 94% (median 70%) under placebo. There was no statistically significant correlation in the treatment group between response and adverse events (inverse variance weighted analysis using log odds transformed values, Pearson correlation coefficients). In contrast, there was a moderate correlation between the effect size mean severity change from baseline and adverse events in the treatment group (r = 0.280, P = 0.009). No statistically significant correlation between response and adverse events was found in placebo groups.
Meta-analysis
In the random effects meta-analysis, SSRIs showed significantly higher response rates than placebo (OR = 1.62, 95% CI 1.51–1.72; Table 2). There was no evidence of between-study heterogeneity (P = 0.49, I 2 = 0%). There was no indication that effects over placebo varied between different agents (P = 0.98, I 2 = 0% in the test for subgroup differences). Treatment with SSRIs was also found to be superior to placebo when symptom severity change from baseline was used as the outcome measure (SMD −0.27, 95% CI −0.31 to −0.23; Table 3). There was some between-study heterogeneity (P<0.001, I = 33%) but no evidence of subgroup differences according to agents (P = 0.33, I 2 = 13%). Patients allocated to receive SSRIs reported significantly more adverse events than those receiving placebo (OR = 1.73, 95% CI 1.58 to 1.89; Table 2). There was low between-study heterogeneity (P = 0.02, I 2 = 28%) and evidence for differences between single agents (P<0.01, I 2 = 68%).
Table 2 Results of meta-analysis: response and adverse events (75 studies)

| Treatment group | Placebo group | |||||
|---|---|---|---|---|---|---|
| Events | Total | Events | Total | Weight, % | OR (95% CI) | |
| Response | ||||||
| Citalopram (5 studies) | 377 | 750 | 147 | 389 | 6.3 | 1.66 (1.28–2.15) |
| Escitalopram (13 studies) | 1221 | 2488 | 599 | 1561 | 22.2 | 1.65 (1.44–1.89) |
| Fluoxetine (10 studies) | 687 | 1214 | 303 | 772 | 10.5 | 1.60 (1.23–2.08) |
| Fluvoxamine (2 studies) | 40 | 100 | 25 | 100 | 1.1 | 2.03 (1.10–3.73) |
| Paroxetine (38 studies) | 2400 | 4621 | 1424 | 3501 | 47.2 | 1.58 (1.43–1.75) |
| Sertraline (5 studies) | 348 | 758 | 177 | 505 | 7.1 | 1.72 (1.35–2.20) |
| Vilazodone (2 studies) | 190 | 445 | 141 | 446 | 5.6 | 1.61 (1.23–2.12) |
| Total | 5263 | 10 376 | 2816 | 7274 | 100.0 | 1.62 (1.51–1.72) |
| Heterogeneity: τ = 0.00, χ2 = 73.65, d.f. = 74 (P = 0.49), I 2 = 0% | ||||||
| Test for overall effect: Z = 14.55 (P<0.001) | ||||||
| Test for subgroup differences: χ2 = 1.10, d.f. = 6 (P = 0.98), I 2 = 0% | ||||||
| Adverse events | ||||||
| Citalopram (5 studies) | 535 | 750 | 223 | 389 | 7.6 | 1.46 (1.11–1.93) |
| Escitalopram (13 studies) | 1731 | 2488 | 948 | 1561 | 23.5 | 1.36 (1.18–1.57) |
| Fluoxetine (10 studies) | 1035 | 1214 | 579 | 772 | 9.3 | 1.57 (1.21–2.04) |
| Fluvoxamine (2 studies) | 85 | 100 | 73 | 100 | 1.4 | 2.05 (0.83–5.06) |
| Paroxetine (38 studies) | 3778 | 4621 | 2414 | 3501 | 46.0 | 1.90 (1.66–2.16) |
| Sertraline (5 studies) | 534 | 758 | 271 | 505 | 7.4 | 1.99 (1.19–3.31) |
| Vilazodone (2 studies) | 357 | 445 | 280 | 446 | 4.9 | 2.40 (1.78–3.25) |
| Total | 8055 | 10 376 | 4788 | 7274 | 100.0 | 1.73 (1.58–1.89) |
| Heterogeneity: τ = 0.04, = 102.47, d.f. = 74 (P = 0.02), I 2 = 28% | ||||||
| Test for overall effect: Z = 11.73 (P<0.001) | ||||||
| Test for subgroup differences: χ2 = 18.51, d.f. = 6 (P = 0.005), I 2 = 67.6% | ||||||
OR, odds ratio.
Table 3 Results of meta-analysis: symptom severity change from baseline (72 studies)

| Treatment group | Placebo group | Weight, % | SMD (95% CI) | |
|---|---|---|---|---|
| Citalopram (5 studies) | 750 | 389 | 6.9 | −0.26 (−0.38 to −0.13) |
| Escitalopram (13 studies) | 2488 | 1561 | 21.3 | −0.27 (−0.33 to −0.20) |
| Fluoxetine (8 studies) | 1143 | 705 | 10.4 | −0.18 (−0.31 to −0.06) |
| Fluvoxamine (2 studies) | 100 | 100 | 1.6 | −0.48 (−0.77 to −0.20) |
| Paroxetine (37 studies) | 4578 | 3452 | 47.6 | −0.29 (−0.36 to −0.22) |
| Sertraline (5 studies) | 758 | 505 | 7.7 | −0.33 (−0.45 to −0.21) |
| Vilazodone (2 studies) | 445 | 446 | 4.5 | −0.18 (−0.32 to −0.05) |
| Total | 10 262 | 7158 | 100.0 | −0.27 (−0.31 to −0.23) |
| Heterogeneity: τ = 0.01, χ2 = 106.47, d.f. = 71 (P = 0.004), I 2 = 33% | ||||
| Test for overall effect: Z = 13.05 (P<0.001) | ||||
| Test for subgroup differences: χ2 = 6.87, d.f. = 6 (P = 0.33), I 2 = 12.6% | ||||
SMD, standardised mean difference.
Meta-regression analysis
We did not find any statistically significant correlation between response over placebo (logOR response) and group differences regarding adverse events. Similarly, in the meta-regression there was no significant association between efficacy (logOR response) and tolerability (logOR adverse events) of SSRIs in comparison with placebo (β = 0.064, SE = 0.083, P = 0.439; Fig. 2). We found no statistically significant correlation between SMD for change from baseline values and adverse events. In the meta-regression analysis with adverse events as predictor and mean severity change from baseline as dependent variable no statistically significant effect was found (β = 0.062, SE = 0.045; P = 0.167). Adding confounders to the model did not provide evidence that the association of adverse and beneficial effects was suppressed or varied across subgroups except for a statistically significant moderating effect of trial size (P = 0.04), suggesting that the investigated association might be more pronounced in small rather than in large trials (online Table DS4).

Fig. 2 Association between adverse events and response.
Each dot indicates a study, its size corresponding to the study weight. The regression coefficient for the relative treatment effect on response is regressed on the relative treatment effect on adverse events (inverse variance weighted): β = 0.064, 95% CI −0.098 to 0.225; P = 0.439.
Mediation analysis
Treatment with an SSRI was significantly associated with better treatment response in pathway c (β = 0.499, SE = 0.071, P<0.001; Fig. 3) and with higher rates of patients with adverse events in pathway a (β = 0.663, SE = 0.136, P<0.001). In pathway b no significant association was found between adverse events and outcome (β = −0.036, SE = 0.041, P = 0.384). The direct relationship between SSRI treatment and treatment response under control of adverse events (pathway c′) was statistically significant (β = 0.524, SE = 0.077, P<0.001). In contrast, the indirect effect of mediation was not statistically significant (β = −0.024, SE = 0.028, P = 0.402). As one of the conditions for mediation (association of mediator with the outcome under control of the predictor) remained unfulfilled, no evidence of the mediating role of adverse events between treatment and response was found. These results were confirmed when change from baseline was used as the outcome variable, when potential confounders were included in the analyses and when analyses were restricted to the SSRI tested most often (online Tables DS5–7).
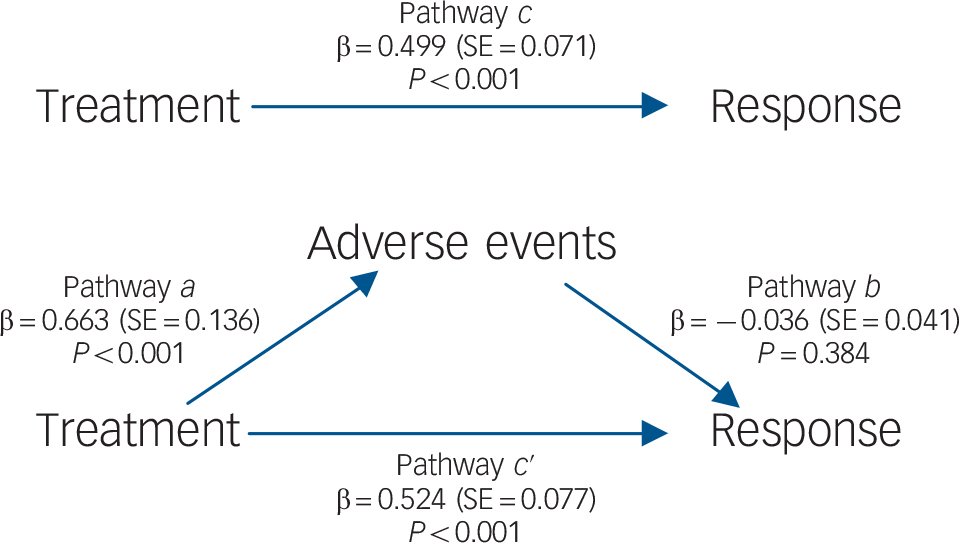
Fig. 3 Mediation model for response, showing the direct pathways (a, b, c) and mediated pathway (c ′).
Discussion
In this systematic review of 68 studies we investigated the potential association between efficacy and adverse events during SSRI treatment. In the preliminary meta-analysis we found small beneficial effects of SSRIs compared with placebo in terms of efficacy, with a higher proportion of patients reporting adverse events. The meta-regression analyses, however, did not show any significant association between adverse events and efficacy, even after controlling for clinical variables (severity of depression, medication dosage) and methodological variables (overall risk of bias, publication status, trial size). Consistently the mediation analysis confirmed these results, suggesting no mediation effect between treatment itself (SSRI or placebo) and efficacy due to adverse events. In terms of efficacy our findings are similar to previous meta-analyses. Reference Turner, Matthews, Linardatos, Tell and Rosenthal7,Reference Barbui, Furukawa and Cipriani25,Reference Kirsch, Deacon, Huedo-Medina, Scoboria, Moore and Johnson26 Many placebo-controlled trials of SSRIs are unpublished and if these are included in the analyses, effects over placebo are small. However, for all SSRIs the effect over placebo was statistically significant and consistent with effect estimates showing no or little statistical heterogeneity.
We did not find a statistically significant association between adverse effects and efficacy. This is in contrast to the findings of Greenberg et al; in their meta-analysis of fluoxetine compared with placebo these authors reported a strong correlation between adverse events and efficacy (r = 0.85 for clinician-rated and r = 0.96 for patient-rated efficacy measures). Reference Greenberg, Bornstein, Zborowski, Fisher and Greenberg8 On the basis of these findings Greenberg et al supposed that outcome scores for patients allocated to active drug treatment might be amplified when study participants became aware of treatment by experiencing adverse events; however, the correlation analyses were based on only four to six clinical trials. We are not aware of any published meta-regression and mediation analyses on this topic. The main strength of meta-regression is the possibility in analysing moderators and weighting for precision of estimates (with large, precise studies obtaining a larger weight). However, to investigate the indirect effects from treatment to efficacy mediated by adverse events, arm-based analyses are needed (no between-group outcomes such as OR but rather within-group ones, e.g. odds). Mediation solves this problem by comparing the treatment arms of different studies with each other. We considered this kind of analysis to be the best possible way to investigate our question about the mediating effect of adverse events in SSRI treatment within a meta-analytical framework. Again, neither meta-regression nor mediation analysis provided any hint that adverse effects have any influence on efficacy.
Study limitations
When interpreting our findings three important limitations have to be considered. First, as in previous analyses, Reference Greenberg, Bornstein, Zborowski, Fisher and Greenberg8 we had to use adverse events or adverse effects as a surrogate for unblinding and resulting changes in expectations. Only a tiny proportion of drug trials assess blinding. This applies to our data-set, to trials in affective disorders or schizophrenia in general, Reference Baethge, Asall and Baldessarini27 and to a random sample of trials from the medical literature. Reference Bello, Moustgaard and Hrobjartsson28 Therefore, it was impossible to investigate the association between unblinding and efficacy directly. Furthermore, assessing unblinding is problematic and the recommendation to report related results has been deleted in the second revision of the CONSORT guidelines for reporting randomised controlled trials. Reference Moher, Hopewell, Schulz, Montori, Gotzsche and Devereaux29 Similarly, to the best of our knowledge validated methods to assess changes in patient expectations during a trial do not exist. Second, we had to use the number of patients reporting at least one adverse event or adverse effect to investigate the association between adverse events and efficacy. Specific adverse effects (e.g. sexual dysfunction) are likely to have a higher impact on unblinding and related expectations than non-specific adverse events and adverse effects. Minor adverse effects might lead to unblinding (leading to an overestimation of treatment effects) and more severe adverse effects might lead to study drop-out (possibly decreasing group differences depending on the method for replacing missing values). However, methods to assess specific adverse effects and their reporting are extremely variable. Reference Rief, Nestoriuc, von Lilienfeld-Toal, Dogan, Schreiber and Hofmann30 In our study population the proportion of patients reporting adverse events varied between 16% and 98%. When a high proportion of patients in the active treatment group reported adverse events, the placebo group reported this as well. Reference Shedden Mora, Nestoriuc and Rief31 This strong association is most probably due to methodological reasons. If any adverse event is reported, this leads to higher numbers than reporting of treatment-related adverse effects only. Structured interviews with specific symptom lists produce different rates of reported side-effects compared with open questions. Reference Rief, Nestoriuc, von Lilienfeld-Toal, Dogan, Schreiber and Hofmann30,Reference Rief, Avorn and Barsky32 Furthermore, previous depression and intake of antidepressant drugs in the past can lead to sensitisation and symptom provocation. Reference Colloca and Benedetti33 Some studies report specific adverse details in great detail (with highly variable categorisations of groups of side-effects), whereas others provide only overall numbers. This made it impossible to investigate the association between specific adverse effects and efficacy in our data-set. The number of patients with at least one adverse event or adverse effect allows straightforward extraction of a defined numerator and denominator (the number of patients randomised) even when trials used variable assessment methods and ensures that a participant is included only once in the analysis.
A third important limitation of our analysis was the use of aggregated data (proportion of patients with adverse events and response, and mean change from baseline). It would be clearly more sensitive and more valid to investigate the potential association and mediation of adverse events and efficacy in individual patient data meta-analysis. Reference Fournier, DeRubeis, Hollon, Dimidjian, Amsterdam and Shelton34,Reference Gibbons, Hur, Brown, Davis and Mann35 However, the use of individual patient data does not resolve the problem that trials use variable methods to assess adverse effects, and reliable methods for measuring unblinding are not available.
Study implications
Our results do not support the hypothesis that efficacy of antidepressants over placebo in randomised trials is biased by unblinding due to adverse effects. These findings were consistent across different efficacy outcomes and statistical methods. However, due to fundamental methodological challenges inherent to the topic investigated, our results should be interpreted with caution and considered only as preliminary evidence. As at least some of these issues could be addressed in ad hoc large trials or individual patient data meta-analyses, such studies would be desirable.


eLetters
No eLetters have been published for this article.