


Abnormal brain oscillations, observed via electroencephalography (EEG) and magnetoencephalography (MEG) are commonly reported in schizophrenia. Reference Edgar, Hanlon, Huang, Weisend, Thoma and Carpenter1–Reference Narayanan, O'Neil, Berwise, Stevens, Calhoun and Clementz6 Resting-state oscillatory findings have been inconsistent, likely because of the heterogeneity intrinsic to schizophrenia (such as age, symptoms, medications) as well as methodological issues (for example analysis procedures, EEG v. MEG). Most studies, however, observe more delta (1–4 Hz) and theta (4–7 Hz) resting-state activity in people with schizophrenia than in controls, Reference Fehr, Kissler, Moratti, Wienbruch, Rockstroh and Elbert2,Reference Winterer, Ziller, Dorn, Frick, Mulert and Wuebben5,Reference Canive, Lewine, Edgar, Davis, Miller and Torres7–Reference Wienbruch, Moratti, Elbert, Vogel, Fehr and Kissler12 with two recent meta-analyses concluding that enhanced low-frequency activity in schizophrenia is a robust finding. Reference Galderisi, Mucci, Volpe and Boutros13 Although delta and theta oscillatory activity is common in stage 3 and 4 of slow-wave sleep, Reference Iramina and Ueno14–Reference Rechtschaffen and Kales16 such activity during awake states is pathological, associated with traumatic brain injury, Reference Huang, Nichols, Robb, Angeles, Drake and Holland17 Alzheimer's disease Reference Fernandez, Maestu, Amo, Gil, Fehr and Wienbruch18 and brain lesions. Reference Vieth, Kober and Grummich19 Given increased slow-wave activity during the waking state in schizophrenia and given that individuals with schizophrenia typically do not show frank pathology on structural magnetic resonance imaging (MRI), it has been suggested that part of the brain in schizophrenia might be in an inactive ‘sleep-like state’ Reference Llinas, Urbano, Leznik, Ramirez and van Marle15,Reference Lisman20 or that slow-wave activity in schizophrenia reflects subtle brain pathology.
There appears to be some specificity for slow-wave abnormalities in schizophrenia. Slow-wave abnormalities are observed in unmedicated individuals with schizophrenia. Reference Galderisi, Mucci, Volpe and Boutros13 Sponheim et al Reference Sponheim, Clementz, Iacono and Beiser11 found slow-wave abnormalities in both first episode schizophrenia as well as in individuals with chronic schizophrenia, suggesting that slow-wave abnormalities are stable characteristics of schizophrenia and not associated with treatment. Examining slowing in different psychiatric groups, Rockstroh et al Reference Rockstroh, Wienbruch, Ray and Elbert21 reported that the spatial topography of slow-wave activity distinguishes individuals with schizophrenia from individuals with neurotic/affective diagnoses. Narayanan et al Reference Narayanan, O'Neil, Berwise, Stevens, Calhoun and Clementz6 also reported that individuals with schizophrenia and their first-degree relatives showed augmented resting-state delta activity, whereas individuals with bipolar disorder and their first-degree relatives showed augmented fast alpha activity. Finally, Venables et al Reference Venables, Bernat and Sponheim22 examined resting-state EEG activity in people with schizophrenia, bipolar disorder and their first-degree relatives. The authors found that abnormal low-frequency EEG resting activity was specific to people with schizophrenia and their relatives, as well as showing that abnormal slow-wave activity is associated with the Val158Met polymorphism of the COMT gene. Although abnormal slow-wave activity is frequently reported in EEG studies of schizophrenia, Reference Rechtschaffen and Kales16 the reported source location or scalp distribution of slow-wave abnormalities in schizophrenia varies, with EEG studies reporting abnormal slowing in schizophrenia over posterior, frontal-midline and frontal-temporal regions. Reference Iramina and Ueno14,Reference Fernandez, Maestu, Amo, Gil, Fehr and Wienbruch18,Reference Nakashima and Sato23,Reference Fehr, Kissler, Wienbruch, Moratti, Elbert and Watzl24 Inconsistency across EEG studies may be a result of variability in participants in the location of slow-wave pathology or because the scalp distribution of EEG power can be ambiguous. Reference Pascual-Marqui, Lehmann, Koenig, Kochi, Merlo and Hell9 In particular, the conductivity of the skull creates a smearing effect such that the brain signals picked up by the electrodes are not necessarily from nearby generators. It may also be because both distributed and focal slow-wave activity contributes to EEG sensor activity and that, as a result, the location of the EEG reference electrode is an important factor in interpreting slow-wave scalp activity.
MEG offers a reference-free method for assessing electromagnetic slow-wave activity that is not distorted by changes in conductivity across brain tissues. Reference Cuffin and Cohen25 MEG has identified cortical generators of slow-wave activity in schizophrenia using single-dipole source localisation. Reference Fehr, Kissler, Moratti, Wienbruch, Rockstroh and Elbert2,Reference Canive, Lewine, Edgar, Davis, Miller and Torres7,Reference Weinberger8,Reference Wienbruch, Moratti, Elbert, Vogel, Fehr and Kissler12,Reference Galderisi, Mucci, Volpe and Boutros13,Reference Fernandez, Maestu, Amo, Gil, Fehr and Wienbruch18,Reference Rockstroh, Wienbruch, Ray and Elbert21,Reference Fehr, Kissler, Wienbruch, Moratti, Elbert and Watzl24,Reference de Jongh, de Munck, Baayen, Jonkman, Heethaar and van Dijk26–Reference Sperling, Vieth, Martus, Demling and Barocka29 To our knowledge, only one MEG study has examined slow-wave activity at rest throughout the brain in schizophrenia. Using L2-minimum norm estimate localisation, Fehr et al Reference Fehr, Kissler, Moratti, Wienbruch, Rockstroh and Elbert2 observed higher fronto-temporal and posterior delta/theta activity in participants with schizophrenia compared with controls. The present study sought to replicate this whole-brain study, examining slow-wave abnormalities in schizophrenia using a newly developed distributed source modelling method, frequency-domain VEctor-based Spatio-Temporal analysis using L1-minimum norm (VESTAL). Reference Huang, Nichols, Robb, Angeles, Drake and Holland17,Reference Huang, Theilmann, Robb, Angeles, Nichols and Drake30 VESTAL has the advantage over other distributed source models in that VESTAL requires no predetermination of number of sources, can model dipolar and non-dipolar sources, and can distinguish 100% temporally correlated sources.
Regarding the clinical significance of slowing, previous studies have reported a variety of findings. Using MEG, Fehr et al Reference Fehr, Kissler, Wienbruch, Moratti, Elbert and Watzl24 reported that temporal delta dipole density positively correlated with negative symptoms, and Rockstroh et al Reference Rockstroh, Wienbruch, Ray and Elbert21 observed that individuals with schizophrenia with more affective flattening and less depression displayed more frontocentral slowing. Similar associations between delta and theta slow-wave activity and negative symptoms have also been reported in EEG studies. Reference Gattaz, Mayer, Ziegler, Platz and Gasser31 Another study, however, observed findings in the opposite direction, with associations between increased delta activity in frontal, inferior temporal and parahippocampal gyrus in schizophrenia and fewer negative symptoms. Reference Itoh, Sumiyoshi, Higuchi, Suzuki and Kawasaki32 Finally, other studies have reported associations between slowing and positive symptoms. Sperling et al Reference Sperling, Martus, Kober, Bleich and Kornhuber28 and Wienbruch et al Reference Wienbruch, Moratti, Elbert, Vogel, Fehr and Kissler12 showed associations between delta dipole densities in temporoparietal regions and positive symptoms, and Fehr et al Reference Fehr, Kissler, Moratti, Wienbruch, Rockstroh and Elbert2 showed that frontal delta and theta activity was associated with positive symptoms (as noted in the Discussion, variability in findings across studies may reflect differences in patient samples). Based on the above, in addition to using VESTAL to identify the location of slowing in schizophrenia, the present study sought to better understand the functional consequences of abnormal slow-wave activity in schizophrenia. Given that the meta-analysis of Boutros et al Reference Boutros, Arfken, Galderisi, Warrick, Pratt and Iacono33 showed that EEG low-frequency oscillatory abnormalities in schizophrenia are primarily localised to frontal regions and that increased frontal low-frequency EEG power is a unique endophenotype for schizophrenia, Reference Narayanan, O'Neil, Berwise, Stevens, Calhoun and Clementz6,Reference Venables, Bernat and Sponheim22 and given that dysfunction in frontal regions is associated with impairments in attention Reference Laufs, Krakow, Sterzer, Eger, Beyerle and Salek-Haddadi34 as well as negative symptoms, Reference Weinberger8,Reference Lisman20,Reference Sekimoto, Kato, Watanabe, Kajimura and Takahashi35 it was hypothesised that increased slowing would be associated with poorer performance on tests of attention and with more severe negative symptoms. Since negative symptoms and cognitive impairments are associated with poor functional outcome in schizophrenia, Reference Greenwood, Landau and Wykes36 associations between slowing and measures of functional capacity were also evaluated. Support for this hypothesis would show that slowing is associated with poorer function and thus is perhaps a target for treatment.
Method
Participants
A total of 41 patients with chronic schizophrenia (34 men, mean age 37.63 years (s.d. = 12.09)) and 37 age-matched controls (27 men; mean age 38.92 years (s.d. = 11.13)) were recruited. Recruitment procedures and inclusion and exclusion criteria for schizophrenia were: (a) diagnosis of schizophrenia with no other Axis I diagnosis, determined by Structured Clinical Interview for DSM-IV Axis I disorders (SCID-I); Reference First, Spitzer, Gibbon and William37 (b) stable, continuous treatment with antipsychotic medication for at least 3 months; (c) no history of substance dependence in the past 3 years; (d) no history of alcohol or other substance misuse in the past 3 months; (e) no history of head injury with loss of consciousness for more than 5 min; and (f) no psychiatric hospital admissions in the past 3 months. Selection criteria for the control group were: (a) no history of Axis I psychiatric dysfunction; (b) no history of substance dependence in the past 3 years; (c) no history of alcohol or other substance misuse in the past 3 months; (d) no family history of a psychotic disorder in first-degree relatives by self-report; and (e) no history of head injury with loss of consciousness for more than 5 min or other neurological disease. As shown in Table 1, groups did not differ in age, parental socioeconomic status (SES, based on education and occupation information Reference Oakes and Rossi38 ) or general cognition (IQ estimate from Shipley Institute of Living Scale Reference Zachary39 ). The schizophrenia groups' SES and education were significantly lower than the controls groups' (SES missing for five participants in the control group and six in the schizophrenia group, and data on parental SES missing for six in the control group and six in the schizophrenia group). Two people in the schizophrenia group and four in the control group were left-handed as assessed by the Waterloo Handedness Questionnaire. Reference Bryden40 Twelve participants in the schizophrenia group and eight in the control group were smokers. Before the study, the nature of the study was explained to all participants and written consent was obtained. The study was approved by the Human Subjects Institutional Review Boards at the Raymond G. Murphy Veterans Affairs Medical Center (VAMC) and the Human Research Review Committee (HRRC) at the University of New Mexico School of Medicine.
Table 1 Demographic information
| Control group (n = 37) |
Schizophrenia group (n = 41) |
Group differences | |||
|---|---|---|---|---|---|
| t (d.f.) | χ2 | P | |||
| Age, mean (s.d.) | 38.92 (11.13) | 37.63 (12.09) | 0.49 (76) | 0.63 | |
| Gender, male: n | 27 | 34 | 1.13 | 0.29 | |
| Education, years: mean (s.d.) | 14.12 (1.06) | 13.05 (2.22) | 2.65 (74) | 0.01 | |
| Socioeconomic status, mean (s.d.) | 52.47 (16.13) | 65.91 (10.42) | −4.09 (65) | <0.001 | |
| Parental socioeconomic status, mean (s.d.) | 42.97 (17.39) | 46.74 (19.27) | −0.83 (64) | 0.41 | |
| IQ, mean (s.d.) | 98.39 (11.04) | 94.16 (13.10) | 1.49 (71) | 0.14 | |
In the schizophrenia group, 31 participants were treated with second-generation antipsychotics and 5 were treated with the first-generation antipsychotic haloperidol. Two participants were treated with a combination of first- and second-generation antipsychotics. One patient was not on antipsychotic medication but was stable. Each participant's antipsychotic medication dosage was converted to olanzapine equivalent dosage (average dosage 57.22 mg/day, dosage missing for two participants).
Clinical symptoms, attention and assessment of functional capacity
The participants with schizophrenia were administered the Positive and Negative Syndrome Scale (PANSS) Reference Kay, Fiszbein and Opler41 within a week of MEG recording. PANSS scores were not available for five participants. Possible PANSS Positive (PANSS-P) and Negative (PANSS-N) scale scores range from a minimum of 3 (no impairment) to a maximum of 49 (severe impairment). The mean PANSS-P total score was 17.72 (range 7–32) and the mean PANSS-N total score was 15.53 (range 9–22). To assess attention, all participants were administered the Trail Making Test A Reference Reitan and Davidson42 and the Conners' Continuous Performance Test II Clinical Confidence Index (CPT-CCI). Reference Conners43 The CPT-CCI indicates closeness to a clinical or non-clinical profile. For example, a CPT-CCI score of 75 indicates a 75% confidence that the individual belongs to a clinical population. To assess functional capacity with regard to independent living and employment, all participants were administered the Brief University of California San Diego Performance-based Skills Assessment (UPSA-B). Reference Mausbach, Harvey, Goldman, Jeste and Patterson44 The sum score of the two UPSA-B subscales (communication and financial ability) was used. The range on the UPSA-B communication subscale was 4–9 for the control group and 3–9 for the schizophrenia group. The range on the UPSA-B financial subscale was 6–10 for the control group and 2–10 for the schizophrenia group. Although groups did not differ in IQ, the schizophrenia group performed more poorly on all tests of attention and functional capacity (P's<0.001).
MEG and MRI data acquisition and coregistration
The MEG data were recorded using a 306-channel Vector-View system (Elekta-Neuromag, Helsinki, Finland) that uses planar-gradiometer and magnetometer sensors with a sampling rate of 1000 Hz and a band-pass of 0.1–330 Hz. Electro-oculograms (EOGs) (vertical EOG on the upper and lower left sides) and electrocardiograms (ECGs) (at the clavicles) were also obtained. The participant's head position was monitored using four head position indicator (HPI) coils attached to the scalp. Five minutes of spontaneous MEG data were collected while the participant rested with their eyes closed.
After the MEG session, sMRI provided T 1-weighted, 3-D anatomical images using a 3T Siemens Trio scanner (voxel size 111 mm3). To coregister MEG and sMRI data, three anatomical landmarks (nasion and right and left preauriculars) as well as an additional 200+ points on the scalp and face were digitised for each participant using the Probe Position Identification (PPI) System (Polhemus, Colchester, VT). The three fiducials were identified in the participant's sMRI, and a transformation matrix that involved rotation and translation between the MEG and sMRI coordinate systems was obtained via a least-squares fit of the PPI measurements to the surfaces of the scalp and face from the sMRI.
Frequency-domain VESTAL source imaging for oscillatory MEG signal
The MEG data were first processed with signal space separation (SSS) Reference Taulu, Kajola and Simola45,Reference Song, Cui, Gaa, Feffer, Taulu and Lee46 using Maxfilter (Elekta MaxfilterTM; Elekta Oy). SSS separates neuronal magnetic signals arising from inside the MEG sensor array from external magnetic signals arising from the surrounding environment to reduce environmental noise and artefacts. After SSS, MEG data were visually inspected for muscle and eye-blink artefact and segments with artefact removed. The amount of data eliminated by visual inspection was 35% for the control group and 39% for the schizophrenia group. Groups did not differ in the amount of artefact-free data (t(76) = 1.27, P = 0.21). A participant-specific realistic boundary element method (BEM) head model was used for MEG forward calculation. Reference Huang, Song, Hagler, Podgorny, Jousmaki and Cui47 The BEM mesh was constructed by tessellating the inner skull surface from the T 1-weighted MRI into ∼6000 triangular elements with ∼5 mm size. Cubic source grid with 5 mm size was used for calculating the MEG gain (i.e. lead-field) matrix, which produced a grid with ∼7000 nodes covering the cortical and subcortical grey matter of the whole brain.
Eyes-closed data were filtered to examine delta (1–4 Hz) and theta activity (4–7 Hz). A frequency-domain band-pass filter with zero phase shift via discrete Fourier transform was used. At each end of the band-pass filter, the transition of the Hanning window in the filter was selected to be at 10% of the associated cut-off frequency. The MEG data were divided into 2.5 s epochs with 50% overlap. The sensor-space frequency-domain data were submitted to frequency-domain VESTAL to obtain the source amplitude (root mean squared) MEG low-frequency source images. In this approach, a fast Fourier transform (FFT) was first performed for each epoch. This step transferred the time-domain MEG sensor-waveform signal into frequency-domain Fourier coefficients for different frequency bins within the delta and theta bands. Next, L1 minimum-norm based frequency-domain VESTAL analysis was performed to obtain MEG source images for the real and imaginary part of the Fourier coefficients separately. Reference Huang, Nichols, Robb, Angeles, Drake and Holland17 The frequency-domain source power for each grid node was obtained by summing the power from the real and imaginary parts across all frequency bins within each band. The above procedure was repeated for each epoch, and the mean source power across all epochs was obtained for each grid node. The outcome of frequency-domain VESTAL analysis was a set of MEG source power images used in the group analysis. Reference Huang, Nichols, Robb, Angeles, Drake and Holland17
Group statistics of VESTAL solution
The frequency-domain VESTAL source grid was obtained by sampling grey-matter areas from the T 1-weighted MRI of each participant. VESTAL source images for delta and theta were registered to Montreal Neurological Institute (MNI) space using an affine transformation (FLIRT–FMRIB's Linear Image Registration Tool) in FSL (www.fmrib.ox.ac.uk/fsl/). To examine group differences in delta and theta activity throughout the brain, between-group t-tests compared delta and theta activity in VESTAL source images.
Correlations examined associations between delta and theta activity and measures of function. To reduce the number of correlations, analyses examining associations between slow-wave activity and measures of function were examined only in areas where group differences in slow-wave activity were observed, summing activity across voxels in regions of interest (ROI) identified in the VESTAL group difference maps. Correlations were computed separately between theta and delta activity at each ROI and (a) clinical symptoms: PANSS-N scores; (b) attention: CPT-CCI and Trail A completion time; and (c) functional capacity: UPSA-B sum score. For all whole-brain analyses the cluster size needed to obtain a family-wise correction was determined using AFNI AlphaSim (B. Douglas Ward, 2000; http://afni.nimh.gov/pub/dist/doc/manual/AlphaSim.pdf).
Results
Slow-wave activity
At no location was theta or delta activity greater in the control group than in the schizophrenia group. For both frequencies, the schizophrenia group had more slow-wave activity than the control group in temporoparietal regions (supramarginal gyrus, angular gyrus, planum temporale and middle temporal gyrus) and frontal regions (frontal pole, inferior frontal gyrus and middle frontal gyrus) (P<0.05, uncorrected). Although group differences were observed in both hemispheres, after applying cluster-thresholded family-wise correction (>6339 voxels for delta and >6171 voxels for theta), as shown in Fig. 1 (in MNI coordinates) group differences were observed only in the right hemisphere for both frequency bands. Even though participants with current substance or alcohol misuse/dependence were excluded from participation in this study, analyses were re-run removing participants who had ever been treated for substance or alcohol misuse/dependence (i.e. treatment more than 3 years prior to enrolment in this study). The group differences remained significant. All analyses below, although reported for the full sample, were also re-run excluding individuals who had ever been treated for substance or alcohol misuse/dependence (i.e. treatment more than 3 years prior to enrolment in this study). In all cases but one, findings remained the same, and relationships were generally stronger with these participants excluded. For example, the relationship between delta frontal slowing and negative symptoms became stronger, with an R 2 increase from 0.19 to 0.25. A significant association became marginally significant in only one analysis. Increased antipsychotic dosage (i.e. olanzapine equivalent dosage) was associated with decreased right temporoparietal theta activity (R 2 = 0.18, P = 0.01). No association was observed between medication dosage and delta activity.

Fig. 1 Between-group VEctor-based Spatio-Temporal analysis using L1-minimum norm (VESTAL) analyses for theta and delta.
Clusters in yellow/red show more right-hemisphere slow-wave activity in the schizophrenia group than in the control group (P<0.05, family-wise corrected).
Slow-wave activity and schizophrenia symptoms
Based on the group difference findings, measures of delta and theta activity in two ROIs were obtained: a right temporoparietal ROI and a right-frontal ROI (Fig. 1). For the 37 patients whose symptom ratings were available, 3 participants were excluded as theta and delta univariate outliers, defined as individuals more than 3 standard deviations from the group mean. Although the pattern of findings was unchanged, and in many cases P-values showed more significance with outliers included, the outliers were excluded as a conservative approach. As shown in Fig. 2, right-frontal delta activity explained 19% of the variance in PANSS-N scores (R 2 = 0.19, P = 0.01). No relationships were observed for theta activity and PANSS-N scores. To examine the specificity of the PANSS-N findings, exploratory analyses examined associations with PANSS-P scores. No relationship with PANSS-P scores was observed at either frequency or either ROI (R 2's<0.02).
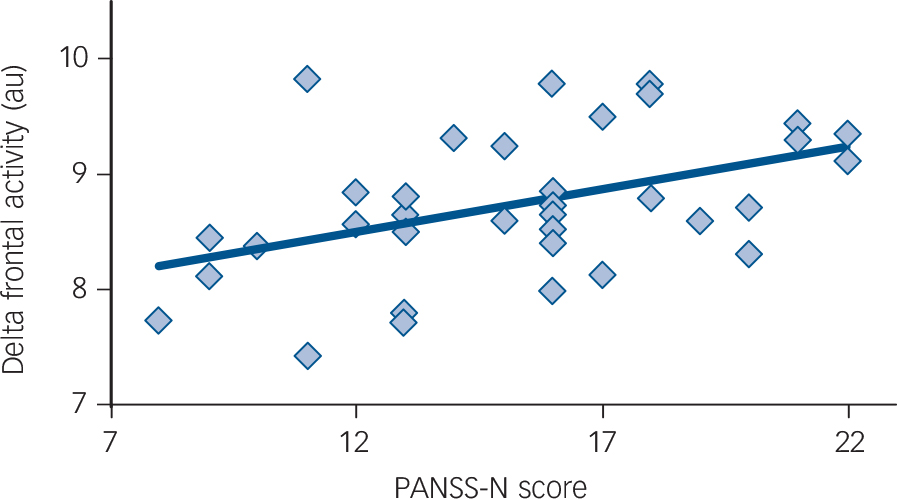
Fig. 2 Association between right-frontal delta and negative symptoms (on the Positive and Negative Syndrome Scale – negative scale score (PANSS-N)) in schizophrenia (R 2 = 0.19, P = 0.01). au, arbitrary units.
The right-frontal delta and PANSS-N associations remained significant after removing variance associated with age (R 2 = 0.20, P = 0.01). Of note, the association between age and slowing was not significant (R 2 = 0.02, P = 0.20), indicating that slowing was not greater in older participants. Finally, no relationship was observed between antipsychotic dosage and PANSS scores (R 2's<0.02). Associations between right-frontal delta and PANSS-N scores remained unchanged after removing variance associated with medication dosage.
Slow-wave activity and predictors of cognition and functional capacity
Hierarchical regressions examined associations between slowing and attention. To determine whether associations were specific to attention, regressions were run with the IQ estimate entered first, group second, performance on the attention test third (separate analyses for CPT-CCI and Trail A completion time) and the group×attention interaction term last (outliers with high slowing again removed). Lower IQ scores were associated with increased right-frontal delta slowing in the total sample, F(1,65) = 5.63, R 2 = 0.08, P = 0.02. After removing variance associated with IQ, group differences in right-frontal delta slowing remained, F(1,64) = 4.60, P = 0.04. After removing variance associated with IQ and group, impaired attention (higher CPT-CCI) was associated with greater right-frontal delta slowing, F(1,63) = 3.94, R 2 change 0.05, P = 0.05. The group×attention interaction was not significant, indicating the same association in the two groups (P = 0.55). No relationships were observed for Trail A completion time.
Hierarchical regressions next examined associations between slowing and functional capacity, with UPSA-B scores entered first, group second and the group×UPSA-B interaction term last. Poorer UPSA-B scores were associated with increased right-frontal delta slowing in the total sample, F(1,62) = 3.98, R 2 = 0.06, P = 0.05. No relationships were observed with theta activity.
Strongest predictors of slow-wave activity
Given associations only with right-frontal delta, stepwise regression analyses with PANSS-N, IQ, CPT-CCI and UPSA-B determined the functional measure(s) that best predicted right-frontal delta slowing in schizophrenia (given no PANSS-N measures in the control group, this first analysis was conducted only for the schizophrenia group). Stepwise analyses (probability of F-to-enter P<0.05, probability of F-to-remove P>0.10) indicated that PANSS-N scores accounted for the most unique variance in right-frontal delta activity in the schizophrenia group (R 2 = 0.24, P = 0.01). After removing the variance associated with PANSS-N, no other variable explained unique variance. Partial correlations showed that PANSS-N remained associated with right-frontal delta (R 2 = 0.20, P = 0.03) even after removing variance in these two measures associated with PANSS-P, IQ, CPT-CCI and UPSA-B, indicating a unique relationship between PANSS-N and right-frontal delta slowing. Zero-order correlations showed no relationship between PANSS-N, IQ, CPT-CCI and UPSA-B. Steiger's Z Reference Steiger48 (z = 2.05, P = 0.04) confirmed that the correlation between slowing and PANSS-N scores (r = 0.43) was significantly larger than the correlation between slowing and PANSS-P scores (r = 0.05), demonstrating that right-frontal delta slowing was associated with negative but not positive symptoms. Finally, even though no relationship was observed between theta slowing and negative symptoms, Steiger's Z Reference Steiger48 comparing the correlation between right-frontal delta slowing and PANSS-N scores (r = 0.43) and the correlation between right-frontal theta slowing and PANSS-N scores (r = 0.15) showed no difference (z = 1.27, P = 0.21), indicating that associations with PANSS-N scores were similar for theta and delta.
Given no significant interaction terms in any of the hierarchical regressions, analogous stepwise analyses were run for the total sample excluding the PANSS-N scores. In the full sample, stepwise analyses indicated that CPT-CCI (R 2 = 0.14, P = 0.003) and IQ (R 2 change 0.08, P = 0.02) explained unique variance in right-frontal delta activity.
Discussion
Increased slow-wave activity in schizophrenia
Study findings showed frontal slowing in participants with schizophrenia and showed that slowing is association with negative symptoms and functional outcome. Present findings suggest that treatment-associated decreases in slowing could be accompanied by improved functional outcome and thus also suggest frontal slowing as a potential treatment outcome measure. As hypothesised and replicating previous findings, Reference Fehr, Kissler, Moratti, Wienbruch, Rockstroh and Elbert2,Reference Wienbruch, Moratti, Elbert, Vogel, Fehr and Kissler12,Reference Rockstroh, Wienbruch, Ray and Elbert21,Reference Fehr, Kissler, Wienbruch, Moratti, Elbert and Watzl24,Reference Itoh, Sumiyoshi, Higuchi, Suzuki and Kawasaki32 increased delta and theta slowing in individuals with schizophrenia was observed in frontal and temporoparietal regions. Studies examining slow-wave activity suggest a detrimental effect of enhanced delta and theta activity at rest. For example, there is an inverse relationship between spontaneous slow-wave oscillations and task-relevant oscillations, with increased low-frequency oscillatory power at rest associated with reduced post-stimulus power Reference Sponheim, Clementz, Iacono and Beiser49 as well as delayed evoked auditory latencies. Reference Edgar, Khan, Blaskey, Chow, Rey and Gaetz50 Yordanova & Kolev Reference Yordanova and Kolev51 suggested that during childhood development the ability to attend to stimuli increases as spontaneous low-frequency oscillations decrease and the amplitude of event-related low-frequency oscillations increases. In people with schizophrenia, Kirino et al Reference Kirino52 found an association between increased frontal delta and theta activity at rest and decreased mismatch negativity. All the above are in line with the conclusion of Bates et al Reference Bates, Kiehl, Laurens and Liddle53 that baseline low-frequency neural impairments in schizophrenia diminish the ability to coordinate neural circuits during information-processing tasks. As detailed below, present findings support this view, showing that abnormal slowing in schizophrenia is of clinical interest, predicting symptom severity and cognitive impairments.
Associations between slowing, clinical symptoms, cognition and functional capacity
Increased right-frontal delta slowing was associated with negative symptom, attention and functional capacity impairments. Present findings thus support previous findings Reference Narayanan, O'Neil, Berwise, Stevens, Calhoun and Clementz6,Reference Sponheim, Clementz, Iacono and Beiser49,Reference Ferrarelli, Sarasso, Guller, Riedner, Peterson and Bellesi54 as well as the meta-analysis by Boutros et al Reference Boutros, Arfken, Galderisi, Warrick, Pratt and Iacono33 suggesting that abnormally elevated resting frontal delta is a strong schizophrenia biological correlate, predicting cognitive performance and occupational function in schizophrenia. Stepwise regression and partial correlation analyses indicated that PANSS negative symptoms were the best predictor of slowing and also predicted unique variance in slowing (i.e. after removing variance in slowing associated with the other measures of function).
The overall pattern of the present results is in line with the notion of frontal lobe pathology in people with schizophrenia affecting multiple domains. For example, symptoms such as poor initiative, social withdrawal and impaired attention are similar to the symptoms observed in patients with frontal-lobe disease. Reference Weinberger8 Functional imaging studies often report reduced prefrontal activity in schizophrenia during cognitive tasks. Itoh et al Reference Itoh, Sumiyoshi, Higuchi, Suzuki and Kawasaki32 suggested that frontal-lobe dysfunction has a role in attention deficits and negative symptoms. Reference Weinberger8,Reference Sekimoto, Kato, Watanabe, Kajimura and Takahashi35 Lisman Reference Lisman20 hypothesised that an abnormal balance between excitatory and inhibitory synapses in the frontal lobe could cause cognitive deficits and negative symptoms in schizophrenia. This hypothesis is supported by electrophysiological studies showing associations between frontal EEG slowing and negative symptoms. Reference Winterer, Ziller, Dorn, Frick, Mulert and Wuebben5 In this context, increased frontal delta activity may contribute to neural network dysfunction and thus to negative symptoms and cognitive impairment in schizophrenia.
Some studies have found associations between negative symptoms and IQ and attention, with some researchers arguing that individuals with schizophrenia showing the greatest cognitive impairment have the most prominent negative symptoms. Reference Ventura, Hellemann, Thames, Koellner and Nuechterlein55 Others, however, have argued that IQ is not associated with negative symptoms. Reference Simon, Giacomini, Ferrero and Mohr56–Reference Bozikas, Kosmidis, Anezoulaki, Giannakou and Karavatos58 For example, Meyer et al Reference Meyer, Carrion, Cornblatt, Addington, Cadenhead and Cannon59 showed that although there is modest overlap among cognitive symptoms, negative symptoms and social function, these domains make unique contributions in high-risk individuals. The present analysis showed that, even though attention and IQ are associated with frontal slowing, the IQ and attention relationship is not significant after removing variance associated with negative symptoms. Given that zero-order correlations showed no relationship between negative symptoms, IQ and attention, this suggested that the relationship between frontal slowing and other cognitive measures (IQ and attention) is partially mediated by negative symptoms. This is consistent with literature showing that negative symptoms might mediate relationships between cognition and schizophrenia functional outcome. Reference Ventura, Hellemann, Thames, Koellner and Nuechterlein55
In the present study, the associations between temporoparietal theta slowing and olanzapine dosage perhaps indicates that frontal slowing is more similar to a trait measure and temporoparietal slowing more similar to a state measure. Along these lines, whereas antipsychotics ameliorate positive symptoms (PANSS-P scores generally low in the present sample), following antipsychotic treatment patients continue to show pervasive negative symptoms and deficits in cognitive function, symptoms that best predict a patient's future social and occupational performance. Reference Green60 This perhaps is the reason why in the present study a relationship was observed between delta slowing and negative but not positive symptoms.
The present association between delta slowing and negative symptoms is consistent with Fehr et al Reference Fehr, Kissler, Wienbruch, Moratti, Elbert and Watzl24 and in line with studies indicating that slowing is more pronounced in patients with dominating negative symptoms than in those with dominating positive symptoms. Reference Gross, Joutsiniemi, Rimon and Appelberg61,Reference Saletu, Kufferle, Anderer, Grunberger and Steinberger62 The above may also, in part, explain study differences between slowing and schizophrenia symptoms. For example, the relationship between slowing and positive symptoms reported in Fehr et al Reference Fehr, Kissler, Moratti, Wienbruch, Rockstroh and Elbert2 and Wienbruch et al Reference Wienbruch, Moratti, Elbert, Vogel, Fehr and Kissler12 could be because these participants were in-patients and thus more likely to be acutely ill and thus have more positive symptoms. Participants in the present study were out-patients with chronic schizophrenia with primarily negative symptoms, perhaps resulting in absent associations between slowing and positive symptoms. Slowing may also be a risk factor or an endophenotype, as studies have shown that slowing is observed in people with schizophrenia and their relatives Reference Venables, Bernat and Sponheim22,Reference Hong, Summerfelt, Mitchell, O'Donnell and Thaker63 during resting state as well as during tasks, leading to the conclusion that slowing appears to be a heritable risk factor/trait for schizophrenia. Reference Venables, Bernat and Sponheim22,Reference Boutros, Arfken, Galderisi, Warrick, Pratt and Iacono33,Reference Hong, Summerfelt, Mitchell, O'Donnell and Thaker63 Finally, the association between temporoparietal theta slowing and antipsychotic dosage observed in the present study suggests that antipsychotic medication modulates slowing. There is additional evidence to support this conclusion. For example, Canive et al Reference Canive, Lewine, Edgar, Davis, Miller and Torres7 showed more slowing in schizophrenia at the end of a 10-day washout than during 8-week treatment with novel antipsychotics, with some evidence in that small sample that decreased slowing was associated with improved positive symptoms.
It is of note that low-frequency abnormalities in schizophrenia are not specific to the resting state and are observed in evoked studies. For example, EEG studies have shown that early auditory abnormalities in schizophrenia are best characterised by decreased phase-locking in schizophrenia. Reference Edgar, Hanlon, Huang, Weisend, Thoma and Carpenter1,Reference Blumenfeld and Clementz64–Reference Popov, Jordanov, Weisz, Elbert, Rockstroh and Miller68 Hong et al Reference Hong, Summerfelt, Mitchell, O'Donnell and Thaker63 also showed that elevated resting low-frequency activity was associated with decreased suppression of low-frequency activity in an auditory paired-click task. Examining auditory activity using MEG, Edgar et al Reference Edgar, Chen, Lanza, Howell, Chow and Heiken69 observed greater left superior temporal gyrus pre-stimulus ∼4 to 20 Hz power in participants with schizophrenia than in healthy controls. These and other studies indicate that low-frequency oscillatory abnormalities appear to be a primary abnormality in schizophrenia, observed at rest as well as during tasks. Finally, it is of note that in the present study increased right-frontal delta slowing predicted poorer performance on attention and functional-capacity measures in individuals with schizophrenia as well as in controls (i.e. no significant interactions involving group), thus suggesting that MEG slowing is a sensitive, general measure of frontal brain dysfunction.
Future directions
Present findings showed increased right-frontal and temporoparietal slowing in people with schizophrenia, with right-frontal delta slowing associated with negative symptoms and cognitive performance. These findings (in a predominantly medicated sample) suggest that future studies should consider treatments that target slowing in an attempt to modulate functional outcome. Future studies examining associations between slowing and grey matter, white-matter fibre pathways and blood flow are of interest to better understand the structural abnormalities associated with slowing in schizophrenia. Finally, studies examining functional connectivity between regions of slowing (i.e. areas with pathology) and functionally connected areas are of interest to further identify the functional consequences of regional slowing in schizophrenia.


eLetters
No eLetters have been published for this article.