


Neuropsychological deficits are consistently reported in patients with bipolar disorder, Reference Arts, Jabben, Krabbendam and van Os1–Reference Olvet, Burdick and Cornblatt3 and to a lesser extent, or less consistently, in their unaffected relatives, including parents, offspring, singleton siblings and co-twins. Reference Arts, Jabben, Krabbendam and van Os1–Reference Juselius, Kieseppa, Kaprio, Lonnqvist and Tuulio-Henriksson10 Neuropsychological deficits seem to mostly affect aspects of verbal recall and learning, processing speed, working and facial memory, selective attention and response inhibition. Reference Arts, Jabben, Krabbendam and van Os1–Reference Kravariti, Kane, Murray and Ritsner11 Heritable phenotypes, such as several neuropsychological functions, Reference Light, Greenwood, Swerdlow, Calkins, Freedman and Green12 which show deficits both in individuals with a clinical disorder and in their healthy family members, are known as ‘endophenotypes’. Reference Kendler and Neale13 Endophenotypes are proposed to lie in the aetiological pathway between susceptibility genes and clinical illness, and have attracted research interest for their potential to help unravel the genetic architecture, aetiology and pathophysiology of psychiatric disorders. Reference Light, Greenwood, Swerdlow, Calkins, Freedman and Green12–Reference Tamminga, Pearlson, Keshavan, Sweeney, Clementz and Thaker14
Twin studies employing structural equation modelling (SEM) techniques offer a robust strategy for identifying and validating endophenotypes. Reference Hall, Rijsdijk, Picchioni, Schulze, Ettinger and Toulopoulou15 However, with the exception of a large study of multigenerational families multiply affected with bipolar disorder, Reference Glahn, Almasy, Barguil, Hare, Peralta and Kent4 the existing twin and family studies have lacked statistical power to take advantage of sophisticated genetic modelling approaches. As a result, the emerging picture is largely inconclusive. Reference Olvet, Burdick and Cornblatt3,Reference Kravariti, Kane, Murray and Ritsner11 We report on the first study to combine the methodological strengths of a twin and sibling pair design, critically enhanced by the use of advanced SEM techniques, to estimate the heritabilities of different aspects of intelligence, memory and executive function, quantify their relationship with bipolar disorder, and examine their genetic and environmental overlap with the disorder. SEM is considered an advanced approach compared with conventional analytic strategies, because it enables quantifying the genetic and environmental sources of covariance between the disorder and putative endophenotypes, rather than inferring the effects of the latter based on means comparisons (for example across monozygotic (MZ) affected twins, MZ unaffected co-twins, dizygotic (DZ) affected twins, DZ unaffected co-twins and controls). Based on earlier findings, Reference Arts, Jabben, Krabbendam and van Os1–Reference Kravariti, Kane, Murray and Ritsner11 we hypothesised that verbal recall and learning, visual processing speed and spatial working memory would show statistically significant phenotypic and genetic correlations with bipolar disorder.
Method
Participants
The analytic cohort comprised 331 participants, including the full sample of the Twin Study of Bipolar Disorder at the Institute of Psychiatry, Psychology and Neuroscience (IoPPN) in London Reference Kravariti, Schulze, Kane, Kalidindi, Bramon and Walshe9 (128 complete twin pairs: 15 concordant for bipolar or schizoaffective disorder–bipolar type, 36 discordant for bipolar disorder, 77 control pairs; and 2 bipolar disorder/1 control twin(s) with no participating co-twins), as well as 36 sibling pairs (12 discordant for bipolar disorder and 24 control pairs) drawn from the participant pool of the Maudsley Family Study of Bipolar Disorder. Reference Schulze, Walshe, Stahl, Hall, Kravariti and Morris16,Reference McDonald, Bullmore, Sham, Chitnis, Wickham and Bramon17 The participants were recruited from national health services throughout the UK, service user-led bipolar disorder organisations, the Volunteer Twin Register at the IoPPN and through local/national press advertisements. To minimise potential differences in the family environment, only same-gender DZ co-twins/siblings were included in the study, and an effort was made to include siblings of similar ages. Exclusion criteria were a first language other than English, age younger than 16 years/older than 67 years, IQ <70, a history of any disorder with known neurological symptoms or complications, and a history of head injury resulting in loss of consciousness for more than 10 min. The control participants were additionally free of personal and family histories, up to second-degree relatives, of bipolar and psychotic spectrum disorders. Other psychiatric pathology was not an exclusion criterion for any of the study groups. No participant was acutely ill. The study was approved by the ethical committee of the IoPPN, King's College London. After complete description of the study to the participants, written informed consent was obtained. The participants' zygosity, demographic and clinical characteristics are presented in Table 1. For ease of reference, in the remainder of the paper we refer to twins and siblings who have no personal history of bipolar or psychotic-spectrum disorders, but who have a co-twin or same-gender sibling with bipolar or schizoaffective disorder–bipolar type, as ‘non-bipolar disorder co-twins/siblings’.
Table 1 Zygosity, demographic and clinical characteristics of the study participants
| Participants from twin and sibling pairs affected with bipolar/schizoaffective disorder | ||||||
|---|---|---|---|---|---|---|
| Case participants (n = 80) | Non-bipolar disorder participants a (n = 48) | Control twins and siblings (n = 203) | ||||
| From 15 concordant pairs (n = 30) |
From 48 discordant pairs (n = 48) |
With no participating co-twin (n = 2) |
From 48 discordant pairs (n = 48) |
From 101 pairs (n = 202) |
With no participating co-twin (n = 1) |
|
| Zygosity/sibship, n (%) | ||||||
| Monozygotic twin | 28 (93.33) | 22 (45.83) | 0 (0.00) | 22 (45.83) | 104 (51.49) | 1 (100.00) |
| Dizygotic twin | 2 (6.67) | 14 (29.17) | 2 (100.00) | 14 (29.17) | 50 (24.75) | 0 (0.00) |
| Sibling | 0 (0.00) | 12 (25.00) | 0 (0.00) | 12 (25.00) | 48 (23.76) | 0 (0.00) |
| Gender, n (%) | ||||||
| Men | 16 (53.33) | 12 (25.00) | 1 (50.00) | 12 (25.00) | 38 (18.81) | 1 (100.00) |
| Women | 14 (46.67) | 36 (75.00) | 1 (50.00) | 36 (75.00) | 164 (81.19) | 0 (0.00) |
| Ethnicity, n (%) | ||||||
| White | 28 (93.33) | 47 (97.92) | 2 (100.00) | 47 (97.92) | 194 (96.04) | 1 (100.00) |
| Other | 2 (6.67) | 1 (2.08) | 0 (0.00) | 1 (2.08) | 8 (3.96) | 0 (0.00) |
| Age, years: mean (s.d.) | 43.53 (14.42) | 42.38 (13.24) | 46.00 (0.00) | 42.52 (13.10) | 43.76 (12.32) | 56 (0.00) |
| Education, years: mean (s.d.) | 13.93 (2.97) | 15.08 (2.86) | 12.5 (0.71) | 15.44 (2.78) | 14.61 (2.66) | 13 (0.00) |
| DSM-IV diagnosis, n (%) | ||||||
| Bipolar I disorder | 28 (93.33) | 46 (95.83) | 2 (100.00) | 0 (0.00) | 0 (0.00) | 0 (0.00) |
| Bipolar II disorder | 0(0) | 2 (4.17) | 0 (0.00) | 0 (0.00) | 0 (0.00) | 0 (0.00) |
| Schizoaffective disorder | 2 (6.67) | 0 (0.00) | 0 (0.00) | 0 (0.00) | 0 (0.00) | 0 (0.00) |
| Age at onset, years: b mean (s.d.) | 20.07 (8.85) | 21.04 (9.4) | 25.5 (14.85) | n/a | n/a | n/a |
| History of psychosis, yes: n (%) | 22 (73.3) | 37 (77.1) | 0(0) | n/a | n/a | n/a |
| BDI score, mean (s.d.) | 11.43 (10.74) | 15.11 (11.21) | 19.5 (23.33) | 5.55 (7.34) | 3.55 (4.47) | 5 (0.00) |
| ASRM score, mean (s.d.) | 3.8 (3.91) | 4.17 (3.88) | 0.5 (0.71) | 2.70 (3.24) | 2.53 (3.25) | 3 (0.00) |
n/a, not applicable; BDI, Beck Depression Inventory (score ranges: 0–13, minimal; 14–19, mild; 20–28, moderate; 29–63, severe); ASRM, Altman Self-Rating Mania Scale (scores <6 indicate low and scores ⩾6 high, probability of manic or hypomanic symptoms).
a. Twins and siblings with no personal history of bipolar or psychotic spectrum disorders, but with a co-twin or same-gender sibling with bipolar or schizoaffective disorder.
b. Age at first affective/psychotic symptoms.
Assessment of zygosity
Zygosity was preliminarily ascertained on the basis of a twin questionnaire. The results of the questionnaire were confirmed by DNA analysis of blood or cheek swab samples. DNA analysis was based on a set of 18 highly polymorphic markers (consisting of between 5 and 15 alleles and a mix of di-, tri- and tetra-nucleotide microsatellites). The results from each twin pair were compared to look for matching genotypes/alleles and a statistic calculated to determine the probability of the pair being MZ or DZ.
Clinical assessment
All participants underwent extensive clinical evaluation. Diagnoses were based on structured clinical interviews using the Schedules for Clinical Assessment in Neuropsychiatry (SCAN 2.1), 18 the Structured Clinical Interview for DSM-IV Axis I Disorders (SCID-I) Reference First, Spitzer, Gibbon and Williams19 or the Schedule for Affective Disorders and Schizophrenia – Lifetime Version (SADS-L). Reference Endicott and Spitzer20 These were supplemented by information from medical notes (patients only). The Beck Depression Inventory (BDI) Reference Beck, Steer and Brown21 and the Altman Self-Rating Mania Scale (ASRM) Reference Altman, Hedeker, Peterson and Davis22 were administered on the day of testing to assess current mood (all participants). Medication status was recorded at the time of the assessment.
Neurocognitive assessment
Full-scale IQ was measured using the Wechsler Abbreviated Scale of Intelligence (WASI). Reference Wechsler23 Immediate recall and learning and delayed recall and recognition (aspects of episodic memory) were examined using the California Verbal Learning Test (CVLT-II). Reference Delis, Kramer, Kaplan and Ober24 Selected measures of the Cambridge Neuropsychological Test Automated Battery (CANTAB), 25 were used to assess set shifting (Intra-Extra Dimensional Set Shifting task (IED): total trials adjusted for number of stages completed), visual-spatial learning (Paired Associates Learning task (PAL): total trials adjusted for number of stages completed), visual recognition (Pattern Recognition Memory task (PRM): per cent correct and mean correct latency), spatial working memory (Spatial Working Memory task (SWM): between errors and strategy) and sustained attention/visual processing (Rapid Visual Processing task (RVP): signal detection measures A prime and B double prime; the former measures sensitivity to the target, and the latter the tendency to respond regardless of whether the target is present).
Twin and sibling model-fitting analysis
The differential correlation of MZ and DZ twin pairs (or siblings) is utilised to estimate the effects of latent genetic and environmental factors on the variation of a trait. This is accomplished by fitting a model to the data in which the variation within and covariation between twins/siblings is specified in terms of latent additive genetic effects (A), shared environmental effects (C), and non-shared (unique) environmental effects (E). The model is based on biometrical genetic theory, hypothesising the correlation between MZ twins to be the result of a 100% sharing of their genetic makeup and of everything else in the environment that makes them alike (C), and the correlation between DZ co-twins/siblings to be the result of ~50% sharing of genes and C. Reference Rijsdijk and Sham26 Non-twin siblings have the same expected correlations for A, C and E as DZ twins, although an extra twin-specific correlation as a result of, for example, same age is not inconceivable.
Bivariate twin and sibling modelling
The model above can be extended to a bivariate model. By using the differential MZ and DZ correlations across twins/siblings and across traits, the genetic (r g), shared environmental (r c) and unique environmental (r e) correlations between two traits (for example bipolar disorder and neurocognitive variable) are estimated. These estimates reflect the extent to which the same genetic, common environmental and unique environmental effects, respectively, influence bipolar disorder and neurocognition. It is further possible to combine the information from r g, r c and r e with the heritability, c 2 and e 2 of each trait to compute the genetic (r ph-a), common environmental (r ph-c) and unique environmental (r ph-e) contributions to the total phenotypic correlation (r ph) between two traits.
Model fitting was performed in the SEM program OpenMx, Reference Boker, Neale, Maes, Wilde, Spiegel and Brick27 using full information maximum likelihood estimation, where continuous (cognitive) and ordinal (affection status) measures were analysed jointly assuming a liability threshold model to reflect the risk for bipolar disorder. Reference Falconer28 The model incorporated the effects of age, gender and years of education as covariates. Since most, if not all, cognitive functioning is mediated by global intelligence, Reference Plomin29 IQ was not partialled out to avoid a loss of meaningful variation.
Ascertainment correction
As the study is based on twin/sibling pairs selected for bipolar disorder or schizoaffective disorder–bipolar type, as opposed to an unselected population-based sample, selection is accounted for by adjusting the bivariate genetic model. Reference Hall, Rijsdijk, Picchioni, Schulze, Ettinger and Toulopoulou15 This involved fixing all model parameters of the selection variable (bipolar disorder) to established (conservative) values reported from the literature (h 2 = 0.81, c 2 = 0.07, e 2 = 0.12) Reference McGuffin, Rijsdijk, Andrew, Sham, Katz and Cardno30 and the threshold on the liability to the population prevalence of 1%. Reference Hall, Rijsdijk, Picchioni, Schulze, Ettinger and Toulopoulou15,Reference Sherazi, McKeon, McDonough, Daly and Kennedy31 The parameters for the cognitive variables and the correlation paths with bipolar disorder were freely estimated. The significance of parameters (i.e. the fit of a submodel) is computed by likelihood ratio tests. More information on these models can be found in the articles by Rijsdijk and colleagues Reference Rijsdijk, van Haren, Picchioni, McDonald, Toulopoulou and Hulshoff Pol32 and Hall and colleagues. Reference Hall, Rijsdijk, Picchioni, Schulze, Ettinger and Toulopoulou15
Polychoric correlations
To estimate the MZ twin and DZ twin/sibling correlations for each cognitive variable and between each cognitive measure and bipolar disorder, we fitted a constrained correlational model to the MZ and DZ/sibling data to get: one within-twin/sibling cross-trait correlation (for example IQ with liability to bipolar disorder), which was equal across all participants regardless of zygosity and birth order; one MZ and one DZ/sibling cross-twin/sibling cross-trait correlation; and one MZ and one DZ/sibling cross-twin/sibling within-cognitive-measure correlation. In line with the correction for selection described above, the MZ and DZ/sibling cross-twin/sibling correlations for bipolar disorder were fixed to 0.88 (h 2 = 0.81 + c 2 = 0.07) and 0.475 (0.5h 2 = 0.405 + c 2 = 0.07) respectively.
Exploratory analysis: covarying for current mood state
Current mood state is known to have a significant impact on cognition. Reference Dixon, Kravariti, Frith, Murray and McGuire33 However, controlling for current depressive and hypomanic symptoms in the model-fitting analysis would introduce a significant risk of controlling for the bipolar diathesis itself, as affective symptoms can be an expression of the latter. Reference Miller and Chapman34 This argument is supported by our finding that depressive symptoms were highest in the two groups with the highest established and presumed genetic risk for bipolar disorder, i.e. individuals with a diagnosis of bipolar disorder and their MZ non-bipolar disorder co-twins (see Results). In addition, a substantial minority of non-bipolar disorder co-twins/siblings (35%; see Results) had lifetime diagnoses of unipolar depression, which shows substantial genetic correlations with mania. Reference McGuffin, Rijsdijk, Andrew, Sham, Katz and Cardno30 Therefore, controlling for current mood state would inadvertently result in controlling for part of the genetic variance for bipolar disorder. This, in turn, would artificially reduce the salience of bipolar disorder endophenotypes – unless, for example, such endophenotypes tapped into genetic variance shared between bipolar disorder and non-affective psychosis, as proposed by the psychosis continuum hypothesis. Reference Tamminga, Pearlson, Keshavan, Sweeney, Clementz and Thaker14,Reference Murray, Sham, Van Os, Zanelli, Cannon and McDonald35 Acknowledging the above limitations, we repeated the bivariate genetic model-fitting analysis for all emergent endophenotypes while covarying for affective symptoms. This elaboration was used as an exploratory approach to discriminating between endophenotypes tapping into genetic substrates of affective symptoms (such endophenotypes would be expected to lose statistical significance after covarying for affective symptoms) and endophenotypes tapping into genetic substrates of symptoms less specific to bipolar disorder (for example psychotic features; such endophenotypes might remain significant after covarying for affective symptoms).
Potential confounding effects of current psychotropic medication
In contrast to measurements of current mood state, which were distributed continuously in the extended study sample, use of psychotropic medication was almost exclusive to the participants with bipolar disorder. Thus, covarying for medication in our SEM models would be equivalent to covarying for patient status, resulting in a substantial loss of meaningful data variation. However, very few correlations between medication and neuropsychological function were statistically significant, and none survived correction for multiple correlations (online Tables DS1 and DS2). This suggests that medication is not a likely confounder of the findings we report below, although the possibility of residual confounding cannot be excluded.
Results
Demographic, clinical and neurocognitive characteristics
The average age gap within the (non-twin) sibling pairs was 3.75 years (s.d. = 3.23), and did not exceed 5 years in 81% of this subgroup. Using robust regression analyses for clustered observations in Stata (v.10.0), we found no statistically significant differences in age, ethnicity or education between patients, non-bipolar disorder co-twins/siblings and controls. However, significant (P<0.05/0.001) group differences emerged for gender, BDI score and ASRM score. Post hoc contrasts indicated that, on a statistically significant level (P<0.05/0.001), gender differed between patients and controls, case participants scored higher on the BDI and ASRM than non-bipolar disorder co-twins/siblings and controls, and MZ non-bipolar disorder co-twins scored higher on the BDI than controls.
Of the 80 patients, 76 (95%, 47 MZ) met criteria for lifetime DSM-IV diagnoses of bipolar I disorder, 2 (2.5%, 1 MZ) of bipolar II disorder, and 2 (2.5%, 2 MZ) of schizoaffective disorder–bipolar type. Six patients (8%, 4 MZ) met criteria for current comorbid alcohol dependence or cannabis misuse. With the exception of 10 participants with bipolar disorder who were medication-free and 4 participants who were missing information on medication, all patients were receiving psychotropic medication at the time of the assessment, including mood stabilising (n = 48; 63.2% of patients), antipsychotic (n = 34; 44.7% of patients), antidepressant (n = 28; 36.8% of patients) and sedative-hypnotic (n = 13; 17.1% of patients) medication. Detailed information on the medication received by the participants with bipolar disorder is presented in online Table DS3. Of the 48 non-bipolar disorder co-twins and siblings, 17 (35%, 12 MZ) met criteria for lifetime DSM-IV diagnoses of major depressive disorder, 2 (4%, 2 MZ) of anxiety disorders and 2 (4%, 1 MZ) of substance-related disorders, whereas 2 (4%, 2 MZ) had current comorbid alcohol or cannabis dependence. Six non-bipolar disorder co-twins/siblings (13%, 2 MZ) were receiving antidepressants at the time of the assessment. Of the 203 control twins and siblings, 8 (4%, 5 MZ) met criteria for lifetime DSM-IV diagnoses of major depressive disorder, 4 (2%, 3 MZ) of anxiety disorders and 4 (2%, 4 MZ) of substance-related (none current) disorders. Two controls (1%, 1 MZ) were receiving antidepressants at the time of the study.
The mean cognitive scores and the results of the statistical group comparisons in neurocognitive function are shown in Fig. 1 and in online Tables DS4 and DS5. A graded pattern of performance was noted (with controls and DZ non-bipolar disorder co-twins/siblings performing best, and with patients and MZ non-bipolar disorder co-twins performing worst), consistent with different effects on neurocognition of different degrees of genetic susceptibility to bipolar illness (Fig. 1). However, only patients with bipolar disorder showed statistically significant deficits compared with the controls (Table DS5).
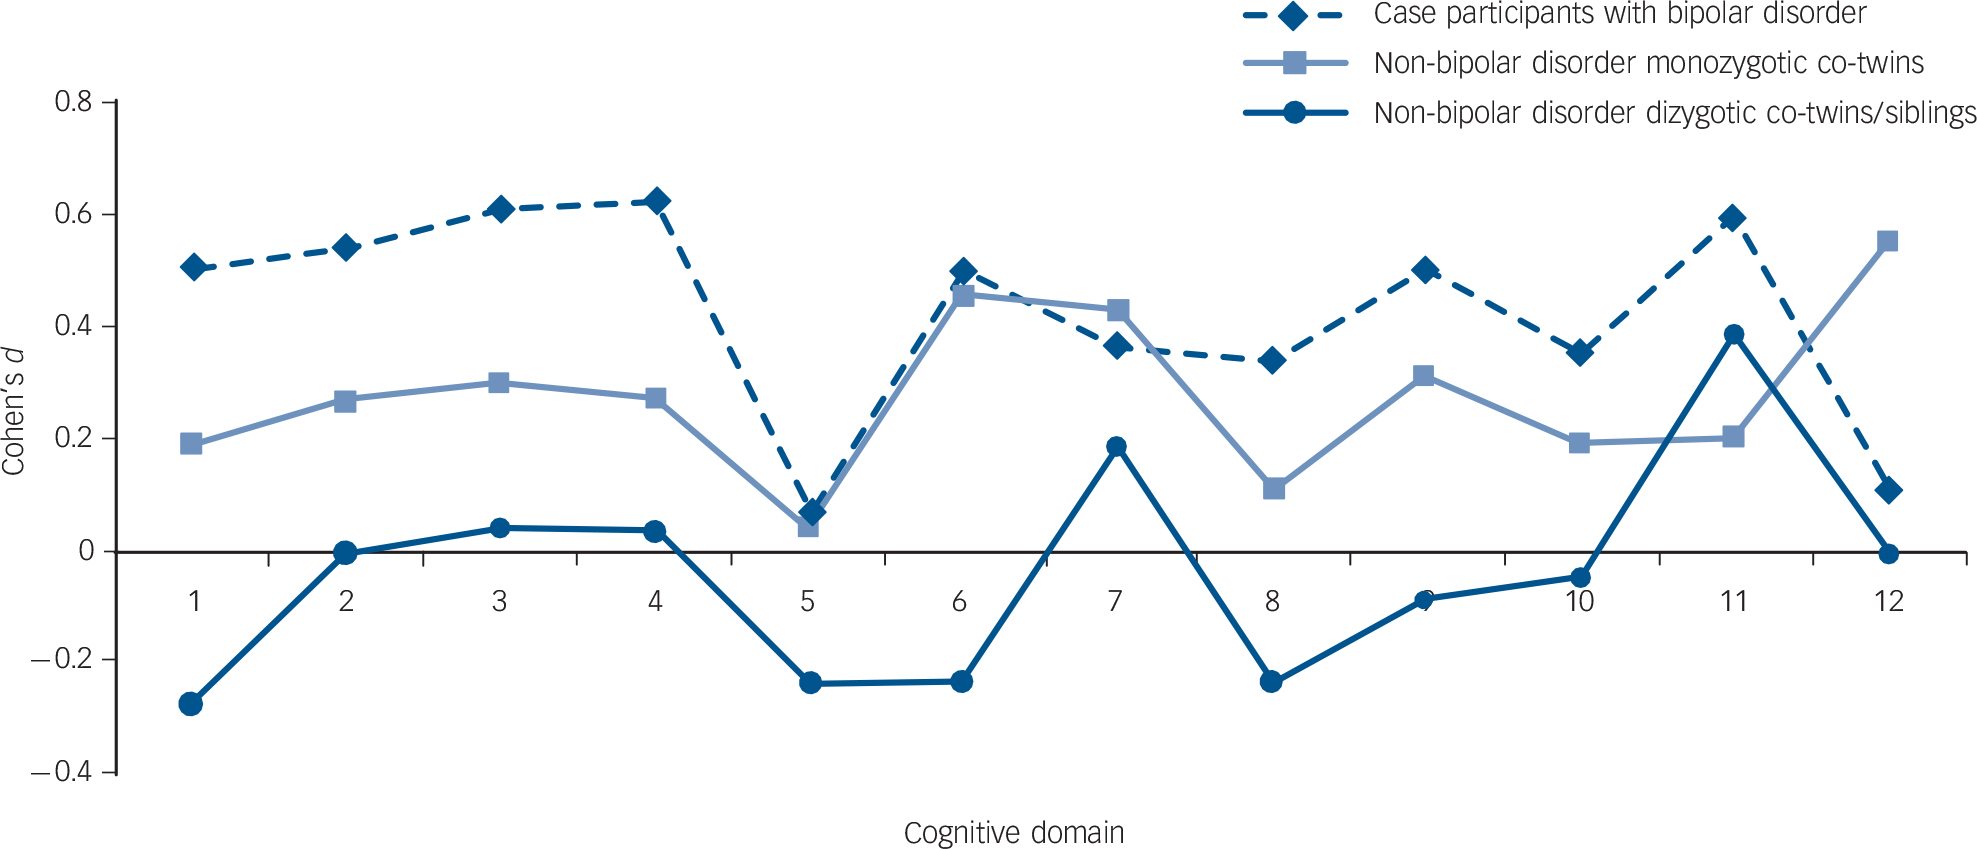
Fig. 1 Mean effect sizes (Cohen's d) of neurocognitive dysfunction in the patients with bipolar disorder and their non-bipolar disorder co-twins/siblings.
To ensure comparability across cognitive domains, where applicable, signs were reversed so that positive effect sizes always denoted worse, and negative effect sizes better, performance compared with controls. On the x-axis: 1. Wechsler Abbreviated Scale of Intelligence full-scale IQ; 2. California Verbal Learning Test (CVLT) immediate recall/learning; 3. CVLT delayed recall; 4. CVLT delayed recognition; 5. Intra-Extra Dimensional Set Shifting (IED) total trials; 6. Paired Associates Learning (PAL) total trials; 7. Pattern Recognition Memory (PRM) per cent correct; 8. PRM mean correct latency; 9. Spatial Working Memory (SWM) between errors; 10. SWM strategy; 11. Rapid Visual Processing (RVP) A prime; 12. RVP B double prime.
Bivariate twin modelling analysis: twin/sibling correlations
All neurocognitive measures yielded statistically significant correlations with bipolar disorder (from 0.13 to −0.24, online Table DS6), with the exception of IED total trials and RVP B double prime, which were excluded from further genetic analyses. The cross-twin/sibling within-trait- and cross-trait correlations (online Table DS7) showed higher values for MZ than DZ twins and siblings for most variables.
Additive genetic, shared environmental and unique environmental effects on neurocognition
Table 2 shows the additive genetic (h 2), shared environmental (c 2) and unique environmental (e 2) effects on the ten neurocognitive variables that yielded statistically significant correlations with bipolar disorder. Genetic factors accounted moderately and significantly for total variation in full-scale IQ, delayed recall, delayed recognition, SWM between errors and RVP A prime. Small, but statistically significant heritabilities were also found for PAL total trials and PRM mean correct latency. Shared environment did not explain inter-individual differences to a statistically significant extent (except for PAL total trials and PRM mean correct latency), whereas individual-specific environmental effects accounted for a significant portion of variance in all measures (Table 2).
Table 2 Additive genetic, common environmental and unique environmental estimates of the full ACE genetic model for the neurocognitive measures a
| h 2 (95% CI) | C 2 (95% CI) | e 2 (95% CI) | |
|---|---|---|---|
| Wechsler Abbreviated Scale of Intelligence full-scale IQ | 0.54 (0.23–0.76) | 0.16 (0.00–0.44) | 0.30 (0.22–0.40) |
| California Verbal Learning Test | |||
| Immediate recall/learning | 0.24 (0.00–0.61) | 0.26 (0.00–0.50) | 0.50 (0.37–0.66) |
| Delayed recall | 0.52 (0.19–0.66) | 0.01 (0.00–0.26) | 0.47 (0.34–0.63) |
| Delayed recognition | 0.37 (0.01–0.62) | 0.11 (0.00–0.44) | 0.52 (0.38–0.69) |
| Paired Associates Learning total trials | 0.13 (0.02–0.43) | 0.29 (0.11–0.44) | 0.58 (0.46–0.72) |
| Pattern Recognition Memory | |||
| Per cent correct | 0.36 (0.00–0.51) | 0.00 (0.00–0.36) | 0.64 (0.47–0.80) |
| Mean correct latency | 0.14 (0.01–0.54) | 0.37 (0.02–0.49) | 0.49 (0.38–0.63) |
| Spatial Working Memory | |||
| Between errors | 0.56 (0.19–0.71) | 0.05 (0.00–0.35) | 0.39 (0.29–0.54) |
| Strategy | 0.06 (0.00–0.37) | 0.24 (0.00–0.41) | 0.70 (0.41–0.84) |
| Rapid Visual Processing A prime | 0.47 (0.10–0.64) | 0.04 (0.00–0.33) | 0.49 (0.36–0.66) |
a. h 2, c 2 and e 2 indicate heritability, shared environmental and unique environmental effects respectively. Parameters for bipolar disorder are fixed based on a prevalence of 1% and the following genetic model : h 2 = 0.81, c 2 = 0.07, e 2 = 0.12. Results in bold have a statistically significant point estimate (the 95% confidence interval excludes 0). Only results for neurocognitive measures that showed statistically significant within-twin/sibling cross-trait correlations with bipolar disorder (online Table DS1) are reported.
A, C and E overlap between bipolar disorder and neurocognition
The total phenotypic correlations (r ph: ranging from |0.13| to |0.23|) suggested that liability to bipolar disorder was significantly associated with poorer performance in all ten measures that were included in the genetic analyses (Table 3). Moderate to high genetic correlations (r g) with bipolar disorder were found for full-scale IQ, delayed recognition, PAL total trials and SWM strategy, and small–moderate ones for delayed recall and SWM between errors. All six correlations were statistically significant, except for SWM strategy (Table 3). No r c or r e correlations with bipolar disorder were significant, except for the r c correlation for PAL total trials and the r e correlations for PRM mean correct latency and RVP A Prime (Table 3).
Table 3 Phenotypic correlations between bipolar disorder and neurocognitive measures, the decomposed sources of these correlations as predicted by the full ACE models, and A, C and E correlation estimates a
| r ph-a | r ph-c | r ph-e | r ph (95% CI) | rg (95% CI) | rc (95% CI) | re (95% CI) | |
|---|---|---|---|---|---|---|---|
| Wechsler Abbreviated Scale of Intelligence full-scale IQ |
−0.34 | 0.11 | 0.02 | −0.21 (−0.30 to −0.10) | −0.51 (−0.98 to −0.20) | 1.00 (−0.79 to 1.00) | 0.11 (0.19 to 0.39) |
| California Verbal Learning Test | |||||||
| Immediate recall/learning | −0.27 | 0.11 | −0.04 | −0.20 (−0.30 to −0.10) | −0.61 (−1.00 to 0.05) | 0.79 (−1.00 to 1.00) | −0.16 (−0.44 to 0.15) |
| Delayed recall | −0.21 | 0.03 | −0.05 | −0.23 (−0.32 to −0.13) | −0.32 (−0.79 to −0.04) | 0.99 (−0.99 to 1.00) | −0.21 (−0.48 to 0.09) |
| Delayed recognition | −0.25 | 0.08 | −0.04 | −0.21 (−0.31 to −0.11) | −0.46 (−1.00 to −0.25) | 0.92 (−0.99 to 0.99) | −0.16 (−0.44 to 0.11) |
| Paired Associates Learning total trials |
0.32 | −0.14 | −0.01 | 0.17 (0.07 to 0.26) | 1.00 (0.32 to 1.00) | −0.26 (−1.00 to −0.28) | 0.08 (−0.21 to 0.37) |
| Pattern Recognition Memory | |||||||
| Per cent correct | −0.15 | 0.00 | 0.02 | −0.13 (−0.22 to −0.03) | −0.28 (−1.00 to 1.00) | 0.08 (−0.21 to 0.37) | −0.12 (−0.44 to 0.22) |
| Mean correct latency | 0.20 | −0.16 | 0.09 | 0.13 (0.02 to 0.23) | 0.23 (−0.17 to 1.00) | −1.00 (−1.00 to 1.00) | 0.37 (0.06 to 0.64) |
| Spatial Working Memory | |||||||
| Between errors | 0.22 | −0.06 | 0.05 | 0.22 (0.11 to 0.32) | 0.33 (0.01 to 0.82) | −1.00 (−1.00 to 1.00)) | 0.25 (−0.05 to 0.64) |
| Strategy | 0.22 | −0.08 | 0.03 | 0.17 (0.01 to 0.27) | 1.00 (−1.00 to 1.00) | −0.58 (−1.00 to 1.00) | 0.09 (−0.23 to 0.39) |
| Rapid Visual Processing A prime | −0.09 | −0.06 | −0.08 | −0.23 (−0.33 to −0.12) | −0.15 (−0.99 to 0.65) | −0.99 (−0.99 to 0.82) | −0.35 (−0.62 to −0.03) |
a. r ph-a, r ph-c and r ph-e indicate the phenotypic correlations as a result of the additive genetic, shared environmental and unique environmental influences respectively; r ph indicates the total phenotypic correlation; r g, rc and re indicate the genetic, shared environmental and unique environmental correlations respectively. The fixed genetic model for bipolar disorder used the following parameters: h 2 = 0.81, c 2 = 0.07, e 2 = 0.12. Results in bold have a statistically significant point estimate (the 95% confidence interval excludes 0). Only neurocognitive measures that showed statistically significant within-twin/sibling cross-trait correlations with bipolar disorder (online Table DS1) were entered in this analysis.
Neurocognitive endophenotypes for bipolar disorder
Of the ten neurocognitive variables that yielded statistically significant correlations with bipolar disorder, five measures – CVLT delayed recall, CVLT delayed recognition, SWM between errors, PAL-total trials and full-scale IQ – also yielded statistically significant estimates of heritability (h 2) and total phenotypic (r ph) and genetic (r g) correlations with bipolar disorder, therefore emerging as endophenotypes. Since the confidence intervals of these estimates were relatively wide, we performed further analysis using a parsimonious AE model for the three measures (CVLT delayed recall, CVLT delayed recognition, SWM between errors) that showed negligible shared environmental effects (c 2). This was decided on the basis of a c 2 component that was both lower than 15% and statistically non-significant (Table 2).
The AE model
In the AE model (Table 4 and Fig. 2), CVLT delayed recall and recognition and SWM between errors showed moderate to substantial heritabilities (h 2), small total phenotypic correlations with bipolar disorder (r ph) and small genetic correlations (r g) with bipolar disorder, but all were statistically significant. Based on the point estimates of the genetic correlations (r g), the three traits share 5–7% of genetic variance with bipolar disorder (for example r g 2 = −0.272 = 7%). Additive genetic effects account for approximately 73–81% of the total phenotypic correlation between bipolar disorder and each measure (for example r ph-a/r ph × 100 = 0.16/0.22 × 100 = 73%).
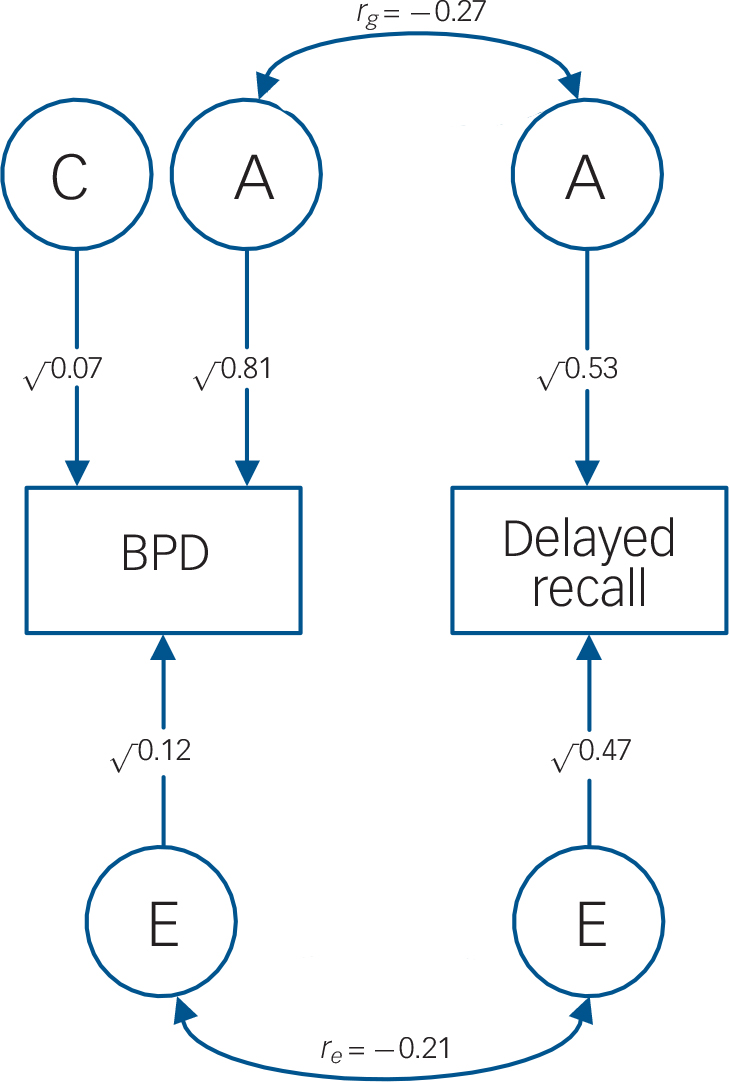
Fig. 2 AE model: genetic and unique environmental correlations between bipolar disorder and delayed recall.
Circles, latent variables; squares, observed phenotypes; double-headed arrows, correlations among the latent variables; single-headed arrows, path coefficients for the effects of A, C and E on the observed trait; A, additive genetic effects; C, shared environmental effects; E, unique environmental effects; BPD, bipolar disorder; rg, genetic correlation between bipolar disorder and delayed recall; re, the unique environmental correlation between bipolar disorder and delayed recall.
Table 4 Results of the AE model: a additive genetic and unique environmental estimates, phenotypic correlations with bipolar disorder, the decomposed sources of these correlations and A and E correlation estimates b
| h 2 | e 2 | r ph-a | r ph-e | r ph | r g | re | |
|---|---|---|---|---|---|---|---|
| California Verbal Learning Test | |||||||
| Delayed recall | 0.53 (0.37 to 0.66) | 0.47 (0.34 to 0.63) | −0.18 | −0.05 | −0.23 (−0.33 to −0.13) | −0.27 −0.45 to −0.10) | −0.21 (−0.48 to 0.08) |
| Delayed recognition | 0.50 (0.34 to 0.63) | 0.50 (0.37 to 0.66) | −0.17 | −0.04 | −0.21 (−0.31 to −0.11) | −0.26 (−0.44 to −0.09) | −0.18 (−0.45 to 0.10) |
| Spatial Working Memory between errors |
0.61 (0.48 to 0.72) | 0.39 (0.28 to 0.53) | 0.16 | 0.06 | 0.22 (0.12 to 0.32) | 0.23 (0.07 to 0.39) | 0.27 (−0.07 to 0.39) |
a. For the three cognitive traits that showed statistically significant (a) heritabilities (h 2), (b) total phenotypic correlations with bipolar disorder (r ph), (c) genetic correlations with bipolar disorder (r g) and (d) statistically non-significant shared environmental effects (c 2) that were lower than 15%.
b. h 2 and e 2 indicate heritability and unique environmental effects respectively; r ph-a and r ph-e indicate the phenotypic correlations as a result of the additive genetic and unique environmental influences respectively; r ph indicates the total phenotypic correlation; r g and r e indicate the genetic and unique environmental correlations respectively. Parameters for bipolar disorder are fixed based on a prevalence of 1% and the following genetic model : h 2 = 0.81, c 2 = 0.07, e 2 = 0.12. Results in bold are statistically significant (the 95% confidence interval excludes 0).
Exploratory analysis: covarying for current mood state
Covarying for current mood state in the bivariate genetic analysis of the five emergent endophenotypes (online Tables DS8 and DS9) both reduced the size and eliminated the statistical significance of the genetic correlations (r g) for CVLT delayed recall and recognition and for SWM between errors (Table DS9). However, this elaboration did not affect the pattern of findings for full-scale IQ and PAL total trials. The latter continued to show statistically significant total phenotypic (r ph) and genetic (r g) correlations with bipolar disorder (Table DS9).
Addressing diagnostic confounders
Excluding patients with bipolar II disorder (n = 2) or schizoaffective disorder–bipolar type (n = 2) from the analysis did not modify the pattern of findings. Because of their negligible sample size, we could not repeat our analyses within each of the latter diagnostic subgroups.
Discussion
Shared genetic variance between bipolar disorder and verbal episodic and spatial working memory: the AE model
In line with our hypotheses, delayed verbal recall/recognition and spatial working memory received support as endophenotypes for bipolar disorder. Using a parsimonious AE model (undertaken to address the wide confidence intervals of the ACE r g estimates), these measures showed statistically significant heritabilities (h 2 = 50–61%) and total phenotypic (r ph = |0.21|–|0.23|) and genetic (r g = |0.23|–|0.27|) correlations with bipolar disorder. Shared genetic influences (r ph-a) accounted for the most part (73–81%; calculated as r ph-a/r ph × 100) of the overall phenotypic correlation (r ph) between bipolar disorder and each measure. However, each trait showed modest shared genetic variation (r g) with bipolar disorder (5–7%; calculated as r g 2), challenging the notion of a substantial share in aetiological factors with bipolar disorder.
Our results from the AE model are in line with the findings of a large population-based study of twins and siblings, Reference Fowler, Zammit, Owen and Rasmussen36 which reported small phenotypic correlations between premorbid IQ and psychosis (r = −0.11 for psychosis in general and r = −0.07 for non-affective psychosis). In contrast, a study of multi-generational families multiply affected with bipolar disorder reported substantially higher genetic correlations (r = −0.57 to −0.70) between bipolar disorder and measures of working, facial and object memory. Reference Glahn, Almasy, Barguil, Hare, Peralta and Kent4 To the best of our knowledge, no other published study has performed model-fitting analyses in neurocognitive data-sets derived from patients with bipolar disorder and their first-degree relatives to allow further comparisons with our study.
Our results corroborate the balance of current evidence, which has drawn attention to verbal recall and learning as a putative endophenotype for bipolar disorder. Reference Kravariti, Kane, Murray and Ritsner11 They further suggest that spatial working memory also deserves attention as an endophenotype for bipolar disorder.
Shared genetic variance between bipolar disorder and measures of IQ and visual-spatial learning: the ACE model
Intelligence and visual-spatial learning also received support as endophenotypes for bipolar disorder. Like verbal episodic and spatial working memory, these two measures elicited wide confidence intervals in the ACE model. However, they were not included in the AE model, because their shared environmental effects (c 2) were higher than 15%, and thus not negligible. According to the ACE model, the shared genetic variance (equal to r g 2) between IQ and bipolar disorder is at least 4% (95% CI = |0.20|–|0.98|) and that between visual-spatial learning and bipolar disorder is at least 10% (95% CI = |0.32|–|1.00|), but the true values could be much higher.
The psychosis continuum hypothesis
Over a decade ago, Murray and colleagues proposed that, on a background of shared genetic predisposition to psychosis, schizophrenia, but not bipolar disorder, is subject to additional genes (and/or early environmental insults) which impair neurodevelopment, resulting in life-long cognitive, motor and social deficits. Reference Murray, Sham, Van Os, Zanelli, Cannon and McDonald35 The shared genetic variance between bipolar disorder and delayed verbal recall in the present study (7%) is markedly lower than the shared genetic variance (25%) between schizophrenia and delayed verbal recall in an earlier twin and family study. Reference Toulopoulou, Goldberg, Mesa, Picchioni, Rijsdijk and Stahl37 This differential is particularly revealing in the context of robust evidence that schizophrenia is associated with more pronounced cognitive deficits than bipolar disorder. Reference Krabbendam, Arts, van Os and Aleman38,Reference Zammit, Allebeck, David, Dalman, Hemmingsson and Lundberg39
Covarying for current mood state in the ACE model-fitting analysis of the five emergent endophenotypes eliminated the statistical significance of the r g estimates for verbal episodic and spatial working memory, but did not affect the pattern of findings for IQ and visual-spatial learning. This latter result is difficult to interpret in the context of the present study. However, a possible explanation for future exploration is that verbal episodic and spatial working memory share genetic determinants with affective symptoms, whereas IQ and visual-spatial learning tap into genetic variance shared between bipolar disorder and non-affective psychosis, as proposed by the psychosis continuum hypothesis. Reference Tamminga, Pearlson, Keshavan, Sweeney, Clementz and Thaker14,Reference Murray, Sham, Van Os, Zanelli, Cannon and McDonald35 Supporting this possibility, earlier findings Reference Tamminga, Pearlson, Keshavan, Sweeney, Clementz and Thaker14 suggest that cognitive biomarkers do not regularly discriminate between individuals with different DSM diagnoses across the schizophrenia–psychotic bipolar continuum. In addition, after covarying for affective symptoms, the genetic correlation between IQ and bipolar disorder (−0.45) herein was almost identical with the genetic correlation between IQ and schizophrenia (−0.46) in an earlier study. Reference Toulopoulou, Goldberg, Mesa, Picchioni, Rijsdijk and Stahl37 Future studies with more complex designs need to explore these possibilities, particularly since, clinically, psychotic symptoms are not independent of other symptoms, including anxiety, depressive and manic symptoms.
Strengths and limitations
To our knowledge, this is the first twin and sibling study to examine the shared genetic variation between several cognitive measures and bipolar disorder. The use of advanced SEM techniques is a major strength of the study. It is particularly noteworthy that our statistical comparisons failed to detect significant neurocognitive deficits in the MZ co-twins of the bipolar disorder probands. However, a visual inspection of z-score profiles (Fig. 1) lucidly highlighted that this group was functioning intermediately to case participants and controls, suggesting subtle effects of the bipolar diathesis on neurocognition. SEM powerfully captured these subtle effects, emphasising the unique strengths of model fitting compared with conventional analyses.
Our results need to be interpreted in the context of some limitations. The large 95% confidence intervals around the point estimates of the ACE analysis indicate that a larger sample would have been desirable. However, it is important to note the difficulty in recruiting such a sample because of the rarity of twin pairs where at least one member has a bipolar disorder diagnosis. IQ was high average in the non-bipolar groups, and bordered the high average range in the patients, most likely suggesting that individuals who volunteer to take part in research are systematically higher-functioning than those who do not. This aspect was present in both the affected and control pairs, thereby reducing variability between samples as a result of this aspect. In addition, our patient sample had almost exclusively diagnoses of bipolar I disorder. Consequently, our findings cannot be generalised to bipolar II or schizoaffective disorder, and are more likely to hold true for the psychotic form of bipolar disorder. Finally, as almost all our participants were White, it is important that future studies address the generalisability of our findings to other ethnic groups.
Implications for research
Our finding that intelligence and visual-spatial learning share genetic variance with bipolar disorder needs further exploration, particularly as our ACE analysis gave rise to wide confidence intervals for these two measures, and their statistical significance was not affected by covarying for current mood state. Our findings suggest that identifying a single cognitive phenotype that provides the genetic signature of bipolar disorder is unlikely – no more likely than identifying a single gene with major effects on bipolar disorder. Reference Gershon, Alliey-Rodriguez and Liu40 Therefore, aetiological research in bipolar disorder should consider models incorporating multiple cognitive endophenotypes as a special case of a broader set of multivariate genetic models, Reference Kendler and Neale13 combining cognitive, anatomical and neurochemical markers. Reference Cannon and Keller41
Acknowledgements
We are grateful to all the study participants for making this study possible. The study has received funding support from the Psychiatry Research Trust (PRT). This paper represents independent research part funded by the National Institute for Health Research (NIHR) Biomedical Research Centre at South London and Maudsley NHS Foundation Trust and King's College London. The views expressed are those of the authors and not necessarily those of the NHS, the NIHR or the Department of Health.


eLetters
No eLetters have been published for this article.