


Depression is a condition that represents a burden worldwide. Reference Vos, Flaxman, Naghavi, Lozano, Michaud and Ezzati1 Obesity has consistently been shown to be a risk factor for depression, and several systematic reviews and meta-analyses have evaluated the association between the two. A recent meta-analysis conducted with 15 prospective studies showed a significantly increased overall odds ratio (OR) of depression in an obese population, Reference Luppino, de Wit, Bouvy, Stijnen, Cuijpers and Penninx2 yet this meta-analysis only included studies conducted in Western populations, and no considerations of other ethnicities, such as Asians, were made. In eight of the previous systematic reviews and meta-analyses, Reference Abou Abbas, Salameh, Nasser, Nasser and Godin3–Reference Faith, Butryn, Wadden, Fabricatore, Nguyen and Heymsfield8 there was no analysis focusing on people who were underweight and the studies were limited to certain geographical areas. In addition, the association between weight change and depression has not been properly summarised. It is uncertain whether being underweight affects depression in a larger population or whether being obese is always associated with depression. Both obesity and underweight could be related to depression because the diagnostic criteria in DSM-IV includes increased or decreased appetite as a symptom of depression, which can be related to obesity or underweight. Both conditions can provoke a negative body image that can result in psychological distress and low self-esteem. Reference Ross9 Therefore, we aimed to conduct a systematic review and meta-analysis on all available epidemiological studies, including randomised controlled trials (RCTs), cohort and cross-sectional studies, to evaluate the association between depression and indices of body size covering not only obesity but also underweight. In addition, the relationship between weight change and subsequent depression was assessed. Stratified analysis by gender, age, geographical area, definition of depression and study design was conducted. The participants, interventions, comparisons outcomes and study design (PICOS) in this study are detailed in online Table DS1 (see also online supplement DS1 for the Meta-analysis of Observational Studies in Epidemiology (MOOSE) checklist).
Method
Study selection
A computerised systematic literature search of the PubMed, Embase and Cochrane library databases was performed to identify studies published prior to 10 March 2015. Search keywords were for body size or weight change (“body weight”, “weight change”, “body mass index”, “obesity”, “adiposity”, “thinness”, “underweight” or “overweight”, “waist-hip ratio” and “waist circumference”) and depression (“depressive disorder”, “dysthymic disorder”, “seasonal affective disorder” or “depression”) combined Hand-searching of the references was used for inclusion of additional articles. There was no language restriction. Additional studies were identified from a manual search of all relevant references. Articles were first screened by a review of their titles, and a full-text review was then conducted. Every selection stage involved five independent researchers (four medical doctors (S.J.J., H.-t.W., K.P. and S.J.) and one graduate student (S.C.) in epidemiology). Every article was independently checked by two researchers, and if opinion differed, a third researcher mediated in the final selection. Study data were extracted by two independent researchers (S.J.J, and H.-t.W.). Studies were subdivided into categories according to the study design (RCT, prospective and retrospective cohort, case–control and cross-sectional) and a summary estimate of effect sizes (hazard ratio (HR) or odds ratio).
Inclusion and exclusion criteria
All the studies were conducted in human populations including entire age groups. Articles measuring body mass index (BMI), waist circumference, waist-to-height ratio, waist-to-hip ratio, body fat or relevant variables such as weight change in relation to known measures of depression as an outcome were included. Studies conducted with diagnostic criteria for depression, such as the Diagnostic Interview Schedule (DIS) or Composite International Diagnostic Interview (CIDI), were collected in addition to studies conducted with self-rating scales on depression such as the Beck Depression Inventory (BDI) or the Center for Epidemiologic Studies-Depression Scale (CES-D). We included studies that were conducted using cohort, case–control or cross-sectional designs. If more than two studies were performed in the same population, we chose the study conducted most recently. We excluded case reports, letters, comments and reviews. Studies examining the relationship among body size, weight change and bipolar depression, or studies on depression in relation to pregnancy were also excluded. We excluded non-human experimental studies and studies without a full document (i.e. studies with only an abstract). Additionally, we excluded studies with results that could not be converted to a standardised effect size.
Statistical analysis
The studies were reported as summary statistics in different ways. Although most of the studies reported odds ratios and their 95% confidence intervals, some studies reported the associations as beta-coefficients. Additionally, some reported a frequency table only. In studies with a prospective cohort design, hazard ratios were also reported. We grouped the studies according to the study design (RCT, prospective cohort, case–control and cross-sectional study), and all the summary statistics were converted to odds ratios and 95% confidence intervals, except the results with hazard ratios. If this was not possible, we contacted the study authors by email to obtain the effect sizes as odds ratio values. We used hazard ratio/odds ratio in the final adjustment model. To convert effect sizes and determine pooled mean effect size, we used Review Manager (RevMan) version 5.3 and Stata version 13.0.
As considerable heterogeneity was expected between estimates from the studies, the summary effect size was derived with a random-effect model. We calculated Cochrane's Q and I 2 to quantify heterogeneity. The degree of heterogeneity was categorised as low, moderate and high with threshold values of 25%, 50% and 75%, respectively. Reference Higgins, Thompson, Deeks and Altman10 As we aimed to evaluate the association by demographic variables as possible effect modifiers, we conducted subgroup analysis for gender (men or women), age group among adults (18–50 years or ⩾51 years), continent of residence (Asia, North America, Europe and other) and definition criteria of depression (clinical diagnostic criteria or self-reporting scales).
Publication bias was assessed by funnel plot. Egger's tests may cause bias when using odds ratios, Reference Egger, Davey Smith, Schneider and Minder11 and as the majority of the publications included in our analysis used odds ratios, we were unable to assess publication bias.
Quality assessment
We selected the Risk of Bias Assessment Tool for Nonrandomized Studies (RoBANS) for quality assessment. RoBANS has been validated as a ‘fair’ assessment tool with moderate reliability and promising validity. Reference Kim, Park, Lee, Seo, Sheen and Hahn12 RoBANS is applicable to cross-sectional, case–control and cohort studies and comprises eight items: comparability, participant selection, confounding, exposure measurement, masking of outcome assessments, measurement of outcomes, incomplete outcome and selective reporting of outcomes. Each item is measured as ‘high risk of bias’, ‘low risk of bias’ or ‘uncertain’. For example, as for the ‘confounder’ section, each researcher marked an article to be ‘high risk of bias’ if there were no consideration of the covariates' time varying effect on major hypothesis for cohort studies. For cross-sectional studies, researchers rated ‘high risk’ when there was no description for major covariates using matching, restriction, stratification or propensity score. Each article was cross-checked by two or more researchers. For the quantitative assessment, we totalled the number of ‘high risk of bias’ and ‘uncertain’ items and selected the article as ‘low quality’ if the sum of the items was greater than two. We calculated pooled odds ratios and the I 2 value among the ‘high quality’ and ‘low quality’ articles and compared the pooled odds ratios between the estimated overall studies and the estimates for ‘high-quality’ studies.
Results
Included and excluded studies
A total of 26 868 abstracts were selected from the database search (18 959 from PubMed, 4400 from Embase, 3496 from the Cochrane library, and 13 from hand-searched references). After removing 2744 duplicated publications, a total of 24 124 studies were included for review of the title and full text. Studies conducted with irrelevant subjects, animal studies or those that were not original articles were excluded. Studies were excluded in the final stage primarily because their data were unavailable for the meta-analysis. An additional 25 studies were excluded because there were other studies conducted in same population, which was confirmed by two independent researchers (S.J.J, and H.-t.W.). In such cases, we selected the most recent study. A total of 183 studies were included in the final analysis (online Fig. DS1).
Of the total of 183 studies, 8 were RCTs and 72 were cohort studies. With the exception of one study, all studies with a cohort design were conducted with a prospective cohort design. Six studies were conducted using a case–control design, including one nested case–control study in a cohort. A total of 97 studies were cross-sectional studies. In these results, 38 studies applied the World Health Organization's definition of BMI criteria (1 869 077 participants). 13 In 40 studies, depression was diagnosed by a physician or by a structured diagnostic interview such as the CIDI based on ICD-10 and DSM-IV. Reference Wittchen14 In the remaining 143 studies, a self-reported depression scale was used to define depression. A total of 137 studies (1 508 013 participants) evaluated the link between body size at baseline and development of depression at follow-up, 33 studies (3 447 413 participants) examined the inverse relationship, and 13 studies (1 830 228 participants) tested both directions. The characteristics of the selected studies are presented in online Table DS2. A total of 6 788 834 participants were included in the analysis.
Underweight and subsequent depression
Table 1 presents the overall and subgroup analysis of the relationship between underweight (BMI <18.5 kg/m2 v. a reference BMI of 18.5–24.9 kg/m2) and subsequent depression in adult cohort/cross-sectional studies. The pooled odds ratio for six cohort studies Reference Bjerkeset, Romundstad, Evans and Gunnell15–Reference Batty, Whitley, Kivimaki, Tynelius and Rasmussen20 was 1.16 with statistical significance (95% CI 1.08–1.24) and an I 2 value of 9.3%, suggesting that that there were no substantial systematic deviations between the odds ratios of the studies (Fig. 1). In subgroup analysis, the pooled odds ratio for underweight (BMI <18.5 kg/m2) men was 1.21 (95% CI 1.04–1.40) and the percentage of the total difference across six studies with corresponding data was small to moderate (I 2 = 32.1%). For women who were underweight (BMI <18.5 kg/m2) the pooled odds ratio was 1.12 (95% CI 0.98–1.28). Whereas in the subgroup in which depression was defined using self-reported scales there was no significant association, in the subgroup in which depression was defined with a clinical diagnostic tool there was a pooled odds ratio of 1.14 (95% 1.9–1.19) with an I 2 of 0%.
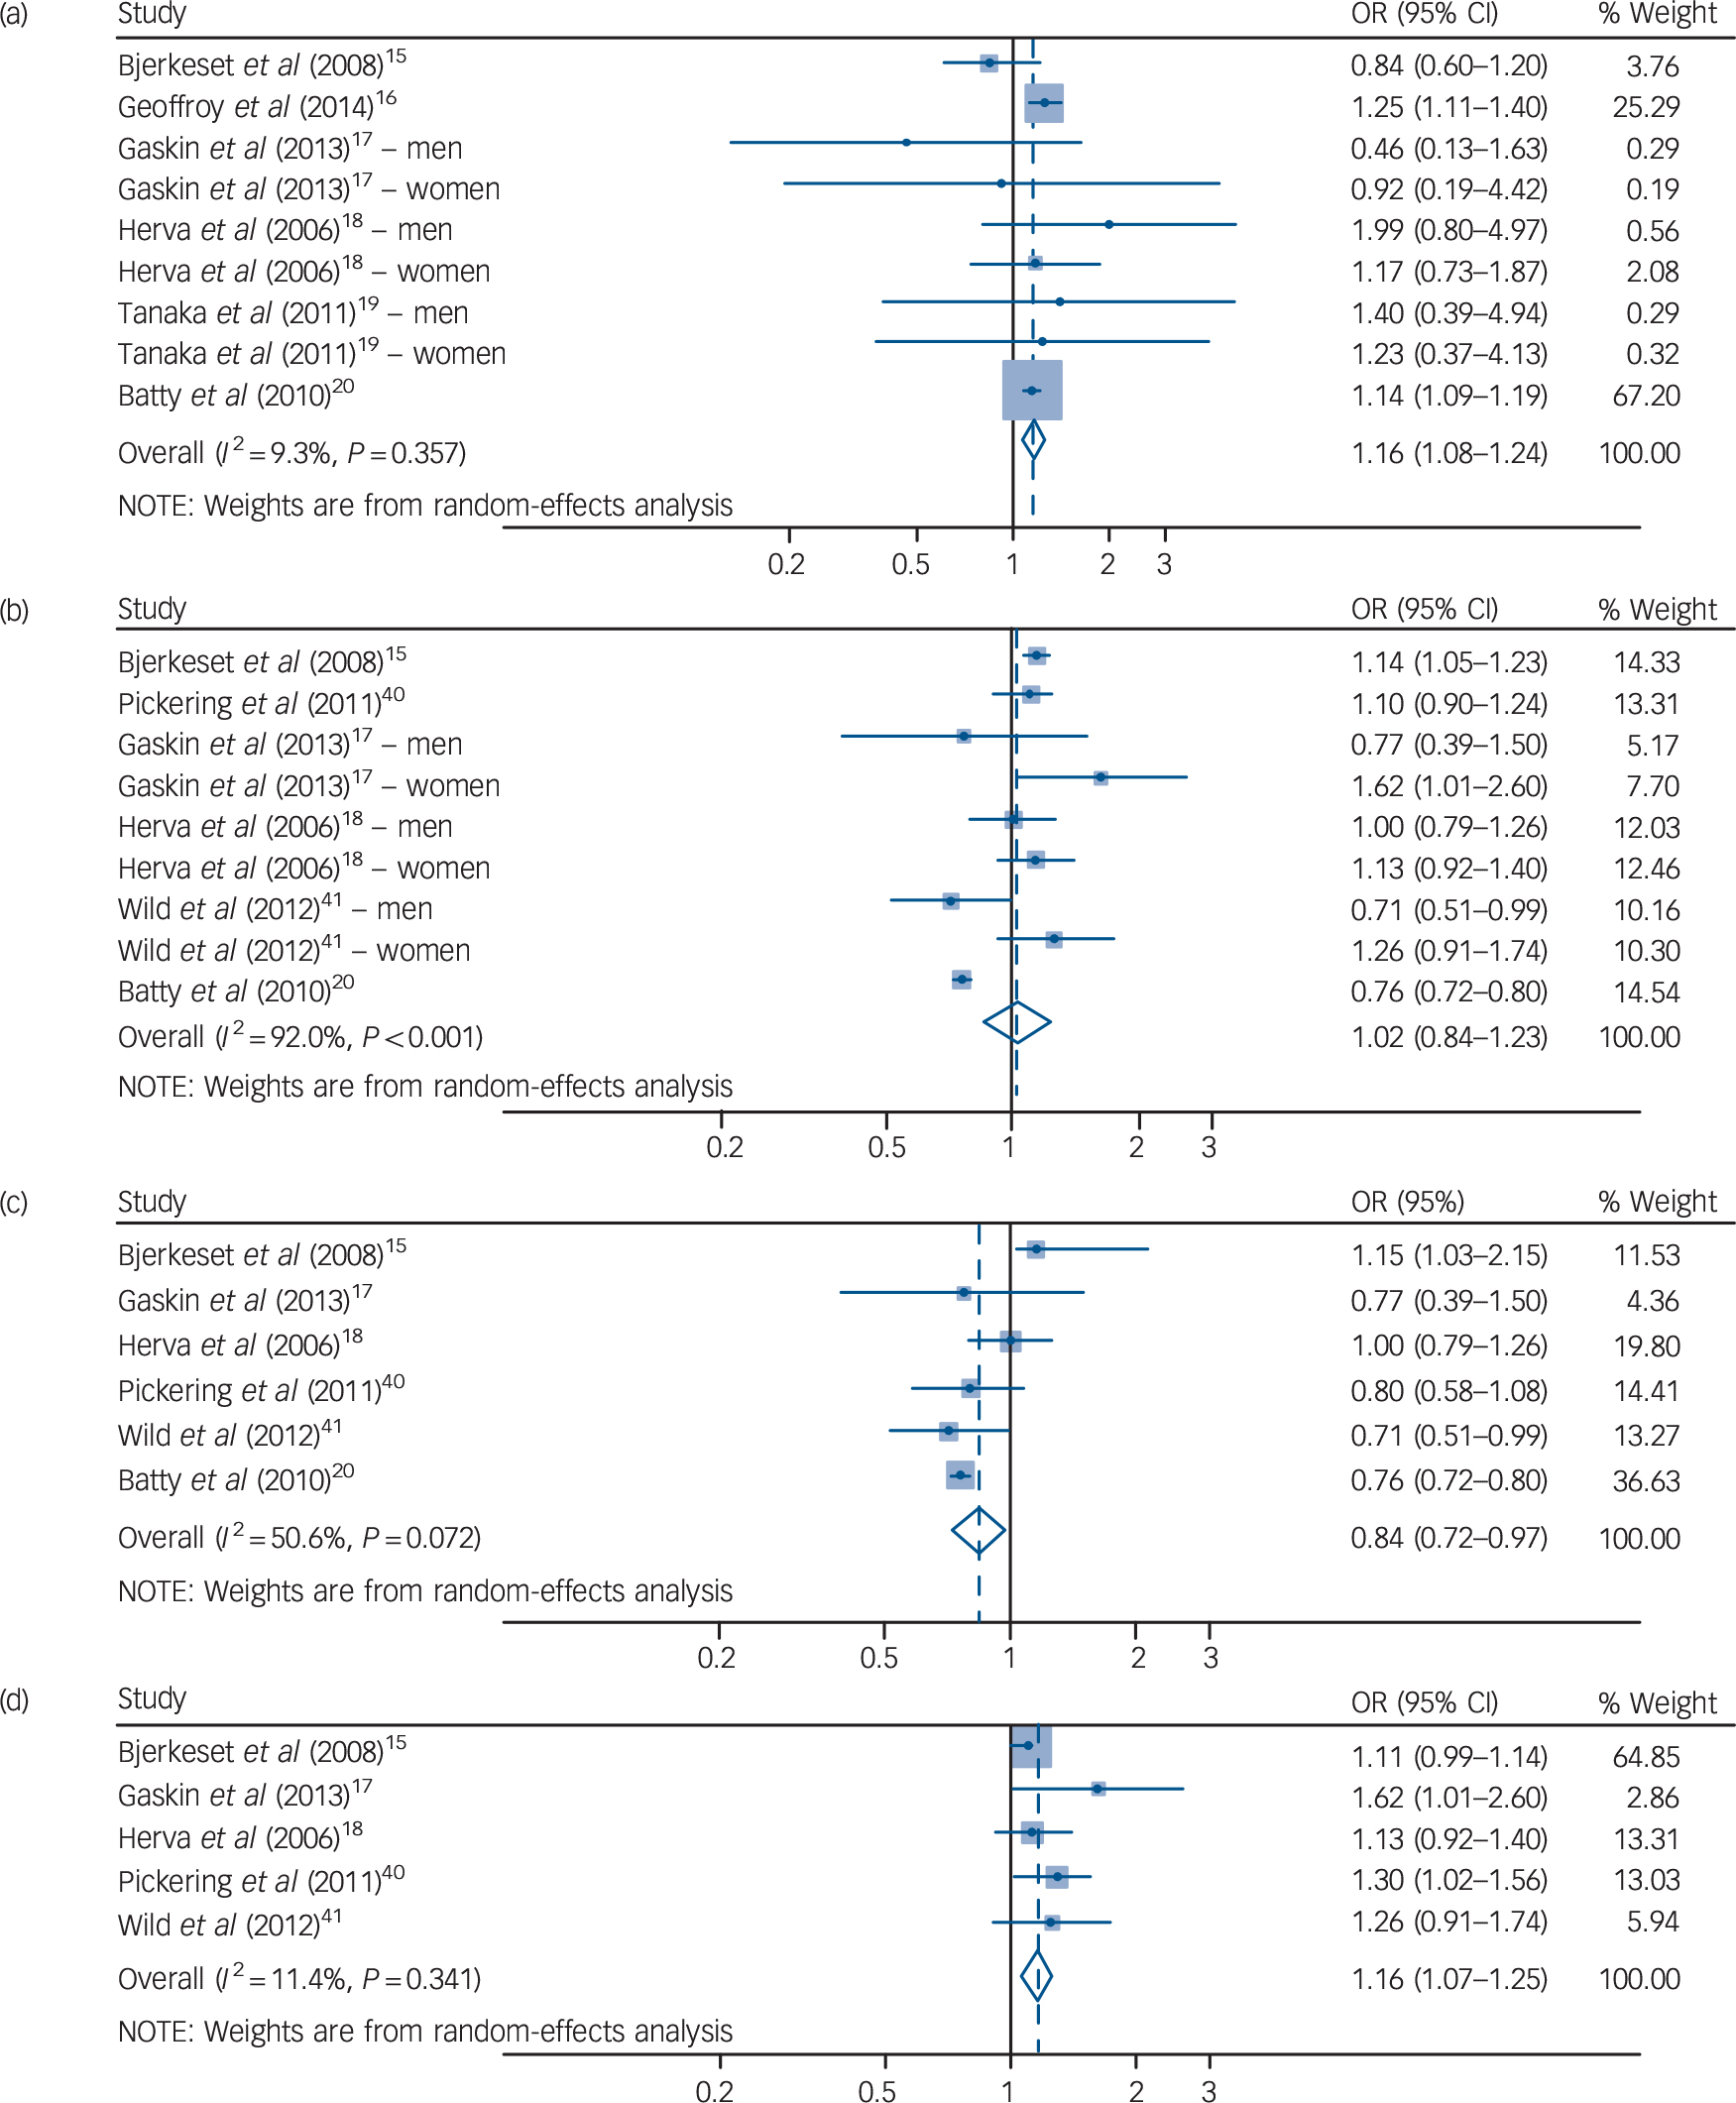
Fig. 1 Forest plot for underweight, overweight and risk of consequent depression in cohort studies.
(a) Underweight (BMI <18.5 kg/m2) and subsequent depression for both genders. Overweight (BMI 25–29.9kg/m2) and subsequent depression for (b) both genders; (c) men only; and (d) women only.
Table 1 Results for underweight (<18.5 kg/m2 v. 18.5–24.9 kg/m2) body mass index and depression
| Studies, n
(participants) |
OR (95% CI) | Q-statistic |
P, heterogeneity |
I 2 |
P, between groups |
|
|---|---|---|---|---|---|---|
| Cohort (adult) | ||||||
| Overall studies | 6 (1 257 109) | 1.16 (1.08–1.24) | 8.82 | 0.357 | 9.3 | |
| Subgroup analysis | ||||||
| Gender | 0.448 | |||||
| Men | 6 (1 203 101) | 1.21 (1.04–1.40) | 7.36 | 0.195 | 32.1 | |
| Women | 5 (72 566) | 1.12 (0.98–1.28) | 3.53 | 0.473 | 0.0 | |
| Age at baseline, 19–50 | 3 (1 160 028) | 1.17 (1.10–1.24) | 3.40 | 0.333 | 11.9 | |
| Depression definition | 0.831 | |||||
| DSM or ICD based | 2 (1 142 220) | 1.14 (1.09–1.19) | 0.11 | 0.945 | 0.0 | |
| Other self-reported | 4 (114 889) | 1.11 (0.87–1.41) | 8.05 | 0.153 | 37.9 | |
| Continent | 0.403 | |||||
| North America | 1 (13 548) | 0.60 (0.23–1.62) | ||||
| Europe | 4 (1 234 360) | 1.16 (1.05–1.28) | 6.62 | 0.157 | 39.6 | |
| Asia | 1 (9201) | 1.31 (0.55–3.14) | ||||
| Cross-sectional (adult) | ||||||
| Overall studies | 20 (453 938) | 1.27 (1.10–1.47) | 57.93 | 0.001 | 51.7 | |
| Subgroup analysis | ||||||
| Gender | 0.857 | |||||
| Men | 11 (212 356) | 1.29 (1.11–1.50) | 8.64 | 0.567 | 0.0 | |
| Women | 10 (133 751) | 1.26 (1.02–1.54) | 15.96 | 0.068 | 43.6 | |
| Depression definition | 0.876 | |||||
| DSM or ICD based | 5 (127 339) | 1.30 (0.91–1.86) | 16.39 | 0.003 | 75.6 | |
| Other self-reported | 15 (326 599) | 1.26 (1.07–1.47) | 39.74 | 0.016 | 42.1 | |
| Continent | 0.044 | |||||
| North America | 8 (177 691) | 1.31 (1.14–1.51) | 10.62 | 0.475 | 0.0 | |
| Europe | 3 (202 028) | 1.15 (0.93–1.43) | 7.82 | 0.098 | 48.8 | |
| Asia | 6 (31 039) | 1.21 (0.77–1.90) | 23.69 | 0.001 | 74.7 | |
| Oceania | 3 (43 180) | 1.88 (1.40–2.40) | 3.68 | 0.452 | 0.0 | |
| Comorbidity | 0.529 | |||||
| Without comorbidity | 19 (453 938) | 1.27 (1.09–1.49) | 54.38 | <0.001 | 55.9 | |
| With diabetes | 2 (65 997) | 1.41 (1.10–1.80) | 0.93 | 0.335 | 0.0 | |
| With metabolic syndrome | 1 (210) | 0.27 (0.01–5.16) | ||||
| With multiple sclerosis | 1 (120) | 0.97 (0.50–1.88) | ||||
For 20 selected cross-sectional studies Reference Herva, Laitinen, Miettunen, Veijola, Karvonen and Laksy18,Reference Chen, Jiang and Mao21–Reference Kress, Peterson and Hartzell39 that investigated the association between underweight and depression, the overall pooled odds ratio was 1.27 (95% CI 1.10–1.47) with moderate heterogeneity (I 2 = 51.7). The results of subgroup analyses did not show statistically significant differences.
Overweight and subsequent depression
As shown in Table 2, a total of six cohort studies Reference Bjerkeset, Romundstad, Evans and Gunnell15,Reference Gaskin, Pulver, Branch, Kabore, James and Zhang17,Reference Herva, Laitinen, Miettunen, Veijola, Karvonen and Laksy18,Reference Batty, Whitley, Kivimaki, Tynelius and Rasmussen20,Reference Pickering, Goldstein, Hasin, Blanco, Smith and Huang40,Reference Wild, Herzog, Lechner, Niehoff, Brenner and Muller41 evaluated the effect of being overweight (BMI 25.0–29.9 kg/m2 v. a reference BMI of 18.5–24.9 kg/m2) on later depression. People in the BMI range of 25–29.9 kg/m2 had a pooled odds ratio of 1.02 that was not statistically significant (95% CI 0.84–1.23). However, the results showed significant heterogeneity, with an I 2 value of 92.0 %. This heterogeneity between studies lessened when gender was considered in subgroup analyses. In men who were overweight, the pooled odds ratio was statistically significant (OR = 0.84, 95% CI 0.72–0.97). The degree of heterogeneity was moderate (I 2 = 50.6%). The pooled odds ratio showed a protective effect of being overweight in men, whereas women showed an increased odds ratio that was statistically significant (OR = 1.16, 95% CI 1.07–1.25). When the analysis was restricted to women, the heterogeneity decreased substantially to an I 2 of 11.4%. The pooled odds ratios between men and women who were overweight were significantly different (P < 0.001), which indicates that being overweight has a protective effect against depression in men but increases the likelihood of depression in women (Fig. 1).
Table 2 Results for overweight (25–29.9kg/m2 v. 18.5–24.9kg/m2) body mass index and depression
| Studies, n
(participants) |
OR (95% CI) | Q-statistic |
P, heterogeneity |
I 2 |
P, between groups |
|
|---|---|---|---|---|---|---|
| Cohort (adult) | ||||||
| Overall studies | 6 (1 275 140) | 1.02 (0.84–1.23) | 99.97 | <0.001 | 92.0 | |
| Subgroup analysis | ||||||
| Gender | <0.001 | |||||
| Men | 6 (1 203 664) | 0.84 (0.72–0.97) | 10.11 | 0.072 | 50.6 | |
| Women | 5 (71 476) | 1.16 (1.07–1.25) | 4.51 | 0.341 | 11.4 | |
| Depression definition | 0.387 | |||||
| DSM or ICD based | 2 (1 167 672) | 0.90 (0.63–1.31) | 18.97 | <0.001 | 94.7 | |
| Other self-reported | 4 (107 468) | 1.08 (0.94–1.24) | 12.37 | 0.054 | 51.5 | |
| Continent | 0.409 | |||||
| North America | 2 (48 201) | 1.15 (0.85–1.56) | 3.58 | 0.167 | 44.1 | |
| Europe | 4 (1 226 939) | 0.98 (0.78–1.23) | 86.11 | <0.001 | 94.2 | |
| Cross-sectional (adult) | ||||||
| Overall studies | 29 (558 525) | 0.98 (0.91–1.05) | 278.96 | <0.001 | 83.9 | |
| 1 study excluded (Joseph et al 2013) Reference Joseph, Unnikrishnan, Raghavendra Babu, Kotian and Nelliyanil30 | 28 (558 295) | 1.02 (1.00–1.04) | 263.94 | <0.001 | 83.3 | |
| Subgroup analysis | ||||||
| Gender | 0.239 | |||||
| Men | 15 (230 314) | 0.96 (0.88–1.06) | 47.26 | <0.001 | 68.3 | |
| Women | 14 (163 351) | 1.04 (0.95–1.15) | 49.06 | <0.001 | 71.5 | |
| Depression definition | ||||||
| DSM or ICD based | 8 (185 690) | 0.86 (0.71–1.03) | 89.61 | <0.001 | 87.7 | |
| Other self-reported | 20 (372 835) | 1.02 (0.96–1.09) | 122.49 | <0.001 | 73.1 | |
| Continent | 0.083 | |||||
| North America | 14 (274 582) | 0.97 (0.84–1.08) | 177.38 | <0.001 | 86.5 | |
| Europe | 3 (202 028) | 1.08 (0.99–1.16) | 11.48 | 0.022 | 65.2 | |
| Middle East | 1 (294) | 1.65 (0.60–4.58) | ||||
| Asia | 7 (38 441) | 0.95 (0.75–1.21) | 38.41 | <0.001 | 76.6 | |
| Oceania | 3 (43 180) | 0.88 (0.77–1.01) | 6.14 | 0.189 | 34.8 | |
| Comorbidity | 0.352 | |||||
| Without comorbidity | 27 (491 303) | 0.96 (0.89–1.03) | 260.68 | <0.001 | 85.0 | |
| With diabetes | 3 (66 291) | 2.54 (0.64–10.15) | 16.36 | <0.001 | 87.8 | |
| With metabolic syndrome | 1 (210) | 0.89 (0.46–1.72) | ||||
| With multiple sclerosis | 1 (120) | 1.23 (0.91–1.67) | ||||
| With asthma | 1 (601) | 1.05 (0.64–1.74) | ||||
Obesity and subsequent depression
Table 3 presents the relationship between being obese (BMI ⩾30 kg/m2) and depression with a reference BMI of 18.5–24.9 kg/m2 in cohort and cross-sectional studies. In six cohort studies Reference Bjerkeset, Romundstad, Evans and Gunnell15–Reference Herva, Laitinen, Miettunen, Veijola, Karvonen and Laksy18,Reference Batty, Whitley, Kivimaki, Tynelius and Rasmussen20,Reference Pickering, Goldstein, Hasin, Blanco, Smith and Huang40 with participants who were obese (a BMI of 30 kg/m2 or over), the overall pooled odds ratio was 1.13 with marginal significance. Heterogeneity was significant (P-heterogeneity <0.001) with an I 2 value of 82.2%. However, this high heterogeneity decreased to an I 2 value of 0% in strata such as women, depression defined with self-reported scales and the European group in the subgroup analysis, with significantly increased pooled odds ratios.
Table 3 Results for obese (⩾30 kg/m2 v. 18.5–24.9 kg/m2) body mass index and depression
| Studies, n
(participants) |
OR (95% CI) | Q-statistic |
P, heterogeneity |
I 2 |
P, between groups |
|
|---|---|---|---|---|---|---|
| Cohort study, ⩾30 kg/m2 | ||||||
| Overall studies | 6 (1 285 890) | 1.13 (0.96–1.34) | 39.23 | <0.001 | 82.2 | |
| Subgroup analysis | ||||||
| Gender | 0.111 | |||||
| Men | 6 (1 209 455) | 1.03 (0.82–1.30) | 27.47 | <0.001 | 81.8 | |
| Women | 5 (76 435) | 1.26 (1.15–1.38) | 2.51 | 0.643 | 0.0 | |
| Depression definition | 0.095 | |||||
| DSM or ICD based | 2 (1 167 672) | 0.94 (0.69–1.27) | 8.97 | 0.003 | 88.9 | |
| Other self-reported | 4 (118 218) | 1.23 (1.13–1.33) | 3.24 | 0.664 | 0.0 | |
| Continent | 0.848 | |||||
| North America | 2 (48 201) | 1.20 (0.95–1.53) | 2.52 | 0.283 | 20.7 | |
| Europe | 4 (111 444) | 1.23 (1.13–1.33) | 3.23 | 0.519 | 0.0 | |
| Cross-sectional (adult), ⩾30 kg/m2 | ||||||
| Overall studies | 26 (548 407) | 1.18 (1.11–1.26) | 255.57 | <0.001 | 82.8 | |
| Subgroup analysis | ||||||
| Gender | 0.003 | |||||
| Men | 13 (231 219) | 1.07 (0.95–1.19) | 30.35 | 0.004 | 57.2 | |
| Women | 12 (159 521) | 1.41 (1.23–1.63) | 58.99 | <0.001 | 79.7 | |
| Depression definition | 0.572 | |||||
| DSM or ICD based | 8 (176 510) | 1.16 (1.02–1.32) | 68.81 | <0.001 | 86.9 | |
| Other self-reported | 18 (371 897) | 1.29 (1.18–1.42) | 166.41 | <0.001 | 82.0 | |
| Continent | 0.314 | |||||
| North America | 13 (265 402) | 1.27 (1.16–1.39) | 149.7 | <0.001 | 85.3 | |
| Europe | 3 (202 028) | 1.14 (1.00–1.30) | 19.77 | 0.001 | 79.8 | |
| Middle East | 1 (294) | 2.36 (0.90–6.23) | ||||
| Asia | 5 (37 503) | 1.45 (1.04–2.01) | 11.20 | 0.082 | 46.4 | |
| Oceania | 3 (43 180) | 1.06 (0.62–1.79) | 64.06 | <0.001 | 93.8 | |
| Cross-sectional (adult), ⩾40 kg/m2 | ||||||
| Overall studies | 3 (155 663) | 1.59 (1.12–2.24) | 19.51 | 0.001 | 79.5 | |
| 1 study (Beydoun & Wang, 2010) Reference Beydoun and Wang50 excluded | 2 (153 446) | 1.56 (1.18–2.08) | 9.68 | 0.008 | 79.3 | |
| Subgroup analysis | ||||||
| Gender | 0.268 | |||||
| Men | 2 (82 857) | 0.51 (0.06–4.14) | 6.78 | 0.009 | 85.3 | |
| Women | 2 (64 033) | 1.76 (0.99–3.13) | 2.04 | 0.153 | 51.0 | |
There were 26 cross-sectional studies Reference Herva, Laitinen, Miettunen, Veijola, Karvonen and Laksy18,Reference Chen, Jiang and Mao21–Reference Ohayon and Hong23,Reference Osborn, Patel, Liu, Trott, Buchowski and Hargreaves25–Reference Guruprasad, Niranjan and Ashwin29,Reference Liu, Al-Sayegh, Jabrah, Wang, Yan and Zhang31–Reference Kress, Peterson and Hartzell39,Reference Ohayon42–Reference Heo, Pietrobelli, Fontaine, Sirey and Faith49 with results for the association between a BMI of 30 kg/m2 or higher (v. a reference BMI of 18.5–24.9 kg/m2) and depression. The pooled odds ratio in the overall analysis was 1.18 (95% 1.11–1.26), with considerable heterogeneity (I 2 = 82.8). Women showed a higher increase in odds ratio (OR = 1.41, 95% CI 1.23–1.63) compared with men (OR = 1.07, 95% CI 0.95–1.19) and this difference was statistically significant (P = 0.003).
Three cross-sectional studies Reference Onyike, Crum, Lee, Lyketsos and Eaton24,Reference Ul-Haq, Smith, Nicholl, Cullen, Martin and Gill34,Reference Beydoun and Wang50 reported results for obesity with a BMI of 40 kg/m2 or higher compared with a BMI of 18.5–24.9 kg/m2, and the pooled odds ratio increased to 1.59 (95% CI 1.12–2.24). The pooled odds ratio was larger than the pooled estimated odds ratio with a BMI of 30 kg/m2 or over (Table 3).
Waist circumference, weight change and subsequent depression
The overall pooled odds ratio for people who had a waist circumference over 102 cm for men or 88 cm for women was 1.38 and was statistically significant (95% 1.17–1.62, online Table DS3). Online Table DS4 shows the results of overall and subgroup analyses of weight change and subsequent depression in cohort studies. The pooled odds ratio for selected studies that investigated the association between any weight change and subsequent depression was 1.06 with marginal significance (95% CI 0.99–1.15).
Publication bias
In testing publication bias using a funnel plot, there was little possibility for publication bias for each analysis, with the exception of evaluating the effect of weight gain alone compared with no weight change in the cohort design and in the association between waist circumference over 102 cm for men or 88 cm for women and depression.
Result of quality assessment
We assessed the 12 cohort studies and 41 cross-sectional studies that were included in the meta-analysis for BMI categories with a reference BMI of 18.5–22.9, waist circumference (men >102 cm, women >88 cm), weight change and depression. The majority of the studies included in the meta-analysis were found to be of ‘high quality’; however, two cohort studies Reference Cornette5,Reference Herva, Laitinen, Miettunen, Veijola, Karvonen and Laksy18 and seven cross-sectional studies Reference Osborn, Patel, Liu, Trott, Buchowski and Hargreaves25–Reference Carey, Small, Yoong, Boyes, Bisquera and Sanson-Fisher28,Reference Grundy, Cotterchio, Kirsh and Kreiger47,Reference Palinkas, Wingard and Barrett-Connor48,Reference Tully, Baumeister, Bengel, Jenkins, Januszewski and Martin51 contained more than two items assessed as ‘low quality’ (online Tables DS5 and DS6).
We summarised the results according to subgroups of high- and low-quality studies and compared the results of the previous overall pooled odds ratios with the summary odds ratios of the high-quality articles. No significant differences were identified between the comparison sets (online Tables DS7 and DS8).
Discussion
Main findings
In this study, we found that underweight (BMI <18.5 kg/m2) increases the risk of depression onset in both longitudinal and cross-sectional settings. In addition, being overweight (BMI 25.0–29.9 kg/m2) decreased the risk of depression in men and increased the risk in women in cohort designs. Being obese (BMI ⩾30 kg/m2) increased the risk and likelihood of depression in both longitudinal and cross-sectional designs. In cross-sectional studies, people with more severe obesity (BMI ⩾40 kg/m2) showed a stronger association, which reflects a dose-response pattern.
Overall, the heterogeneity of the cohort design studies was much lower than the heterogeneity of the cross-sectional studies. It should also be noted that results from the cross-sectional studies are not free from bias. Several studies have suggested that depression can influence the validity of self-reported BMI in the obese population and that women especially underestimate their BMI. Reference Lawlor, Bedford, Taylor and Ebrahim52 In addition, there is a chance of reverse causality especially in cross-sectional studies. It is possible that people with depression lose weight or the weight loss can precede the depressive symptoms. This can also be a problem in cohort studies with a relatively short period of follow-up of depressive symptoms from the baseline BMI measurement. Reference Gaskin, Pulver, Branch, Kabore, James and Zhang17,Reference Pickering, Goldstein, Hasin, Blanco, Smith and Huang40 Most of the cohort studies included in the final meta-analysis did not consider any limitation or additional adjustment for depression at baseline, however, the study that contributed the largest number in the total population of this synthesis Reference Batty, Whitley, Kivimaki, Tynelius and Rasmussen20 excluded men with a diagnosis of depression at the baseline of the study and showed significantly increased odds ratios for underweight on subsequent depression. Moreover, in our study, the magnitude of the association between obesity and depression did not significantly differ across different study designs. However, the magnitude of association between underweight and depression increased in the cross-sectional studies compared with the cohort studies. It is known that there is a significant association between psychological distress and the perception of being underweight, Reference Atlantis and Ball53 and it is possible that people who developed depression as a result of psychological distress may recall their weight as less than it actually is. Nevertheless, the pooled odds ratios from the cohort studies showed a significantly increased risk for depression in the underweight population.
Being underweight increased the risk or likelihood of depression regardless of gender. In contrast to a large number of studies that investigated the mechanisms that underlie the association between obesity and depression, there are relatively few studies that support the relationship between underweight and depression. Yu et al have suggested that people who are underweight may have a negative body image and that their low self-esteem is correlated with depressive symptoms. Reference Yu, Chen, Liu, Chau and Chang54 In certain societies, being underweight may render a negative body image and increase the possibility of depression in men. Reference Herva, Laitinen, Miettunen, Veijola, Karvonen and Laksy18 However, women who were underweight also showed an increased risk of depression in this study, and there may be potential underlying biological factors in this relationship. It is possible that low levels of leptin can influence the association between low body weight and depression. Leptin levels are decreased in people with low BMI Reference Jequier55 . In addition, leptin is regarded as an effective antidepressant, and there is a strong correlation between low leptin levels and depressive symptoms. Reference Lawson, Miller, Blum, Meenaghan, Misra and Eddy56
In this study, obesity increased the risk for depression in a dose-response manner and this finding is consistent with a previous meta-analysis. Reference Luppino, de Wit, Bouvy, Stijnen, Cuijpers and Penninx2 In overweight and obese populations, the results show gender differences. It seems that the current ideal of thinness affects women more than their male counterparts Reference Kiefer, Leitner, Bauer and Rieder57 and causes more psychological distress in women, which can, in turn, lead to depression. In contrast, men who are overweight showed a significantly decreased risk of depression. Previous research Reference Palinkas, Wingard and Barrett-Connor48 has proposed the ‘jolly fat hypothesis’, which originally asserted that high body weight is negatively associated with depressive symptoms in men. Reference Crisp and McGuiness58
Furthermore, some results differed between continents of residence. These different results reflect that the relationship between body size and depression may be influenced by cultural conception of the ideal body weight and related social pressures on the relationship between body size and depression.
Whereas there were no differences in the risk/likelihood of depression in people who were underweight based on the definitions of depression, differences were detected in the overweight/obese group. In both cohort and cross-sectional studies, people who were overweight and obese with self-reported depression showed a higher increase in odds ratios compared with those with depression confirmed by clinical diagnosis. It is possible that being overweight/obese provoked a subjective depressive mood, whereas it had less influence on the development of clinical depression.
Limitations
In interpreting the findings of this study, several limitations should be considered. First, we only included published studies. Additionally, although we contacted the authors for missing data, we did not receive information from any of the authors. It is possible that the unpublished studies or missing data might cause publication bias. However, the results of Egger's tests suggest that most of the results did not show such bias. Second, although we used fully adjusted estimates where possible for meta-analysis, there is still a chance of residual confounders in each of the studies. Therefore, the true magnitude of the effect of body size, weight change and depression is unknown. However, because the previous meta-analysis only adjusted for age and gender, Reference Luppino, de Wit, Bouvy, Stijnen, Cuijpers and Penninx2 this study considered various other factors, such as lifestyle factors or other major illnesses. Third, ascertainment of depression was mostly conducted based on individual's reports and this may reflect a reporting bias. It is known that people tend to underreport their mental illness in surveys, especially in retrospective settings. Reference Takayanagi, Spira, Roth, Gallo, Eaton and Mojtabai59 Findings in cross-sectional studies may be more greatly affected by this reporting bias. Finally, there was variation in the covariates adjusted for in each study (Table DS9). In cohort studies, most of the studies adjusted for age and sociodemographic variables and three studies included variables regarding mental health. Reference Bjerkeset, Romundstad, Evans and Gunnell15,Reference Gaskin, Pulver, Branch, Kabore, James and Zhang17,Reference Wild, Herzog, Lechner, Niehoff, Brenner and Muller41 We excluded one study Reference Geoffroy, Li and Power16 that did not include sociodemographic factors, but the result was not significantly changed. However, in the cross-sectional studies, there were a number of studies for which we used the numbers directly reported in the articles to calculate crude odds ratios; in these cases we could not conduct additional adjustment for potential covariates. Nevertheless, there was no significant difference compared with our original results when we excluded the studies without any covariates. However, it is possible that the variability in adjustment factors may have led to difference in results. Additionally, there were considerable differences in research methods, sample size, included age groups and gender, depression screening tools and reported effect sizes. These differences might have caused considerable heterogeneity, especially in cross-sectional studies.
Implications
Despite these limitations, our meta-analysis included a large number of studies and a sufficient amount of data. To our knowledge, this study is the first meta-analysis that has found a significant relationship between underweight and depression. The results cover various study types, such as RCT, cohort and cross-sectional designs. The results showed statistical significance with low heterogeneity, especially in studies with a longitudinal design. Underweight was also considered in relation to depression, and data from other continents, such as Asia, were included in the analysis.
In this meta-analysis, being underweight significantly increased the risk of depression. In addition, the relationship between being overweight and subsequent depression differed between the genders. Obesity significantly increased the risk for depression, and as BMI increased, the risk of depression also increased. The findings of this study suggest that being underweight may also be a risk factor for subsequent depression. In clinical practice, medical care providers should pay attention to the mental health of people who are underweight. Likewise, women who are overweight and obese populations should also be monitored for possible depression.
Funding
This study was supported by grant from the SNUH Research Fund.


eLetters
No eLetters have been published for this article.